Free Statistics

of Irreproducible Research!

Author's title

Author*Unverified author*
R Software Modulerwasp_autocorrelation.wasp
Title produced by software(Partial) Autocorrelation Function
Date of computationThu, 13 Mar 2014 09:16:29 -0400
Cite this page as followsStatistical Computations at FreeStatistics.org, Office for Research Development and Education, URL https://freestatistics.org/blog/index.php?v=date/2014/Mar/13/t1394716614h4la6qy6su28rc7.htm/, Retrieved Tue, 14 May 2024 17:09:06 +0000
Statistical Computations at FreeStatistics.org, Office for Research Development and Education, URL https://freestatistics.org/blog/index.php?pk=234220, Retrieved Tue, 14 May 2024 17:09:06 +0000
QR Codes:

Original text written by user:
IsPrivate?No (this computation is public)
User-defined keywords
Estimated Impact133
Family? (F = Feedback message, R = changed R code, M = changed R Module, P = changed Parameters, D = changed Data)
-     [Mean Plot] [] [2014-03-13 13:08:17] [68b3e6320f252e1f50534bfc7f55de90]
- RMPD    [(Partial) Autocorrelation Function] [] [2014-03-13 13:16:29] [0a29af7e4d8d6424b8240e38ffd48a3a] [Current]
Feedback Forum

Post a new message
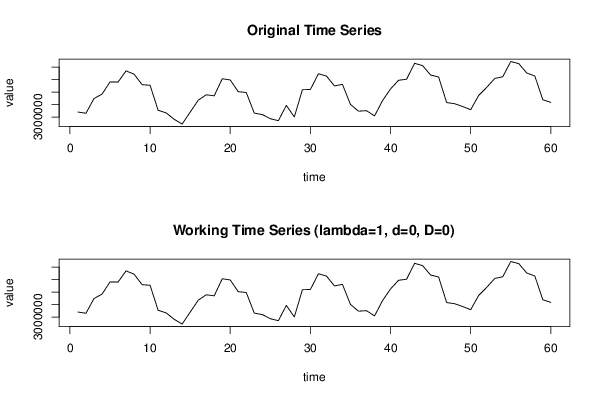
Dataseries X:
3200944
3153170
3741498
3918719
4403449
4400407
4847473
4716136
4297440
4272253
3271834
3168388
2911748
2720999
3199918
3672623
3892013
3850845
4532467
4484739
4014972
3983758
3158459
3100569
2935404
2855719
3465611
3006985
4095110
4104793
4730788
4642726
4246919
4308032
3508154
3236641
3257275
3045631
3657692
4125747
4472507
4513455
5150896
5057815
4681742
4603682
3580181
3534002
3422762
3295209
3868093
4189245
4544332
4612845
5221595
5137505
4760439
4643697
3692267
3587603


Summary of computational transaction
Raw Inputview raw input (R code)
Raw Outputview raw output of R engine
Computing time4 seconds
R Server'Gwilym Jenkins' @ jenkins.wessa.net

\begin{tabular}{lllllllll}
\hline
Summary of computational transaction \tabularnewline
Raw Input & view raw input (R code)  \tabularnewline
Raw Output & view raw output of R engine  \tabularnewline
Computing time & 4 seconds \tabularnewline
R Server & 'Gwilym Jenkins' @ jenkins.wessa.net \tabularnewline
\hline
\end{tabular}
%Source: https://freestatistics.org/blog/index.php?pk=234220&T=0

[TABLE]
[ROW][C]Summary of computational transaction[/C][/ROW]
[ROW][C]Raw Input[/C][C]view raw input (R code) [/C][/ROW]
[ROW][C]Raw Output[/C][C]view raw output of R engine [/C][/ROW]
[ROW][C]Computing time[/C][C]4 seconds[/C][/ROW]
[ROW][C]R Server[/C][C]'Gwilym Jenkins' @ jenkins.wessa.net[/C][/ROW]
[/TABLE]
Source: https://freestatistics.org/blog/index.php?pk=234220&T=0

Globally Unique Identifier (entire table): ba.freestatistics.org/blog/index.php?pk=234220&T=0

As an alternative you can also use a QR Code:  

The GUIDs for individual cells are displayed in the table below:

Summary of computational transaction
Raw Inputview raw input (R code)
Raw Outputview raw output of R engine
Computing time4 seconds
R Server'Gwilym Jenkins' @ jenkins.wessa.net


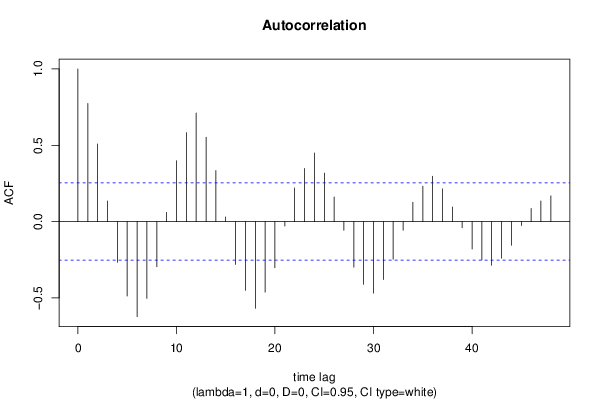
Autocorrelation Function
Time lag kACF(k)T-STATP-value
10.7733085.990
20.5089333.94220.000107
30.1346721.04320.150529
4-0.266474-2.06410.02167
5-0.487301-3.77460.000185
6-0.622752-4.82385e-06
7-0.503037-3.89650.000124
8-0.296117-2.29370.012662
90.0601950.46630.321355
100.3982413.08480.001539
110.5828734.51491.5e-05
120.7118245.51380
130.5521914.27733.4e-05
140.3341252.58810.006044
150.0300440.23270.408387
16-0.280263-2.17090.016952
17-0.450646-3.49070.000455
18-0.567321-4.39442.3e-05
19-0.462111-3.57950.000345
20-0.303009-2.34710.011119
21-0.02911-0.22550.411185
220.2200881.70480.046703
230.3475362.6920.004596
240.4489673.47770.000474
250.3174842.45920.008412
260.1616721.25230.107659
27-0.056307-0.43620.332145
28-0.298181-2.30970.012181
29-0.410569-3.18030.001165
30-0.468822-3.63150.000292
31-0.379243-2.93760.002343
32-0.247174-1.91460.030157
33-0.056922-0.44090.33043
340.1261380.97710.166231
350.2318761.79610.038756
360.2971572.30180.012418
370.2142221.65940.051132
380.0957740.74190.230533
39-0.040334-0.31240.377901
40-0.179778-1.39260.084447
41-0.250897-1.94340.028329
42-0.285898-2.21460.0153
43-0.239622-1.85610.034176
44-0.155366-1.20350.116763
45-0.02547-0.19730.422135
460.0856850.66370.254709
470.1344471.04140.150929
480.1686751.30650.098176

\begin{tabular}{lllllllll}
\hline
Autocorrelation Function \tabularnewline
Time lag k & ACF(k) & T-STAT & P-value \tabularnewline
1 & 0.773308 & 5.99 & 0 \tabularnewline
2 & 0.508933 & 3.9422 & 0.000107 \tabularnewline
3 & 0.134672 & 1.0432 & 0.150529 \tabularnewline
4 & -0.266474 & -2.0641 & 0.02167 \tabularnewline
5 & -0.487301 & -3.7746 & 0.000185 \tabularnewline
6 & -0.622752 & -4.8238 & 5e-06 \tabularnewline
7 & -0.503037 & -3.8965 & 0.000124 \tabularnewline
8 & -0.296117 & -2.2937 & 0.012662 \tabularnewline
9 & 0.060195 & 0.4663 & 0.321355 \tabularnewline
10 & 0.398241 & 3.0848 & 0.001539 \tabularnewline
11 & 0.582873 & 4.5149 & 1.5e-05 \tabularnewline
12 & 0.711824 & 5.5138 & 0 \tabularnewline
13 & 0.552191 & 4.2773 & 3.4e-05 \tabularnewline
14 & 0.334125 & 2.5881 & 0.006044 \tabularnewline
15 & 0.030044 & 0.2327 & 0.408387 \tabularnewline
16 & -0.280263 & -2.1709 & 0.016952 \tabularnewline
17 & -0.450646 & -3.4907 & 0.000455 \tabularnewline
18 & -0.567321 & -4.3944 & 2.3e-05 \tabularnewline
19 & -0.462111 & -3.5795 & 0.000345 \tabularnewline
20 & -0.303009 & -2.3471 & 0.011119 \tabularnewline
21 & -0.02911 & -0.2255 & 0.411185 \tabularnewline
22 & 0.220088 & 1.7048 & 0.046703 \tabularnewline
23 & 0.347536 & 2.692 & 0.004596 \tabularnewline
24 & 0.448967 & 3.4777 & 0.000474 \tabularnewline
25 & 0.317484 & 2.4592 & 0.008412 \tabularnewline
26 & 0.161672 & 1.2523 & 0.107659 \tabularnewline
27 & -0.056307 & -0.4362 & 0.332145 \tabularnewline
28 & -0.298181 & -2.3097 & 0.012181 \tabularnewline
29 & -0.410569 & -3.1803 & 0.001165 \tabularnewline
30 & -0.468822 & -3.6315 & 0.000292 \tabularnewline
31 & -0.379243 & -2.9376 & 0.002343 \tabularnewline
32 & -0.247174 & -1.9146 & 0.030157 \tabularnewline
33 & -0.056922 & -0.4409 & 0.33043 \tabularnewline
34 & 0.126138 & 0.9771 & 0.166231 \tabularnewline
35 & 0.231876 & 1.7961 & 0.038756 \tabularnewline
36 & 0.297157 & 2.3018 & 0.012418 \tabularnewline
37 & 0.214222 & 1.6594 & 0.051132 \tabularnewline
38 & 0.095774 & 0.7419 & 0.230533 \tabularnewline
39 & -0.040334 & -0.3124 & 0.377901 \tabularnewline
40 & -0.179778 & -1.3926 & 0.084447 \tabularnewline
41 & -0.250897 & -1.9434 & 0.028329 \tabularnewline
42 & -0.285898 & -2.2146 & 0.0153 \tabularnewline
43 & -0.239622 & -1.8561 & 0.034176 \tabularnewline
44 & -0.155366 & -1.2035 & 0.116763 \tabularnewline
45 & -0.02547 & -0.1973 & 0.422135 \tabularnewline
46 & 0.085685 & 0.6637 & 0.254709 \tabularnewline
47 & 0.134447 & 1.0414 & 0.150929 \tabularnewline
48 & 0.168675 & 1.3065 & 0.098176 \tabularnewline
\hline
\end{tabular}
%Source: https://freestatistics.org/blog/index.php?pk=234220&T=1

[TABLE]
[ROW][C]Autocorrelation Function[/C][/ROW]
[ROW][C]Time lag k[/C][C]ACF(k)[/C][C]T-STAT[/C][C]P-value[/C][/ROW]
[ROW][C]1[/C][C]0.773308[/C][C]5.99[/C][C]0[/C][/ROW]
[ROW][C]2[/C][C]0.508933[/C][C]3.9422[/C][C]0.000107[/C][/ROW]
[ROW][C]3[/C][C]0.134672[/C][C]1.0432[/C][C]0.150529[/C][/ROW]
[ROW][C]4[/C][C]-0.266474[/C][C]-2.0641[/C][C]0.02167[/C][/ROW]
[ROW][C]5[/C][C]-0.487301[/C][C]-3.7746[/C][C]0.000185[/C][/ROW]
[ROW][C]6[/C][C]-0.622752[/C][C]-4.8238[/C][C]5e-06[/C][/ROW]
[ROW][C]7[/C][C]-0.503037[/C][C]-3.8965[/C][C]0.000124[/C][/ROW]
[ROW][C]8[/C][C]-0.296117[/C][C]-2.2937[/C][C]0.012662[/C][/ROW]
[ROW][C]9[/C][C]0.060195[/C][C]0.4663[/C][C]0.321355[/C][/ROW]
[ROW][C]10[/C][C]0.398241[/C][C]3.0848[/C][C]0.001539[/C][/ROW]
[ROW][C]11[/C][C]0.582873[/C][C]4.5149[/C][C]1.5e-05[/C][/ROW]
[ROW][C]12[/C][C]0.711824[/C][C]5.5138[/C][C]0[/C][/ROW]
[ROW][C]13[/C][C]0.552191[/C][C]4.2773[/C][C]3.4e-05[/C][/ROW]
[ROW][C]14[/C][C]0.334125[/C][C]2.5881[/C][C]0.006044[/C][/ROW]
[ROW][C]15[/C][C]0.030044[/C][C]0.2327[/C][C]0.408387[/C][/ROW]
[ROW][C]16[/C][C]-0.280263[/C][C]-2.1709[/C][C]0.016952[/C][/ROW]
[ROW][C]17[/C][C]-0.450646[/C][C]-3.4907[/C][C]0.000455[/C][/ROW]
[ROW][C]18[/C][C]-0.567321[/C][C]-4.3944[/C][C]2.3e-05[/C][/ROW]
[ROW][C]19[/C][C]-0.462111[/C][C]-3.5795[/C][C]0.000345[/C][/ROW]
[ROW][C]20[/C][C]-0.303009[/C][C]-2.3471[/C][C]0.011119[/C][/ROW]
[ROW][C]21[/C][C]-0.02911[/C][C]-0.2255[/C][C]0.411185[/C][/ROW]
[ROW][C]22[/C][C]0.220088[/C][C]1.7048[/C][C]0.046703[/C][/ROW]
[ROW][C]23[/C][C]0.347536[/C][C]2.692[/C][C]0.004596[/C][/ROW]
[ROW][C]24[/C][C]0.448967[/C][C]3.4777[/C][C]0.000474[/C][/ROW]
[ROW][C]25[/C][C]0.317484[/C][C]2.4592[/C][C]0.008412[/C][/ROW]
[ROW][C]26[/C][C]0.161672[/C][C]1.2523[/C][C]0.107659[/C][/ROW]
[ROW][C]27[/C][C]-0.056307[/C][C]-0.4362[/C][C]0.332145[/C][/ROW]
[ROW][C]28[/C][C]-0.298181[/C][C]-2.3097[/C][C]0.012181[/C][/ROW]
[ROW][C]29[/C][C]-0.410569[/C][C]-3.1803[/C][C]0.001165[/C][/ROW]
[ROW][C]30[/C][C]-0.468822[/C][C]-3.6315[/C][C]0.000292[/C][/ROW]
[ROW][C]31[/C][C]-0.379243[/C][C]-2.9376[/C][C]0.002343[/C][/ROW]
[ROW][C]32[/C][C]-0.247174[/C][C]-1.9146[/C][C]0.030157[/C][/ROW]
[ROW][C]33[/C][C]-0.056922[/C][C]-0.4409[/C][C]0.33043[/C][/ROW]
[ROW][C]34[/C][C]0.126138[/C][C]0.9771[/C][C]0.166231[/C][/ROW]
[ROW][C]35[/C][C]0.231876[/C][C]1.7961[/C][C]0.038756[/C][/ROW]
[ROW][C]36[/C][C]0.297157[/C][C]2.3018[/C][C]0.012418[/C][/ROW]
[ROW][C]37[/C][C]0.214222[/C][C]1.6594[/C][C]0.051132[/C][/ROW]
[ROW][C]38[/C][C]0.095774[/C][C]0.7419[/C][C]0.230533[/C][/ROW]
[ROW][C]39[/C][C]-0.040334[/C][C]-0.3124[/C][C]0.377901[/C][/ROW]
[ROW][C]40[/C][C]-0.179778[/C][C]-1.3926[/C][C]0.084447[/C][/ROW]
[ROW][C]41[/C][C]-0.250897[/C][C]-1.9434[/C][C]0.028329[/C][/ROW]
[ROW][C]42[/C][C]-0.285898[/C][C]-2.2146[/C][C]0.0153[/C][/ROW]
[ROW][C]43[/C][C]-0.239622[/C][C]-1.8561[/C][C]0.034176[/C][/ROW]
[ROW][C]44[/C][C]-0.155366[/C][C]-1.2035[/C][C]0.116763[/C][/ROW]
[ROW][C]45[/C][C]-0.02547[/C][C]-0.1973[/C][C]0.422135[/C][/ROW]
[ROW][C]46[/C][C]0.085685[/C][C]0.6637[/C][C]0.254709[/C][/ROW]
[ROW][C]47[/C][C]0.134447[/C][C]1.0414[/C][C]0.150929[/C][/ROW]
[ROW][C]48[/C][C]0.168675[/C][C]1.3065[/C][C]0.098176[/C][/ROW]
[/TABLE]
Source: https://freestatistics.org/blog/index.php?pk=234220&T=1

Globally Unique Identifier (entire table): ba.freestatistics.org/blog/index.php?pk=234220&T=1

As an alternative you can also use a QR Code:  

The GUIDs for individual cells are displayed in the table below:

Autocorrelation Function
Time lag kACF(k)T-STATP-value
10.7733085.990
20.5089333.94220.000107
30.1346721.04320.150529
4-0.266474-2.06410.02167
5-0.487301-3.77460.000185
6-0.622752-4.82385e-06
7-0.503037-3.89650.000124
8-0.296117-2.29370.012662
90.0601950.46630.321355
100.3982413.08480.001539
110.5828734.51491.5e-05
120.7118245.51380
130.5521914.27733.4e-05
140.3341252.58810.006044
150.0300440.23270.408387
16-0.280263-2.17090.016952
17-0.450646-3.49070.000455
18-0.567321-4.39442.3e-05
19-0.462111-3.57950.000345
20-0.303009-2.34710.011119
21-0.02911-0.22550.411185
220.2200881.70480.046703
230.3475362.6920.004596
240.4489673.47770.000474
250.3174842.45920.008412
260.1616721.25230.107659
27-0.056307-0.43620.332145
28-0.298181-2.30970.012181
29-0.410569-3.18030.001165
30-0.468822-3.63150.000292
31-0.379243-2.93760.002343
32-0.247174-1.91460.030157
33-0.056922-0.44090.33043
340.1261380.97710.166231
350.2318761.79610.038756
360.2971572.30180.012418
370.2142221.65940.051132
380.0957740.74190.230533
39-0.040334-0.31240.377901
40-0.179778-1.39260.084447
41-0.250897-1.94340.028329
42-0.285898-2.21460.0153
43-0.239622-1.85610.034176
44-0.155366-1.20350.116763
45-0.02547-0.19730.422135
460.0856850.66370.254709
470.1344471.04140.150929
480.1686751.30650.098176


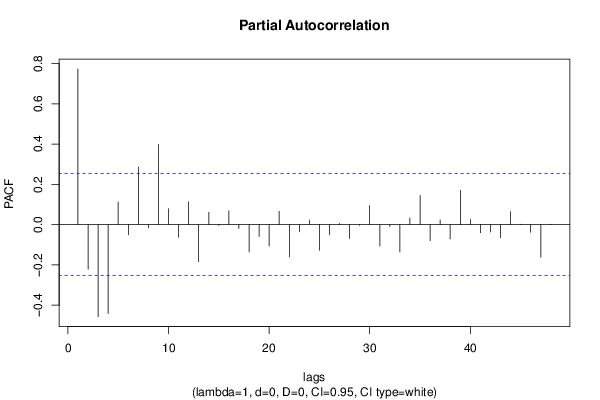
Partial Autocorrelation Function
Time lag kPACF(k)T-STATP-value
10.7733085.990
2-0.221575-1.71630.045632
3-0.457144-3.5410.000389
4-0.441671-3.42120.000564
50.112730.87320.193018
6-0.050675-0.39250.348029
70.2856942.2130.015357
8-0.015556-0.12050.452246
90.3979553.08250.001549
100.0787710.61020.27203
11-0.062688-0.48560.314516
120.1130170.87540.192416
13-0.183834-1.4240.079817
140.0616850.47780.317261
15-0.004481-0.03470.486214
160.0688390.53320.297924
17-0.018784-0.14550.442401
18-0.136328-1.0560.147603
19-0.059335-0.45960.323729
20-0.105868-0.820.207717
210.0661120.51210.30523
22-0.160008-1.23940.110009
23-0.035148-0.27230.393181
240.022420.17370.431357
25-0.127595-0.98830.163476
26-0.050382-0.39030.348865
270.0058970.04570.48186
28-0.068591-0.53130.298584
29-0.003509-0.02720.489203
300.095330.73840.231568
31-0.106207-0.82270.206976
32-0.009265-0.07180.471515
33-0.135303-1.04810.149408
340.0325780.25240.400816
350.1445241.11950.133698
36-0.079549-0.61620.270052
370.0229810.1780.429656
38-0.070949-0.54960.292328
390.171131.32560.095005
400.0256910.1990.421468
41-0.040379-0.31280.37777
42-0.036481-0.28260.389236
43-0.065596-0.50810.306622
440.0644550.49930.30971
450.0019760.01530.493918
46-0.037983-0.29420.384803
47-0.162278-1.2570.106813
480.0021780.01690.493299

\begin{tabular}{lllllllll}
\hline
Partial Autocorrelation Function \tabularnewline
Time lag k & PACF(k) & T-STAT & P-value \tabularnewline
1 & 0.773308 & 5.99 & 0 \tabularnewline
2 & -0.221575 & -1.7163 & 0.045632 \tabularnewline
3 & -0.457144 & -3.541 & 0.000389 \tabularnewline
4 & -0.441671 & -3.4212 & 0.000564 \tabularnewline
5 & 0.11273 & 0.8732 & 0.193018 \tabularnewline
6 & -0.050675 & -0.3925 & 0.348029 \tabularnewline
7 & 0.285694 & 2.213 & 0.015357 \tabularnewline
8 & -0.015556 & -0.1205 & 0.452246 \tabularnewline
9 & 0.397955 & 3.0825 & 0.001549 \tabularnewline
10 & 0.078771 & 0.6102 & 0.27203 \tabularnewline
11 & -0.062688 & -0.4856 & 0.314516 \tabularnewline
12 & 0.113017 & 0.8754 & 0.192416 \tabularnewline
13 & -0.183834 & -1.424 & 0.079817 \tabularnewline
14 & 0.061685 & 0.4778 & 0.317261 \tabularnewline
15 & -0.004481 & -0.0347 & 0.486214 \tabularnewline
16 & 0.068839 & 0.5332 & 0.297924 \tabularnewline
17 & -0.018784 & -0.1455 & 0.442401 \tabularnewline
18 & -0.136328 & -1.056 & 0.147603 \tabularnewline
19 & -0.059335 & -0.4596 & 0.323729 \tabularnewline
20 & -0.105868 & -0.82 & 0.207717 \tabularnewline
21 & 0.066112 & 0.5121 & 0.30523 \tabularnewline
22 & -0.160008 & -1.2394 & 0.110009 \tabularnewline
23 & -0.035148 & -0.2723 & 0.393181 \tabularnewline
24 & 0.02242 & 0.1737 & 0.431357 \tabularnewline
25 & -0.127595 & -0.9883 & 0.163476 \tabularnewline
26 & -0.050382 & -0.3903 & 0.348865 \tabularnewline
27 & 0.005897 & 0.0457 & 0.48186 \tabularnewline
28 & -0.068591 & -0.5313 & 0.298584 \tabularnewline
29 & -0.003509 & -0.0272 & 0.489203 \tabularnewline
30 & 0.09533 & 0.7384 & 0.231568 \tabularnewline
31 & -0.106207 & -0.8227 & 0.206976 \tabularnewline
32 & -0.009265 & -0.0718 & 0.471515 \tabularnewline
33 & -0.135303 & -1.0481 & 0.149408 \tabularnewline
34 & 0.032578 & 0.2524 & 0.400816 \tabularnewline
35 & 0.144524 & 1.1195 & 0.133698 \tabularnewline
36 & -0.079549 & -0.6162 & 0.270052 \tabularnewline
37 & 0.022981 & 0.178 & 0.429656 \tabularnewline
38 & -0.070949 & -0.5496 & 0.292328 \tabularnewline
39 & 0.17113 & 1.3256 & 0.095005 \tabularnewline
40 & 0.025691 & 0.199 & 0.421468 \tabularnewline
41 & -0.040379 & -0.3128 & 0.37777 \tabularnewline
42 & -0.036481 & -0.2826 & 0.389236 \tabularnewline
43 & -0.065596 & -0.5081 & 0.306622 \tabularnewline
44 & 0.064455 & 0.4993 & 0.30971 \tabularnewline
45 & 0.001976 & 0.0153 & 0.493918 \tabularnewline
46 & -0.037983 & -0.2942 & 0.384803 \tabularnewline
47 & -0.162278 & -1.257 & 0.106813 \tabularnewline
48 & 0.002178 & 0.0169 & 0.493299 \tabularnewline
\hline
\end{tabular}
%Source: https://freestatistics.org/blog/index.php?pk=234220&T=2

[TABLE]
[ROW][C]Partial Autocorrelation Function[/C][/ROW]
[ROW][C]Time lag k[/C][C]PACF(k)[/C][C]T-STAT[/C][C]P-value[/C][/ROW]
[ROW][C]1[/C][C]0.773308[/C][C]5.99[/C][C]0[/C][/ROW]
[ROW][C]2[/C][C]-0.221575[/C][C]-1.7163[/C][C]0.045632[/C][/ROW]
[ROW][C]3[/C][C]-0.457144[/C][C]-3.541[/C][C]0.000389[/C][/ROW]
[ROW][C]4[/C][C]-0.441671[/C][C]-3.4212[/C][C]0.000564[/C][/ROW]
[ROW][C]5[/C][C]0.11273[/C][C]0.8732[/C][C]0.193018[/C][/ROW]
[ROW][C]6[/C][C]-0.050675[/C][C]-0.3925[/C][C]0.348029[/C][/ROW]
[ROW][C]7[/C][C]0.285694[/C][C]2.213[/C][C]0.015357[/C][/ROW]
[ROW][C]8[/C][C]-0.015556[/C][C]-0.1205[/C][C]0.452246[/C][/ROW]
[ROW][C]9[/C][C]0.397955[/C][C]3.0825[/C][C]0.001549[/C][/ROW]
[ROW][C]10[/C][C]0.078771[/C][C]0.6102[/C][C]0.27203[/C][/ROW]
[ROW][C]11[/C][C]-0.062688[/C][C]-0.4856[/C][C]0.314516[/C][/ROW]
[ROW][C]12[/C][C]0.113017[/C][C]0.8754[/C][C]0.192416[/C][/ROW]
[ROW][C]13[/C][C]-0.183834[/C][C]-1.424[/C][C]0.079817[/C][/ROW]
[ROW][C]14[/C][C]0.061685[/C][C]0.4778[/C][C]0.317261[/C][/ROW]
[ROW][C]15[/C][C]-0.004481[/C][C]-0.0347[/C][C]0.486214[/C][/ROW]
[ROW][C]16[/C][C]0.068839[/C][C]0.5332[/C][C]0.297924[/C][/ROW]
[ROW][C]17[/C][C]-0.018784[/C][C]-0.1455[/C][C]0.442401[/C][/ROW]
[ROW][C]18[/C][C]-0.136328[/C][C]-1.056[/C][C]0.147603[/C][/ROW]
[ROW][C]19[/C][C]-0.059335[/C][C]-0.4596[/C][C]0.323729[/C][/ROW]
[ROW][C]20[/C][C]-0.105868[/C][C]-0.82[/C][C]0.207717[/C][/ROW]
[ROW][C]21[/C][C]0.066112[/C][C]0.5121[/C][C]0.30523[/C][/ROW]
[ROW][C]22[/C][C]-0.160008[/C][C]-1.2394[/C][C]0.110009[/C][/ROW]
[ROW][C]23[/C][C]-0.035148[/C][C]-0.2723[/C][C]0.393181[/C][/ROW]
[ROW][C]24[/C][C]0.02242[/C][C]0.1737[/C][C]0.431357[/C][/ROW]
[ROW][C]25[/C][C]-0.127595[/C][C]-0.9883[/C][C]0.163476[/C][/ROW]
[ROW][C]26[/C][C]-0.050382[/C][C]-0.3903[/C][C]0.348865[/C][/ROW]
[ROW][C]27[/C][C]0.005897[/C][C]0.0457[/C][C]0.48186[/C][/ROW]
[ROW][C]28[/C][C]-0.068591[/C][C]-0.5313[/C][C]0.298584[/C][/ROW]
[ROW][C]29[/C][C]-0.003509[/C][C]-0.0272[/C][C]0.489203[/C][/ROW]
[ROW][C]30[/C][C]0.09533[/C][C]0.7384[/C][C]0.231568[/C][/ROW]
[ROW][C]31[/C][C]-0.106207[/C][C]-0.8227[/C][C]0.206976[/C][/ROW]
[ROW][C]32[/C][C]-0.009265[/C][C]-0.0718[/C][C]0.471515[/C][/ROW]
[ROW][C]33[/C][C]-0.135303[/C][C]-1.0481[/C][C]0.149408[/C][/ROW]
[ROW][C]34[/C][C]0.032578[/C][C]0.2524[/C][C]0.400816[/C][/ROW]
[ROW][C]35[/C][C]0.144524[/C][C]1.1195[/C][C]0.133698[/C][/ROW]
[ROW][C]36[/C][C]-0.079549[/C][C]-0.6162[/C][C]0.270052[/C][/ROW]
[ROW][C]37[/C][C]0.022981[/C][C]0.178[/C][C]0.429656[/C][/ROW]
[ROW][C]38[/C][C]-0.070949[/C][C]-0.5496[/C][C]0.292328[/C][/ROW]
[ROW][C]39[/C][C]0.17113[/C][C]1.3256[/C][C]0.095005[/C][/ROW]
[ROW][C]40[/C][C]0.025691[/C][C]0.199[/C][C]0.421468[/C][/ROW]
[ROW][C]41[/C][C]-0.040379[/C][C]-0.3128[/C][C]0.37777[/C][/ROW]
[ROW][C]42[/C][C]-0.036481[/C][C]-0.2826[/C][C]0.389236[/C][/ROW]
[ROW][C]43[/C][C]-0.065596[/C][C]-0.5081[/C][C]0.306622[/C][/ROW]
[ROW][C]44[/C][C]0.064455[/C][C]0.4993[/C][C]0.30971[/C][/ROW]
[ROW][C]45[/C][C]0.001976[/C][C]0.0153[/C][C]0.493918[/C][/ROW]
[ROW][C]46[/C][C]-0.037983[/C][C]-0.2942[/C][C]0.384803[/C][/ROW]
[ROW][C]47[/C][C]-0.162278[/C][C]-1.257[/C][C]0.106813[/C][/ROW]
[ROW][C]48[/C][C]0.002178[/C][C]0.0169[/C][C]0.493299[/C][/ROW]
[/TABLE]
Source: https://freestatistics.org/blog/index.php?pk=234220&T=2

Globally Unique Identifier (entire table): ba.freestatistics.org/blog/index.php?pk=234220&T=2

As an alternative you can also use a QR Code:  

The GUIDs for individual cells are displayed in the table below:

Partial Autocorrelation Function
Time lag kPACF(k)T-STATP-value
10.7733085.990
2-0.221575-1.71630.045632
3-0.457144-3.5410.000389
4-0.441671-3.42120.000564
50.112730.87320.193018
6-0.050675-0.39250.348029
70.2856942.2130.015357
8-0.015556-0.12050.452246
90.3979553.08250.001549
100.0787710.61020.27203
11-0.062688-0.48560.314516
120.1130170.87540.192416
13-0.183834-1.4240.079817
140.0616850.47780.317261
15-0.004481-0.03470.486214
160.0688390.53320.297924
17-0.018784-0.14550.442401
18-0.136328-1.0560.147603
19-0.059335-0.45960.323729
20-0.105868-0.820.207717
210.0661120.51210.30523
22-0.160008-1.23940.110009
23-0.035148-0.27230.393181
240.022420.17370.431357
25-0.127595-0.98830.163476
26-0.050382-0.39030.348865
270.0058970.04570.48186
28-0.068591-0.53130.298584
29-0.003509-0.02720.489203
300.095330.73840.231568
31-0.106207-0.82270.206976
32-0.009265-0.07180.471515
33-0.135303-1.04810.149408
340.0325780.25240.400816
350.1445241.11950.133698
36-0.079549-0.61620.270052
370.0229810.1780.429656
38-0.070949-0.54960.292328
390.171131.32560.095005
400.0256910.1990.421468
41-0.040379-0.31280.37777
42-0.036481-0.28260.389236
43-0.065596-0.50810.306622
440.0644550.49930.30971
450.0019760.01530.493918
46-0.037983-0.29420.384803
47-0.162278-1.2570.106813
480.0021780.01690.493299


Parameters (Session):
par1 = 48 ; par2 = 1 ; par3 = 0 ; par4 = 0 ; par5 = 12 ; par6 = White Noise ; par7 = 0.95 ;
Parameters (R input):
par1 = 48 ; par2 = 1 ; par3 = 0 ; par4 = 0 ; par5 = 12 ; par6 = White Noise ; par7 = 0.95 ; par8 = ;
R code (references can be found in the software module):
if (par1 == 'Default') {
par1 = 10*log10(length(x))
} else {
par1 <- as.numeric(par1)
}
par2 <- as.numeric(par2)
par3 <- as.numeric(par3)
par4 <- as.numeric(par4)
par5 <- as.numeric(par5)
if (par6 == 'White Noise') par6 <- 'white' else par6 <- 'ma'
par7 <- as.numeric(par7)
if (par8 != '') par8 <- as.numeric(par8)
ox <- x
if (par8 == '') {
if (par2 == 0) {
x <- log(x)
} else {
x <- (x ^ par2 - 1) / par2
}
} else {
x <- log(x,base=par8)
}
if (par3 > 0) x <- diff(x,lag=1,difference=par3)
if (par4 > 0) x <- diff(x,lag=par5,difference=par4)
bitmap(file='picts.png')
op <- par(mfrow=c(2,1))
plot(ox,type='l',main='Original Time Series',xlab='time',ylab='value')
if (par8=='') {
mytitle <- paste('Working Time Series (lambda=',par2,', d=',par3,', D=',par4,')',sep='')
mysub <- paste('(lambda=',par2,', d=',par3,', D=',par4,', CI=', par7, ', CI type=',par6,')',sep='')
} else {
mytitle <- paste('Working Time Series (base=',par8,', d=',par3,', D=',par4,')',sep='')
mysub <- paste('(base=',par8,', d=',par3,', D=',par4,', CI=', par7, ', CI type=',par6,')',sep='')
}
plot(x,type='l', main=mytitle,xlab='time',ylab='value')
par(op)
dev.off()
bitmap(file='pic1.png')
racf <- acf(x, par1, main='Autocorrelation', xlab='time lag', ylab='ACF', ci.type=par6, ci=par7, sub=mysub)
dev.off()
bitmap(file='pic2.png')
rpacf <- pacf(x,par1,main='Partial Autocorrelation',xlab='lags',ylab='PACF',sub=mysub)
dev.off()
(myacf <- c(racf$acf))
(mypacf <- c(rpacf$acf))
lengthx <- length(x)
sqrtn <- sqrt(lengthx)
load(file='createtable')
a<-table.start()
a<-table.row.start(a)
a<-table.element(a,'Autocorrelation Function',4,TRUE)
a<-table.row.end(a)
a<-table.row.start(a)
a<-table.element(a,'Time lag k',header=TRUE)
a<-table.element(a,hyperlink('basics.htm','ACF(k)','click here for more information about the Autocorrelation Function'),header=TRUE)
a<-table.element(a,'T-STAT',header=TRUE)
a<-table.element(a,'P-value',header=TRUE)
a<-table.row.end(a)
for (i in 2:(par1+1)) {
a<-table.row.start(a)
a<-table.element(a,i-1,header=TRUE)
a<-table.element(a,round(myacf[i],6))
mytstat <- myacf[i]*sqrtn
a<-table.element(a,round(mytstat,4))
a<-table.element(a,round(1-pt(abs(mytstat),lengthx),6))
a<-table.row.end(a)
}
a<-table.end(a)
table.save(a,file='mytable.tab')
a<-table.start()
a<-table.row.start(a)
a<-table.element(a,'Partial Autocorrelation Function',4,TRUE)
a<-table.row.end(a)
a<-table.row.start(a)
a<-table.element(a,'Time lag k',header=TRUE)
a<-table.element(a,hyperlink('basics.htm','PACF(k)','click here for more information about the Partial Autocorrelation Function'),header=TRUE)
a<-table.element(a,'T-STAT',header=TRUE)
a<-table.element(a,'P-value',header=TRUE)
a<-table.row.end(a)
for (i in 1:par1) {
a<-table.row.start(a)
a<-table.element(a,i,header=TRUE)
a<-table.element(a,round(mypacf[i],6))
mytstat <- mypacf[i]*sqrtn
a<-table.element(a,round(mytstat,4))
a<-table.element(a,round(1-pt(abs(mytstat),lengthx),6))
a<-table.row.end(a)
}
a<-table.end(a)
table.save(a,file='mytable1.tab')