Free Statistics

of Irreproducible Research!

Author's title

Author*Unverified author*
R Software Modulerwasp_autocorrelation.wasp
Title produced by software(Partial) Autocorrelation Function
Date of computationFri, 14 Mar 2014 11:08:55 -0400
Cite this page as followsStatistical Computations at FreeStatistics.org, Office for Research Development and Education, URL https://freestatistics.org/blog/index.php?v=date/2014/Mar/14/t13948097679nxdlvv60qgg1fo.htm/, Retrieved Mon, 13 May 2024 20:42:24 +0000
Statistical Computations at FreeStatistics.org, Office for Research Development and Education, URL https://freestatistics.org/blog/index.php?pk=234248, Retrieved Mon, 13 May 2024 20:42:24 +0000
QR Codes:

Original text written by user:
IsPrivate?No (this computation is public)
User-defined keywords
Estimated Impact151
Family? (F = Feedback message, R = changed R code, M = changed R Module, P = changed Parameters, D = changed Data)
-     [Univariate Data Series] [] [2014-03-03 21:01:19] [967af62594a7ddaeafac2725d7422db7]
- RMP   [Mean Plot] [] [2014-03-03 21:11:19] [967af62594a7ddaeafac2725d7422db7]
- RMPD    [(Partial) Autocorrelation Function] [] [2014-03-14 13:57:34] [967af62594a7ddaeafac2725d7422db7]
- R P         [(Partial) Autocorrelation Function] [] [2014-03-14 15:08:55] [a051cf513b3103c0fd2487dcb9eab576] [Current]
-    D          [(Partial) Autocorrelation Function] [] [2014-03-14 17:20:55] [967af62594a7ddaeafac2725d7422db7]
Feedback Forum

Post a new message
Dataseries X:
1516
1289
1428
1335
1402
1475
1582
1317
1450
1497
1556
981
1807
1573
1756
1708
1737
1679
1872
1598
1747
1882
1369
865
1432
1172
1268
1120
1235
1272
1360
1069
1434
1552
1584
1070
1676
1690
1643
1446
1566
1352
1805
1613
1824
1866
1774
1505
1972
1856
2037
1888
2167
2191
2036
2103
2131
2039
1983
1629
2032
2216
2141
2073
2145
2429
2157
1994
2116
2287
2162
1699


Summary of computational transaction
Raw Inputview raw input (R code)
Raw Outputview raw output of R engine
Computing time3 seconds
R Server'Herman Ole Andreas Wold' @ wold.wessa.net

\begin{tabular}{lllllllll}
\hline
Summary of computational transaction \tabularnewline
Raw Input & view raw input (R code)  \tabularnewline
Raw Output & view raw output of R engine  \tabularnewline
Computing time & 3 seconds \tabularnewline
R Server & 'Herman Ole Andreas Wold' @ wold.wessa.net \tabularnewline
\hline
\end{tabular}
%Source: https://freestatistics.org/blog/index.php?pk=234248&T=0

[TABLE]
[ROW][C]Summary of computational transaction[/C][/ROW]
[ROW][C]Raw Input[/C][C]view raw input (R code) [/C][/ROW]
[ROW][C]Raw Output[/C][C]view raw output of R engine [/C][/ROW]
[ROW][C]Computing time[/C][C]3 seconds[/C][/ROW]
[ROW][C]R Server[/C][C]'Herman Ole Andreas Wold' @ wold.wessa.net[/C][/ROW]
[/TABLE]
Source: https://freestatistics.org/blog/index.php?pk=234248&T=0

Globally Unique Identifier (entire table): ba.freestatistics.org/blog/index.php?pk=234248&T=0

As an alternative you can also use a QR Code:  

The GUIDs for individual cells are displayed in the table below:

Summary of computational transaction
Raw Inputview raw input (R code)
Raw Outputview raw output of R engine
Computing time3 seconds
R Server'Herman Ole Andreas Wold' @ wold.wessa.net


Autocorrelation Function
Time lag kACF(k)T-STATP-value
1-0.440345-3.71040.000204
20.0020690.01740.493069
3-0.14382-1.21190.114793
40.357043.00850.001816
5-0.261559-2.20390.015386
60.1707961.43920.077251
7-0.321337-2.70760.004242
80.370023.11780.001315
9-0.16133-1.35940.089162
100.0308510.260.397825
11-0.390193-3.28780.000786
120.5737434.83444e-06
13-0.242895-2.04670.022197
14-0.022337-0.18820.425622
15-0.136514-1.15030.126942
160.3395312.86090.002772
17-0.266033-2.24160.014056
180.1574061.32630.094491
19-0.16607-1.39930.083033
200.2003591.68830.047875
21-0.124434-1.04850.148982
220.0611250.5150.304059
23-0.290375-2.44670.008447
240.4468423.76520.00017
25-0.212214-1.78810.039009
26-0.037547-0.31640.376321
27-0.095156-0.80180.212672
280.2548062.1470.017604
29-0.209605-1.76620.040834
300.0525670.44290.329579
31-0.105794-0.89140.187852
320.2154011.8150.036874
33-0.109872-0.92580.178844
340.0297780.25090.401304
35-0.185962-1.56690.060787
360.2862232.41180.009232
37-0.093616-0.78880.21642
38-0.031781-0.26780.394819
39-0.11073-0.9330.176984
400.1848341.55740.061907
41-0.081854-0.68970.246311
42-0.060749-0.51190.305162
43-0.017729-0.14940.440835
440.0980420.82610.205753
45-0.043827-0.36930.356504
460.0156430.13180.447754
47-0.115092-0.96980.167724
480.1717211.44690.076157

\begin{tabular}{lllllllll}
\hline
Autocorrelation Function \tabularnewline
Time lag k & ACF(k) & T-STAT & P-value \tabularnewline
1 & -0.440345 & -3.7104 & 0.000204 \tabularnewline
2 & 0.002069 & 0.0174 & 0.493069 \tabularnewline
3 & -0.14382 & -1.2119 & 0.114793 \tabularnewline
4 & 0.35704 & 3.0085 & 0.001816 \tabularnewline
5 & -0.261559 & -2.2039 & 0.015386 \tabularnewline
6 & 0.170796 & 1.4392 & 0.077251 \tabularnewline
7 & -0.321337 & -2.7076 & 0.004242 \tabularnewline
8 & 0.37002 & 3.1178 & 0.001315 \tabularnewline
9 & -0.16133 & -1.3594 & 0.089162 \tabularnewline
10 & 0.030851 & 0.26 & 0.397825 \tabularnewline
11 & -0.390193 & -3.2878 & 0.000786 \tabularnewline
12 & 0.573743 & 4.8344 & 4e-06 \tabularnewline
13 & -0.242895 & -2.0467 & 0.022197 \tabularnewline
14 & -0.022337 & -0.1882 & 0.425622 \tabularnewline
15 & -0.136514 & -1.1503 & 0.126942 \tabularnewline
16 & 0.339531 & 2.8609 & 0.002772 \tabularnewline
17 & -0.266033 & -2.2416 & 0.014056 \tabularnewline
18 & 0.157406 & 1.3263 & 0.094491 \tabularnewline
19 & -0.16607 & -1.3993 & 0.083033 \tabularnewline
20 & 0.200359 & 1.6883 & 0.047875 \tabularnewline
21 & -0.124434 & -1.0485 & 0.148982 \tabularnewline
22 & 0.061125 & 0.515 & 0.304059 \tabularnewline
23 & -0.290375 & -2.4467 & 0.008447 \tabularnewline
24 & 0.446842 & 3.7652 & 0.00017 \tabularnewline
25 & -0.212214 & -1.7881 & 0.039009 \tabularnewline
26 & -0.037547 & -0.3164 & 0.376321 \tabularnewline
27 & -0.095156 & -0.8018 & 0.212672 \tabularnewline
28 & 0.254806 & 2.147 & 0.017604 \tabularnewline
29 & -0.209605 & -1.7662 & 0.040834 \tabularnewline
30 & 0.052567 & 0.4429 & 0.329579 \tabularnewline
31 & -0.105794 & -0.8914 & 0.187852 \tabularnewline
32 & 0.215401 & 1.815 & 0.036874 \tabularnewline
33 & -0.109872 & -0.9258 & 0.178844 \tabularnewline
34 & 0.029778 & 0.2509 & 0.401304 \tabularnewline
35 & -0.185962 & -1.5669 & 0.060787 \tabularnewline
36 & 0.286223 & 2.4118 & 0.009232 \tabularnewline
37 & -0.093616 & -0.7888 & 0.21642 \tabularnewline
38 & -0.031781 & -0.2678 & 0.394819 \tabularnewline
39 & -0.11073 & -0.933 & 0.176984 \tabularnewline
40 & 0.184834 & 1.5574 & 0.061907 \tabularnewline
41 & -0.081854 & -0.6897 & 0.246311 \tabularnewline
42 & -0.060749 & -0.5119 & 0.305162 \tabularnewline
43 & -0.017729 & -0.1494 & 0.440835 \tabularnewline
44 & 0.098042 & 0.8261 & 0.205753 \tabularnewline
45 & -0.043827 & -0.3693 & 0.356504 \tabularnewline
46 & 0.015643 & 0.1318 & 0.447754 \tabularnewline
47 & -0.115092 & -0.9698 & 0.167724 \tabularnewline
48 & 0.171721 & 1.4469 & 0.076157 \tabularnewline
\hline
\end{tabular}
%Source: https://freestatistics.org/blog/index.php?pk=234248&T=1

[TABLE]
[ROW][C]Autocorrelation Function[/C][/ROW]
[ROW][C]Time lag k[/C][C]ACF(k)[/C][C]T-STAT[/C][C]P-value[/C][/ROW]
[ROW][C]1[/C][C]-0.440345[/C][C]-3.7104[/C][C]0.000204[/C][/ROW]
[ROW][C]2[/C][C]0.002069[/C][C]0.0174[/C][C]0.493069[/C][/ROW]
[ROW][C]3[/C][C]-0.14382[/C][C]-1.2119[/C][C]0.114793[/C][/ROW]
[ROW][C]4[/C][C]0.35704[/C][C]3.0085[/C][C]0.001816[/C][/ROW]
[ROW][C]5[/C][C]-0.261559[/C][C]-2.2039[/C][C]0.015386[/C][/ROW]
[ROW][C]6[/C][C]0.170796[/C][C]1.4392[/C][C]0.077251[/C][/ROW]
[ROW][C]7[/C][C]-0.321337[/C][C]-2.7076[/C][C]0.004242[/C][/ROW]
[ROW][C]8[/C][C]0.37002[/C][C]3.1178[/C][C]0.001315[/C][/ROW]
[ROW][C]9[/C][C]-0.16133[/C][C]-1.3594[/C][C]0.089162[/C][/ROW]
[ROW][C]10[/C][C]0.030851[/C][C]0.26[/C][C]0.397825[/C][/ROW]
[ROW][C]11[/C][C]-0.390193[/C][C]-3.2878[/C][C]0.000786[/C][/ROW]
[ROW][C]12[/C][C]0.573743[/C][C]4.8344[/C][C]4e-06[/C][/ROW]
[ROW][C]13[/C][C]-0.242895[/C][C]-2.0467[/C][C]0.022197[/C][/ROW]
[ROW][C]14[/C][C]-0.022337[/C][C]-0.1882[/C][C]0.425622[/C][/ROW]
[ROW][C]15[/C][C]-0.136514[/C][C]-1.1503[/C][C]0.126942[/C][/ROW]
[ROW][C]16[/C][C]0.339531[/C][C]2.8609[/C][C]0.002772[/C][/ROW]
[ROW][C]17[/C][C]-0.266033[/C][C]-2.2416[/C][C]0.014056[/C][/ROW]
[ROW][C]18[/C][C]0.157406[/C][C]1.3263[/C][C]0.094491[/C][/ROW]
[ROW][C]19[/C][C]-0.16607[/C][C]-1.3993[/C][C]0.083033[/C][/ROW]
[ROW][C]20[/C][C]0.200359[/C][C]1.6883[/C][C]0.047875[/C][/ROW]
[ROW][C]21[/C][C]-0.124434[/C][C]-1.0485[/C][C]0.148982[/C][/ROW]
[ROW][C]22[/C][C]0.061125[/C][C]0.515[/C][C]0.304059[/C][/ROW]
[ROW][C]23[/C][C]-0.290375[/C][C]-2.4467[/C][C]0.008447[/C][/ROW]
[ROW][C]24[/C][C]0.446842[/C][C]3.7652[/C][C]0.00017[/C][/ROW]
[ROW][C]25[/C][C]-0.212214[/C][C]-1.7881[/C][C]0.039009[/C][/ROW]
[ROW][C]26[/C][C]-0.037547[/C][C]-0.3164[/C][C]0.376321[/C][/ROW]
[ROW][C]27[/C][C]-0.095156[/C][C]-0.8018[/C][C]0.212672[/C][/ROW]
[ROW][C]28[/C][C]0.254806[/C][C]2.147[/C][C]0.017604[/C][/ROW]
[ROW][C]29[/C][C]-0.209605[/C][C]-1.7662[/C][C]0.040834[/C][/ROW]
[ROW][C]30[/C][C]0.052567[/C][C]0.4429[/C][C]0.329579[/C][/ROW]
[ROW][C]31[/C][C]-0.105794[/C][C]-0.8914[/C][C]0.187852[/C][/ROW]
[ROW][C]32[/C][C]0.215401[/C][C]1.815[/C][C]0.036874[/C][/ROW]
[ROW][C]33[/C][C]-0.109872[/C][C]-0.9258[/C][C]0.178844[/C][/ROW]
[ROW][C]34[/C][C]0.029778[/C][C]0.2509[/C][C]0.401304[/C][/ROW]
[ROW][C]35[/C][C]-0.185962[/C][C]-1.5669[/C][C]0.060787[/C][/ROW]
[ROW][C]36[/C][C]0.286223[/C][C]2.4118[/C][C]0.009232[/C][/ROW]
[ROW][C]37[/C][C]-0.093616[/C][C]-0.7888[/C][C]0.21642[/C][/ROW]
[ROW][C]38[/C][C]-0.031781[/C][C]-0.2678[/C][C]0.394819[/C][/ROW]
[ROW][C]39[/C][C]-0.11073[/C][C]-0.933[/C][C]0.176984[/C][/ROW]
[ROW][C]40[/C][C]0.184834[/C][C]1.5574[/C][C]0.061907[/C][/ROW]
[ROW][C]41[/C][C]-0.081854[/C][C]-0.6897[/C][C]0.246311[/C][/ROW]
[ROW][C]42[/C][C]-0.060749[/C][C]-0.5119[/C][C]0.305162[/C][/ROW]
[ROW][C]43[/C][C]-0.017729[/C][C]-0.1494[/C][C]0.440835[/C][/ROW]
[ROW][C]44[/C][C]0.098042[/C][C]0.8261[/C][C]0.205753[/C][/ROW]
[ROW][C]45[/C][C]-0.043827[/C][C]-0.3693[/C][C]0.356504[/C][/ROW]
[ROW][C]46[/C][C]0.015643[/C][C]0.1318[/C][C]0.447754[/C][/ROW]
[ROW][C]47[/C][C]-0.115092[/C][C]-0.9698[/C][C]0.167724[/C][/ROW]
[ROW][C]48[/C][C]0.171721[/C][C]1.4469[/C][C]0.076157[/C][/ROW]
[/TABLE]
Source: https://freestatistics.org/blog/index.php?pk=234248&T=1

Globally Unique Identifier (entire table): ba.freestatistics.org/blog/index.php?pk=234248&T=1

As an alternative you can also use a QR Code:  

The GUIDs for individual cells are displayed in the table below:

Autocorrelation Function
Time lag kACF(k)T-STATP-value
1-0.440345-3.71040.000204
20.0020690.01740.493069
3-0.14382-1.21190.114793
40.357043.00850.001816
5-0.261559-2.20390.015386
60.1707961.43920.077251
7-0.321337-2.70760.004242
80.370023.11780.001315
9-0.16133-1.35940.089162
100.0308510.260.397825
11-0.390193-3.28780.000786
120.5737434.83444e-06
13-0.242895-2.04670.022197
14-0.022337-0.18820.425622
15-0.136514-1.15030.126942
160.3395312.86090.002772
17-0.266033-2.24160.014056
180.1574061.32630.094491
19-0.16607-1.39930.083033
200.2003591.68830.047875
21-0.124434-1.04850.148982
220.0611250.5150.304059
23-0.290375-2.44670.008447
240.4468423.76520.00017
25-0.212214-1.78810.039009
26-0.037547-0.31640.376321
27-0.095156-0.80180.212672
280.2548062.1470.017604
29-0.209605-1.76620.040834
300.0525670.44290.329579
31-0.105794-0.89140.187852
320.2154011.8150.036874
33-0.109872-0.92580.178844
340.0297780.25090.401304
35-0.185962-1.56690.060787
360.2862232.41180.009232
37-0.093616-0.78880.21642
38-0.031781-0.26780.394819
39-0.11073-0.9330.176984
400.1848341.55740.061907
41-0.081854-0.68970.246311
42-0.060749-0.51190.305162
43-0.017729-0.14940.440835
440.0980420.82610.205753
45-0.043827-0.36930.356504
460.0156430.13180.447754
47-0.115092-0.96980.167724
480.1717211.44690.076157


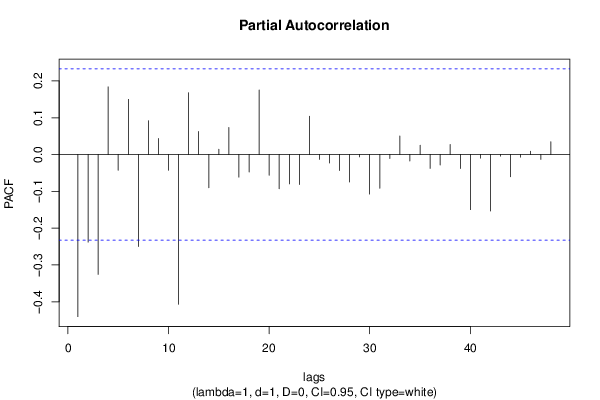
Partial Autocorrelation Function
Time lag kPACF(k)T-STATP-value
1-0.440345-3.71040.000204
2-0.23798-2.00530.024374
3-0.325449-2.74230.003858
40.1839221.54980.062823
5-0.042579-0.35880.360414
60.1500731.26450.105086
7-0.249697-2.1040.019461
80.0918360.77380.220803
90.0438440.36940.356452
10-0.042723-0.360.359961
11-0.406633-3.42630.00051
120.1681131.41650.080494
130.0628990.530.298883
14-0.090194-0.760.22489
150.0147220.12410.450813
160.0734450.61890.268994
17-0.061298-0.51650.303554
18-0.047173-0.39750.3461
190.1752581.47670.072083
20-0.056074-0.47250.319015
21-0.092676-0.78090.218728
22-0.079665-0.67130.252114
23-0.081408-0.6860.247487
240.1040650.87690.191759
25-0.013005-0.10960.456524
26-0.023054-0.19430.423264
27-0.043179-0.36380.358533
28-0.074718-0.62960.265493
29-0.006328-0.05330.478812
30-0.107412-0.90510.184245
31-0.091635-0.77210.2213
32-0.01062-0.08950.464473
330.0504990.42550.335875
34-0.017713-0.14930.44089
350.0255120.2150.415204
36-0.037591-0.31670.376183
37-0.02847-0.23990.405553
380.027210.22930.409658
39-0.037899-0.31930.375203
40-0.149699-1.26140.105648
41-0.009623-0.08110.4678
42-0.153511-1.29350.100015
43-0.004239-0.03570.485803
44-0.060228-0.50750.306691
45-0.00691-0.05820.476867
460.0090990.07670.469552
47-0.013182-0.11110.455935
480.0346650.29210.385533

\begin{tabular}{lllllllll}
\hline
Partial Autocorrelation Function \tabularnewline
Time lag k & PACF(k) & T-STAT & P-value \tabularnewline
1 & -0.440345 & -3.7104 & 0.000204 \tabularnewline
2 & -0.23798 & -2.0053 & 0.024374 \tabularnewline
3 & -0.325449 & -2.7423 & 0.003858 \tabularnewline
4 & 0.183922 & 1.5498 & 0.062823 \tabularnewline
5 & -0.042579 & -0.3588 & 0.360414 \tabularnewline
6 & 0.150073 & 1.2645 & 0.105086 \tabularnewline
7 & -0.249697 & -2.104 & 0.019461 \tabularnewline
8 & 0.091836 & 0.7738 & 0.220803 \tabularnewline
9 & 0.043844 & 0.3694 & 0.356452 \tabularnewline
10 & -0.042723 & -0.36 & 0.359961 \tabularnewline
11 & -0.406633 & -3.4263 & 0.00051 \tabularnewline
12 & 0.168113 & 1.4165 & 0.080494 \tabularnewline
13 & 0.062899 & 0.53 & 0.298883 \tabularnewline
14 & -0.090194 & -0.76 & 0.22489 \tabularnewline
15 & 0.014722 & 0.1241 & 0.450813 \tabularnewline
16 & 0.073445 & 0.6189 & 0.268994 \tabularnewline
17 & -0.061298 & -0.5165 & 0.303554 \tabularnewline
18 & -0.047173 & -0.3975 & 0.3461 \tabularnewline
19 & 0.175258 & 1.4767 & 0.072083 \tabularnewline
20 & -0.056074 & -0.4725 & 0.319015 \tabularnewline
21 & -0.092676 & -0.7809 & 0.218728 \tabularnewline
22 & -0.079665 & -0.6713 & 0.252114 \tabularnewline
23 & -0.081408 & -0.686 & 0.247487 \tabularnewline
24 & 0.104065 & 0.8769 & 0.191759 \tabularnewline
25 & -0.013005 & -0.1096 & 0.456524 \tabularnewline
26 & -0.023054 & -0.1943 & 0.423264 \tabularnewline
27 & -0.043179 & -0.3638 & 0.358533 \tabularnewline
28 & -0.074718 & -0.6296 & 0.265493 \tabularnewline
29 & -0.006328 & -0.0533 & 0.478812 \tabularnewline
30 & -0.107412 & -0.9051 & 0.184245 \tabularnewline
31 & -0.091635 & -0.7721 & 0.2213 \tabularnewline
32 & -0.01062 & -0.0895 & 0.464473 \tabularnewline
33 & 0.050499 & 0.4255 & 0.335875 \tabularnewline
34 & -0.017713 & -0.1493 & 0.44089 \tabularnewline
35 & 0.025512 & 0.215 & 0.415204 \tabularnewline
36 & -0.037591 & -0.3167 & 0.376183 \tabularnewline
37 & -0.02847 & -0.2399 & 0.405553 \tabularnewline
38 & 0.02721 & 0.2293 & 0.409658 \tabularnewline
39 & -0.037899 & -0.3193 & 0.375203 \tabularnewline
40 & -0.149699 & -1.2614 & 0.105648 \tabularnewline
41 & -0.009623 & -0.0811 & 0.4678 \tabularnewline
42 & -0.153511 & -1.2935 & 0.100015 \tabularnewline
43 & -0.004239 & -0.0357 & 0.485803 \tabularnewline
44 & -0.060228 & -0.5075 & 0.306691 \tabularnewline
45 & -0.00691 & -0.0582 & 0.476867 \tabularnewline
46 & 0.009099 & 0.0767 & 0.469552 \tabularnewline
47 & -0.013182 & -0.1111 & 0.455935 \tabularnewline
48 & 0.034665 & 0.2921 & 0.385533 \tabularnewline
\hline
\end{tabular}
%Source: https://freestatistics.org/blog/index.php?pk=234248&T=2

[TABLE]
[ROW][C]Partial Autocorrelation Function[/C][/ROW]
[ROW][C]Time lag k[/C][C]PACF(k)[/C][C]T-STAT[/C][C]P-value[/C][/ROW]
[ROW][C]1[/C][C]-0.440345[/C][C]-3.7104[/C][C]0.000204[/C][/ROW]
[ROW][C]2[/C][C]-0.23798[/C][C]-2.0053[/C][C]0.024374[/C][/ROW]
[ROW][C]3[/C][C]-0.325449[/C][C]-2.7423[/C][C]0.003858[/C][/ROW]
[ROW][C]4[/C][C]0.183922[/C][C]1.5498[/C][C]0.062823[/C][/ROW]
[ROW][C]5[/C][C]-0.042579[/C][C]-0.3588[/C][C]0.360414[/C][/ROW]
[ROW][C]6[/C][C]0.150073[/C][C]1.2645[/C][C]0.105086[/C][/ROW]
[ROW][C]7[/C][C]-0.249697[/C][C]-2.104[/C][C]0.019461[/C][/ROW]
[ROW][C]8[/C][C]0.091836[/C][C]0.7738[/C][C]0.220803[/C][/ROW]
[ROW][C]9[/C][C]0.043844[/C][C]0.3694[/C][C]0.356452[/C][/ROW]
[ROW][C]10[/C][C]-0.042723[/C][C]-0.36[/C][C]0.359961[/C][/ROW]
[ROW][C]11[/C][C]-0.406633[/C][C]-3.4263[/C][C]0.00051[/C][/ROW]
[ROW][C]12[/C][C]0.168113[/C][C]1.4165[/C][C]0.080494[/C][/ROW]
[ROW][C]13[/C][C]0.062899[/C][C]0.53[/C][C]0.298883[/C][/ROW]
[ROW][C]14[/C][C]-0.090194[/C][C]-0.76[/C][C]0.22489[/C][/ROW]
[ROW][C]15[/C][C]0.014722[/C][C]0.1241[/C][C]0.450813[/C][/ROW]
[ROW][C]16[/C][C]0.073445[/C][C]0.6189[/C][C]0.268994[/C][/ROW]
[ROW][C]17[/C][C]-0.061298[/C][C]-0.5165[/C][C]0.303554[/C][/ROW]
[ROW][C]18[/C][C]-0.047173[/C][C]-0.3975[/C][C]0.3461[/C][/ROW]
[ROW][C]19[/C][C]0.175258[/C][C]1.4767[/C][C]0.072083[/C][/ROW]
[ROW][C]20[/C][C]-0.056074[/C][C]-0.4725[/C][C]0.319015[/C][/ROW]
[ROW][C]21[/C][C]-0.092676[/C][C]-0.7809[/C][C]0.218728[/C][/ROW]
[ROW][C]22[/C][C]-0.079665[/C][C]-0.6713[/C][C]0.252114[/C][/ROW]
[ROW][C]23[/C][C]-0.081408[/C][C]-0.686[/C][C]0.247487[/C][/ROW]
[ROW][C]24[/C][C]0.104065[/C][C]0.8769[/C][C]0.191759[/C][/ROW]
[ROW][C]25[/C][C]-0.013005[/C][C]-0.1096[/C][C]0.456524[/C][/ROW]
[ROW][C]26[/C][C]-0.023054[/C][C]-0.1943[/C][C]0.423264[/C][/ROW]
[ROW][C]27[/C][C]-0.043179[/C][C]-0.3638[/C][C]0.358533[/C][/ROW]
[ROW][C]28[/C][C]-0.074718[/C][C]-0.6296[/C][C]0.265493[/C][/ROW]
[ROW][C]29[/C][C]-0.006328[/C][C]-0.0533[/C][C]0.478812[/C][/ROW]
[ROW][C]30[/C][C]-0.107412[/C][C]-0.9051[/C][C]0.184245[/C][/ROW]
[ROW][C]31[/C][C]-0.091635[/C][C]-0.7721[/C][C]0.2213[/C][/ROW]
[ROW][C]32[/C][C]-0.01062[/C][C]-0.0895[/C][C]0.464473[/C][/ROW]
[ROW][C]33[/C][C]0.050499[/C][C]0.4255[/C][C]0.335875[/C][/ROW]
[ROW][C]34[/C][C]-0.017713[/C][C]-0.1493[/C][C]0.44089[/C][/ROW]
[ROW][C]35[/C][C]0.025512[/C][C]0.215[/C][C]0.415204[/C][/ROW]
[ROW][C]36[/C][C]-0.037591[/C][C]-0.3167[/C][C]0.376183[/C][/ROW]
[ROW][C]37[/C][C]-0.02847[/C][C]-0.2399[/C][C]0.405553[/C][/ROW]
[ROW][C]38[/C][C]0.02721[/C][C]0.2293[/C][C]0.409658[/C][/ROW]
[ROW][C]39[/C][C]-0.037899[/C][C]-0.3193[/C][C]0.375203[/C][/ROW]
[ROW][C]40[/C][C]-0.149699[/C][C]-1.2614[/C][C]0.105648[/C][/ROW]
[ROW][C]41[/C][C]-0.009623[/C][C]-0.0811[/C][C]0.4678[/C][/ROW]
[ROW][C]42[/C][C]-0.153511[/C][C]-1.2935[/C][C]0.100015[/C][/ROW]
[ROW][C]43[/C][C]-0.004239[/C][C]-0.0357[/C][C]0.485803[/C][/ROW]
[ROW][C]44[/C][C]-0.060228[/C][C]-0.5075[/C][C]0.306691[/C][/ROW]
[ROW][C]45[/C][C]-0.00691[/C][C]-0.0582[/C][C]0.476867[/C][/ROW]
[ROW][C]46[/C][C]0.009099[/C][C]0.0767[/C][C]0.469552[/C][/ROW]
[ROW][C]47[/C][C]-0.013182[/C][C]-0.1111[/C][C]0.455935[/C][/ROW]
[ROW][C]48[/C][C]0.034665[/C][C]0.2921[/C][C]0.385533[/C][/ROW]
[/TABLE]
Source: https://freestatistics.org/blog/index.php?pk=234248&T=2

Globally Unique Identifier (entire table): ba.freestatistics.org/blog/index.php?pk=234248&T=2

As an alternative you can also use a QR Code:  

The GUIDs for individual cells are displayed in the table below:

Partial Autocorrelation Function
Time lag kPACF(k)T-STATP-value
1-0.440345-3.71040.000204
2-0.23798-2.00530.024374
3-0.325449-2.74230.003858
40.1839221.54980.062823
5-0.042579-0.35880.360414
60.1500731.26450.105086
7-0.249697-2.1040.019461
80.0918360.77380.220803
90.0438440.36940.356452
10-0.042723-0.360.359961
11-0.406633-3.42630.00051
120.1681131.41650.080494
130.0628990.530.298883
14-0.090194-0.760.22489
150.0147220.12410.450813
160.0734450.61890.268994
17-0.061298-0.51650.303554
18-0.047173-0.39750.3461
190.1752581.47670.072083
20-0.056074-0.47250.319015
21-0.092676-0.78090.218728
22-0.079665-0.67130.252114
23-0.081408-0.6860.247487
240.1040650.87690.191759
25-0.013005-0.10960.456524
26-0.023054-0.19430.423264
27-0.043179-0.36380.358533
28-0.074718-0.62960.265493
29-0.006328-0.05330.478812
30-0.107412-0.90510.184245
31-0.091635-0.77210.2213
32-0.01062-0.08950.464473
330.0504990.42550.335875
34-0.017713-0.14930.44089
350.0255120.2150.415204
36-0.037591-0.31670.376183
37-0.02847-0.23990.405553
380.027210.22930.409658
39-0.037899-0.31930.375203
40-0.149699-1.26140.105648
41-0.009623-0.08110.4678
42-0.153511-1.29350.100015
43-0.004239-0.03570.485803
44-0.060228-0.50750.306691
45-0.00691-0.05820.476867
460.0090990.07670.469552
47-0.013182-0.11110.455935
480.0346650.29210.385533


Parameters (Session):
par1 = 48 ; par2 = 1 ; par3 = 1 ; par4 = 0 ; par5 = 12 ; par6 = White Noise ; par7 = 0.95 ;
Parameters (R input):
par1 = 48 ; par2 = 1 ; par3 = 1 ; par4 = 0 ; par5 = 12 ; par6 = White Noise ; par7 = 0.95 ; par8 = ;
R code (references can be found in the software module):
if (par1 == 'Default') {
par1 = 10*log10(length(x))
} else {
par1 <- as.numeric(par1)
}
par2 <- as.numeric(par2)
par3 <- as.numeric(par3)
par4 <- as.numeric(par4)
par5 <- as.numeric(par5)
if (par6 == 'White Noise') par6 <- 'white' else par6 <- 'ma'
par7 <- as.numeric(par7)
if (par8 != '') par8 <- as.numeric(par8)
ox <- x
if (par8 == '') {
if (par2 == 0) {
x <- log(x)
} else {
x <- (x ^ par2 - 1) / par2
}
} else {
x <- log(x,base=par8)
}
if (par3 > 0) x <- diff(x,lag=1,difference=par3)
if (par4 > 0) x <- diff(x,lag=par5,difference=par4)
bitmap(file='picts.png')
op <- par(mfrow=c(2,1))
plot(ox,type='l',main='Original Time Series',xlab='time',ylab='value')
if (par8=='') {
mytitle <- paste('Working Time Series (lambda=',par2,', d=',par3,', D=',par4,')',sep='')
mysub <- paste('(lambda=',par2,', d=',par3,', D=',par4,', CI=', par7, ', CI type=',par6,')',sep='')
} else {
mytitle <- paste('Working Time Series (base=',par8,', d=',par3,', D=',par4,')',sep='')
mysub <- paste('(base=',par8,', d=',par3,', D=',par4,', CI=', par7, ', CI type=',par6,')',sep='')
}
plot(x,type='l', main=mytitle,xlab='time',ylab='value')
par(op)
dev.off()
bitmap(file='pic1.png')
racf <- acf(x, par1, main='Autocorrelation', xlab='time lag', ylab='ACF', ci.type=par6, ci=par7, sub=mysub)
dev.off()
bitmap(file='pic2.png')
rpacf <- pacf(x,par1,main='Partial Autocorrelation',xlab='lags',ylab='PACF',sub=mysub)
dev.off()
(myacf <- c(racf$acf))
(mypacf <- c(rpacf$acf))
lengthx <- length(x)
sqrtn <- sqrt(lengthx)
load(file='createtable')
a<-table.start()
a<-table.row.start(a)
a<-table.element(a,'Autocorrelation Function',4,TRUE)
a<-table.row.end(a)
a<-table.row.start(a)
a<-table.element(a,'Time lag k',header=TRUE)
a<-table.element(a,hyperlink('basics.htm','ACF(k)','click here for more information about the Autocorrelation Function'),header=TRUE)
a<-table.element(a,'T-STAT',header=TRUE)
a<-table.element(a,'P-value',header=TRUE)
a<-table.row.end(a)
for (i in 2:(par1+1)) {
a<-table.row.start(a)
a<-table.element(a,i-1,header=TRUE)
a<-table.element(a,round(myacf[i],6))
mytstat <- myacf[i]*sqrtn
a<-table.element(a,round(mytstat,4))
a<-table.element(a,round(1-pt(abs(mytstat),lengthx),6))
a<-table.row.end(a)
}
a<-table.end(a)
table.save(a,file='mytable.tab')
a<-table.start()
a<-table.row.start(a)
a<-table.element(a,'Partial Autocorrelation Function',4,TRUE)
a<-table.row.end(a)
a<-table.row.start(a)
a<-table.element(a,'Time lag k',header=TRUE)
a<-table.element(a,hyperlink('basics.htm','PACF(k)','click here for more information about the Partial Autocorrelation Function'),header=TRUE)
a<-table.element(a,'T-STAT',header=TRUE)
a<-table.element(a,'P-value',header=TRUE)
a<-table.row.end(a)
for (i in 1:par1) {
a<-table.row.start(a)
a<-table.element(a,i,header=TRUE)
a<-table.element(a,round(mypacf[i],6))
mytstat <- mypacf[i]*sqrtn
a<-table.element(a,round(mytstat,4))
a<-table.element(a,round(1-pt(abs(mytstat),lengthx),6))
a<-table.row.end(a)
}
a<-table.end(a)
table.save(a,file='mytable1.tab')