Free Statistics

of Irreproducible Research!

Author's title

Author*Unverified author*
R Software Modulerwasp_autocorrelation.wasp
Title produced by software(Partial) Autocorrelation Function
Date of computationSun, 16 Mar 2014 06:41:03 -0400
Cite this page as followsStatistical Computations at FreeStatistics.org, Office for Research Development and Education, URL https://freestatistics.org/blog/index.php?v=date/2014/Mar/16/t1394966496c9zldi4keflmyiq.htm/, Retrieved Tue, 14 May 2024 00:11:28 +0000
Statistical Computations at FreeStatistics.org, Office for Research Development and Education, URL https://freestatistics.org/blog/index.php?pk=234265, Retrieved Tue, 14 May 2024 00:11:28 +0000
QR Codes:

Original text written by user:
IsPrivate?No (this computation is public)
User-defined keywords
Estimated Impact193
Family? (F = Feedback message, R = changed R code, M = changed R Module, P = changed Parameters, D = changed Data)
-       [(Partial) Autocorrelation Function] [] [2014-03-16 10:41:03] [7924821bfd3c647737470140bc76edc8] [Current]
Feedback Forum

Post a new message
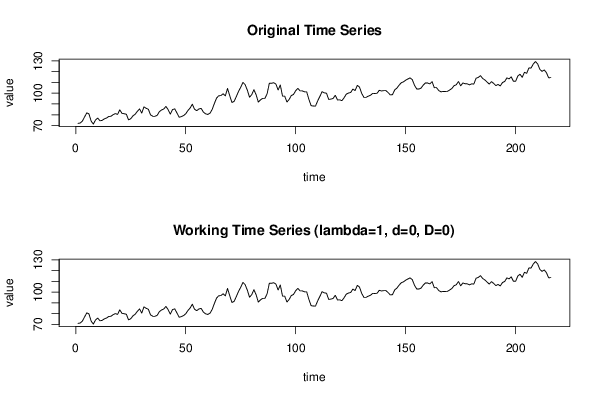
Dataseries X:
71.97
72.32
74.07
77.95
81.75
80.81
74.1
71.37
75.21
76.9
74.44
74.76
76.23
76.97
78.4
78.6
80.08
81.12
80.31
84.59
81.34
80.95
80.48
75.26
76.32
78.92
80.47
83.14
85.42
81.53
87.31
86.01
85.1
79.91
78.6
78.6
79.37
82.89
84.43
85.32
87.71
84.68
80.62
84.79
85.49
81.68
77.69
78.31
79.18
80.91
83.91
86.3
89.76
85.11
83.81
85.36
85.89
82.59
80.87
80.27
81.36
84.81
90.3
95.43
97.59
97.8
99.48
97.52
104.39
97.74
91.37
92.42
96.9
101.58
105.46
110.06
107.9
102.87
96.28
98.59
103.22
98.6
91.79
93.83
95.17
95.19
99.44
109.18
109.15
109.72
108.41
102.96
107.64
97.28
97.25
91.84
94.12
97.86
98.83
102.29
104.49
102.11
102.14
101.28
101.21
94.2
88.47
88.08
88.02
92.95
97.05
101.44
100.34
99.98
94.17
94.54
95.12
98.04
93.72
93.83
93.03
95.81
99.1
100.12
100.67
103.87
102.39
107.21
105.71
99.79
96.12
96.17
97.23
98.08
99.84
99.72
99.92
102.7
102.06
102.36
102.43
100.6
98.4
98.61
103.03
104.7
107.45
109.67
110.54
112.05
113.19
114.2
112.56
107.36
103.93
103.83
104.74
107.5
109.53
109.42
108.6
110.72
105.1
105.19
102.55
101.25
101.56
101.62
101.7
102.94
104.37
106.93
107.82
110.83
106.86
109.46
108.8
108.69
107.77
108.64
108.5
113.84
114.59
116.27
113.63
112.29
110.31
108.47
110.67
109.1
107.02
108.12
106.69
109.87
110.82
114.14
113.31
115.16
111.06
111.13
115.96
117.57
114.69
119.42
118.4
123.32
123.39
127.04
129.35
127.12
122.1
120.22
121.53
119.01
114.27
114.46


Summary of computational transaction
Raw Inputview raw input (R code)
Raw Outputview raw output of R engine
Computing time3 seconds
R Server'Gertrude Mary Cox' @ cox.wessa.net

\begin{tabular}{lllllllll}
\hline
Summary of computational transaction \tabularnewline
Raw Input & view raw input (R code)  \tabularnewline
Raw Output & view raw output of R engine  \tabularnewline
Computing time & 3 seconds \tabularnewline
R Server & 'Gertrude Mary Cox' @ cox.wessa.net \tabularnewline
\hline
\end{tabular}
%Source: https://freestatistics.org/blog/index.php?pk=234265&T=0

[TABLE]
[ROW][C]Summary of computational transaction[/C][/ROW]
[ROW][C]Raw Input[/C][C]view raw input (R code) [/C][/ROW]
[ROW][C]Raw Output[/C][C]view raw output of R engine [/C][/ROW]
[ROW][C]Computing time[/C][C]3 seconds[/C][/ROW]
[ROW][C]R Server[/C][C]'Gertrude Mary Cox' @ cox.wessa.net[/C][/ROW]
[/TABLE]
Source: https://freestatistics.org/blog/index.php?pk=234265&T=0

Globally Unique Identifier (entire table): ba.freestatistics.org/blog/index.php?pk=234265&T=0

As an alternative you can also use a QR Code:  

The GUIDs for individual cells are displayed in the table below:

Summary of computational transaction
Raw Inputview raw input (R code)
Raw Outputview raw output of R engine
Computing time3 seconds
R Server'Gertrude Mary Cox' @ cox.wessa.net


Autocorrelation Function
Time lag kACF(k)T-STATP-value
10.95987214.10720
20.912813.41540
30.86439512.7040
40.82549612.13230
50.79582611.69620
60.77300511.36080
70.75173211.04820
80.73455510.79570
90.72402510.64090
100.72287710.62410
110.71978610.57870
120.71081910.44690
130.6790389.97980
140.6390589.39220
150.6008688.83090
160.5672938.33750
170.5427917.97740
180.5258077.72770
190.5171527.60060
200.5209467.65630
210.5300967.79080
220.5435377.98830
230.5547968.15380
240.5526848.12280
250.52737.74970
260.4921797.23350
270.4583526.73640
280.4313596.33970
290.4079535.99570
300.3887435.71330
310.3802725.58880
320.3776995.5510
330.3793025.57460
340.3829455.62810
350.3855395.66620
360.3796155.57920
370.3523765.17880
380.3194844.69542e-06
390.2860034.20341.9e-05
400.2605613.82958.4e-05
410.2397393.52340.00026
420.2285473.35890.000462
430.2217443.2590.000649
440.2291393.36760.000449
450.2398193.52460.000259
460.2517173.69950.000137
470.2614083.84198e-05
480.2604893.82848.4e-05

\begin{tabular}{lllllllll}
\hline
Autocorrelation Function \tabularnewline
Time lag k & ACF(k) & T-STAT & P-value \tabularnewline
1 & 0.959872 & 14.1072 & 0 \tabularnewline
2 & 0.9128 & 13.4154 & 0 \tabularnewline
3 & 0.864395 & 12.704 & 0 \tabularnewline
4 & 0.825496 & 12.1323 & 0 \tabularnewline
5 & 0.795826 & 11.6962 & 0 \tabularnewline
6 & 0.773005 & 11.3608 & 0 \tabularnewline
7 & 0.751732 & 11.0482 & 0 \tabularnewline
8 & 0.734555 & 10.7957 & 0 \tabularnewline
9 & 0.724025 & 10.6409 & 0 \tabularnewline
10 & 0.722877 & 10.6241 & 0 \tabularnewline
11 & 0.719786 & 10.5787 & 0 \tabularnewline
12 & 0.710819 & 10.4469 & 0 \tabularnewline
13 & 0.679038 & 9.9798 & 0 \tabularnewline
14 & 0.639058 & 9.3922 & 0 \tabularnewline
15 & 0.600868 & 8.8309 & 0 \tabularnewline
16 & 0.567293 & 8.3375 & 0 \tabularnewline
17 & 0.542791 & 7.9774 & 0 \tabularnewline
18 & 0.525807 & 7.7277 & 0 \tabularnewline
19 & 0.517152 & 7.6006 & 0 \tabularnewline
20 & 0.520946 & 7.6563 & 0 \tabularnewline
21 & 0.530096 & 7.7908 & 0 \tabularnewline
22 & 0.543537 & 7.9883 & 0 \tabularnewline
23 & 0.554796 & 8.1538 & 0 \tabularnewline
24 & 0.552684 & 8.1228 & 0 \tabularnewline
25 & 0.5273 & 7.7497 & 0 \tabularnewline
26 & 0.492179 & 7.2335 & 0 \tabularnewline
27 & 0.458352 & 6.7364 & 0 \tabularnewline
28 & 0.431359 & 6.3397 & 0 \tabularnewline
29 & 0.407953 & 5.9957 & 0 \tabularnewline
30 & 0.388743 & 5.7133 & 0 \tabularnewline
31 & 0.380272 & 5.5888 & 0 \tabularnewline
32 & 0.377699 & 5.551 & 0 \tabularnewline
33 & 0.379302 & 5.5746 & 0 \tabularnewline
34 & 0.382945 & 5.6281 & 0 \tabularnewline
35 & 0.385539 & 5.6662 & 0 \tabularnewline
36 & 0.379615 & 5.5792 & 0 \tabularnewline
37 & 0.352376 & 5.1788 & 0 \tabularnewline
38 & 0.319484 & 4.6954 & 2e-06 \tabularnewline
39 & 0.286003 & 4.2034 & 1.9e-05 \tabularnewline
40 & 0.260561 & 3.8295 & 8.4e-05 \tabularnewline
41 & 0.239739 & 3.5234 & 0.00026 \tabularnewline
42 & 0.228547 & 3.3589 & 0.000462 \tabularnewline
43 & 0.221744 & 3.259 & 0.000649 \tabularnewline
44 & 0.229139 & 3.3676 & 0.000449 \tabularnewline
45 & 0.239819 & 3.5246 & 0.000259 \tabularnewline
46 & 0.251717 & 3.6995 & 0.000137 \tabularnewline
47 & 0.261408 & 3.8419 & 8e-05 \tabularnewline
48 & 0.260489 & 3.8284 & 8.4e-05 \tabularnewline
\hline
\end{tabular}
%Source: https://freestatistics.org/blog/index.php?pk=234265&T=1

[TABLE]
[ROW][C]Autocorrelation Function[/C][/ROW]
[ROW][C]Time lag k[/C][C]ACF(k)[/C][C]T-STAT[/C][C]P-value[/C][/ROW]
[ROW][C]1[/C][C]0.959872[/C][C]14.1072[/C][C]0[/C][/ROW]
[ROW][C]2[/C][C]0.9128[/C][C]13.4154[/C][C]0[/C][/ROW]
[ROW][C]3[/C][C]0.864395[/C][C]12.704[/C][C]0[/C][/ROW]
[ROW][C]4[/C][C]0.825496[/C][C]12.1323[/C][C]0[/C][/ROW]
[ROW][C]5[/C][C]0.795826[/C][C]11.6962[/C][C]0[/C][/ROW]
[ROW][C]6[/C][C]0.773005[/C][C]11.3608[/C][C]0[/C][/ROW]
[ROW][C]7[/C][C]0.751732[/C][C]11.0482[/C][C]0[/C][/ROW]
[ROW][C]8[/C][C]0.734555[/C][C]10.7957[/C][C]0[/C][/ROW]
[ROW][C]9[/C][C]0.724025[/C][C]10.6409[/C][C]0[/C][/ROW]
[ROW][C]10[/C][C]0.722877[/C][C]10.6241[/C][C]0[/C][/ROW]
[ROW][C]11[/C][C]0.719786[/C][C]10.5787[/C][C]0[/C][/ROW]
[ROW][C]12[/C][C]0.710819[/C][C]10.4469[/C][C]0[/C][/ROW]
[ROW][C]13[/C][C]0.679038[/C][C]9.9798[/C][C]0[/C][/ROW]
[ROW][C]14[/C][C]0.639058[/C][C]9.3922[/C][C]0[/C][/ROW]
[ROW][C]15[/C][C]0.600868[/C][C]8.8309[/C][C]0[/C][/ROW]
[ROW][C]16[/C][C]0.567293[/C][C]8.3375[/C][C]0[/C][/ROW]
[ROW][C]17[/C][C]0.542791[/C][C]7.9774[/C][C]0[/C][/ROW]
[ROW][C]18[/C][C]0.525807[/C][C]7.7277[/C][C]0[/C][/ROW]
[ROW][C]19[/C][C]0.517152[/C][C]7.6006[/C][C]0[/C][/ROW]
[ROW][C]20[/C][C]0.520946[/C][C]7.6563[/C][C]0[/C][/ROW]
[ROW][C]21[/C][C]0.530096[/C][C]7.7908[/C][C]0[/C][/ROW]
[ROW][C]22[/C][C]0.543537[/C][C]7.9883[/C][C]0[/C][/ROW]
[ROW][C]23[/C][C]0.554796[/C][C]8.1538[/C][C]0[/C][/ROW]
[ROW][C]24[/C][C]0.552684[/C][C]8.1228[/C][C]0[/C][/ROW]
[ROW][C]25[/C][C]0.5273[/C][C]7.7497[/C][C]0[/C][/ROW]
[ROW][C]26[/C][C]0.492179[/C][C]7.2335[/C][C]0[/C][/ROW]
[ROW][C]27[/C][C]0.458352[/C][C]6.7364[/C][C]0[/C][/ROW]
[ROW][C]28[/C][C]0.431359[/C][C]6.3397[/C][C]0[/C][/ROW]
[ROW][C]29[/C][C]0.407953[/C][C]5.9957[/C][C]0[/C][/ROW]
[ROW][C]30[/C][C]0.388743[/C][C]5.7133[/C][C]0[/C][/ROW]
[ROW][C]31[/C][C]0.380272[/C][C]5.5888[/C][C]0[/C][/ROW]
[ROW][C]32[/C][C]0.377699[/C][C]5.551[/C][C]0[/C][/ROW]
[ROW][C]33[/C][C]0.379302[/C][C]5.5746[/C][C]0[/C][/ROW]
[ROW][C]34[/C][C]0.382945[/C][C]5.6281[/C][C]0[/C][/ROW]
[ROW][C]35[/C][C]0.385539[/C][C]5.6662[/C][C]0[/C][/ROW]
[ROW][C]36[/C][C]0.379615[/C][C]5.5792[/C][C]0[/C][/ROW]
[ROW][C]37[/C][C]0.352376[/C][C]5.1788[/C][C]0[/C][/ROW]
[ROW][C]38[/C][C]0.319484[/C][C]4.6954[/C][C]2e-06[/C][/ROW]
[ROW][C]39[/C][C]0.286003[/C][C]4.2034[/C][C]1.9e-05[/C][/ROW]
[ROW][C]40[/C][C]0.260561[/C][C]3.8295[/C][C]8.4e-05[/C][/ROW]
[ROW][C]41[/C][C]0.239739[/C][C]3.5234[/C][C]0.00026[/C][/ROW]
[ROW][C]42[/C][C]0.228547[/C][C]3.3589[/C][C]0.000462[/C][/ROW]
[ROW][C]43[/C][C]0.221744[/C][C]3.259[/C][C]0.000649[/C][/ROW]
[ROW][C]44[/C][C]0.229139[/C][C]3.3676[/C][C]0.000449[/C][/ROW]
[ROW][C]45[/C][C]0.239819[/C][C]3.5246[/C][C]0.000259[/C][/ROW]
[ROW][C]46[/C][C]0.251717[/C][C]3.6995[/C][C]0.000137[/C][/ROW]
[ROW][C]47[/C][C]0.261408[/C][C]3.8419[/C][C]8e-05[/C][/ROW]
[ROW][C]48[/C][C]0.260489[/C][C]3.8284[/C][C]8.4e-05[/C][/ROW]
[/TABLE]
Source: https://freestatistics.org/blog/index.php?pk=234265&T=1

Globally Unique Identifier (entire table): ba.freestatistics.org/blog/index.php?pk=234265&T=1

As an alternative you can also use a QR Code:  

The GUIDs for individual cells are displayed in the table below:

Autocorrelation Function
Time lag kACF(k)T-STATP-value
10.95987214.10720
20.912813.41540
30.86439512.7040
40.82549612.13230
50.79582611.69620
60.77300511.36080
70.75173211.04820
80.73455510.79570
90.72402510.64090
100.72287710.62410
110.71978610.57870
120.71081910.44690
130.6790389.97980
140.6390589.39220
150.6008688.83090
160.5672938.33750
170.5427917.97740
180.5258077.72770
190.5171527.60060
200.5209467.65630
210.5300967.79080
220.5435377.98830
230.5547968.15380
240.5526848.12280
250.52737.74970
260.4921797.23350
270.4583526.73640
280.4313596.33970
290.4079535.99570
300.3887435.71330
310.3802725.58880
320.3776995.5510
330.3793025.57460
340.3829455.62810
350.3855395.66620
360.3796155.57920
370.3523765.17880
380.3194844.69542e-06
390.2860034.20341.9e-05
400.2605613.82958.4e-05
410.2397393.52340.00026
420.2285473.35890.000462
430.2217443.2590.000649
440.2291393.36760.000449
450.2398193.52460.000259
460.2517173.69950.000137
470.2614083.84198e-05
480.2604893.82848.4e-05


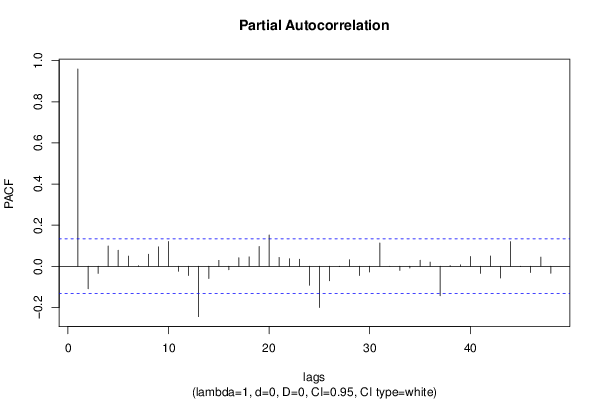
Partial Autocorrelation Function
Time lag kPACF(k)T-STATP-value
10.95987214.10720
2-0.108773-1.59860.055683
3-0.034374-0.50520.306968
40.0986591.450.074257
50.0778351.14390.12696
60.0496480.72970.233191
70.0032010.0470.481259
80.0584350.85880.195696
90.094531.38930.083085
100.120951.77760.038439
11-0.024067-0.35370.361948
12-0.044678-0.65660.256057
13-0.244772-3.59740.000199
14-0.059514-0.87470.191361
150.0289330.42520.335547
16-0.016492-0.24240.404359
170.0418830.61560.269417
180.0460120.67620.249808
190.0964391.41740.078909
200.1525632.24220.012982
210.0433850.63760.262198
220.0368530.54160.294319
230.0347010.510.305285
24-0.09213-1.3540.088571
25-0.200204-2.94240.001806
26-0.07038-1.03440.151058
27-0.001384-0.02030.491893
280.0322980.47470.317747
29-0.044853-0.65920.255236
30-0.027395-0.40260.343811
310.1130681.66180.049006
32-0.000491-0.00720.497126
33-0.019911-0.29260.385041
34-0.008541-0.12550.450112
350.0296530.43580.331708
360.020370.29940.382471
37-0.143575-2.11010.018
380.0033030.04850.480664
390.0070110.1030.459014
400.0480050.70550.240623
41-0.034177-0.50230.307987
420.0500430.73550.231424
43-0.056901-0.83630.201964
440.120031.76410.039567
45-0.001234-0.01810.492776
46-0.030178-0.44350.328914
470.0447930.65830.255516
48-0.033795-0.49670.309961

\begin{tabular}{lllllllll}
\hline
Partial Autocorrelation Function \tabularnewline
Time lag k & PACF(k) & T-STAT & P-value \tabularnewline
1 & 0.959872 & 14.1072 & 0 \tabularnewline
2 & -0.108773 & -1.5986 & 0.055683 \tabularnewline
3 & -0.034374 & -0.5052 & 0.306968 \tabularnewline
4 & 0.098659 & 1.45 & 0.074257 \tabularnewline
5 & 0.077835 & 1.1439 & 0.12696 \tabularnewline
6 & 0.049648 & 0.7297 & 0.233191 \tabularnewline
7 & 0.003201 & 0.047 & 0.481259 \tabularnewline
8 & 0.058435 & 0.8588 & 0.195696 \tabularnewline
9 & 0.09453 & 1.3893 & 0.083085 \tabularnewline
10 & 0.12095 & 1.7776 & 0.038439 \tabularnewline
11 & -0.024067 & -0.3537 & 0.361948 \tabularnewline
12 & -0.044678 & -0.6566 & 0.256057 \tabularnewline
13 & -0.244772 & -3.5974 & 0.000199 \tabularnewline
14 & -0.059514 & -0.8747 & 0.191361 \tabularnewline
15 & 0.028933 & 0.4252 & 0.335547 \tabularnewline
16 & -0.016492 & -0.2424 & 0.404359 \tabularnewline
17 & 0.041883 & 0.6156 & 0.269417 \tabularnewline
18 & 0.046012 & 0.6762 & 0.249808 \tabularnewline
19 & 0.096439 & 1.4174 & 0.078909 \tabularnewline
20 & 0.152563 & 2.2422 & 0.012982 \tabularnewline
21 & 0.043385 & 0.6376 & 0.262198 \tabularnewline
22 & 0.036853 & 0.5416 & 0.294319 \tabularnewline
23 & 0.034701 & 0.51 & 0.305285 \tabularnewline
24 & -0.09213 & -1.354 & 0.088571 \tabularnewline
25 & -0.200204 & -2.9424 & 0.001806 \tabularnewline
26 & -0.07038 & -1.0344 & 0.151058 \tabularnewline
27 & -0.001384 & -0.0203 & 0.491893 \tabularnewline
28 & 0.032298 & 0.4747 & 0.317747 \tabularnewline
29 & -0.044853 & -0.6592 & 0.255236 \tabularnewline
30 & -0.027395 & -0.4026 & 0.343811 \tabularnewline
31 & 0.113068 & 1.6618 & 0.049006 \tabularnewline
32 & -0.000491 & -0.0072 & 0.497126 \tabularnewline
33 & -0.019911 & -0.2926 & 0.385041 \tabularnewline
34 & -0.008541 & -0.1255 & 0.450112 \tabularnewline
35 & 0.029653 & 0.4358 & 0.331708 \tabularnewline
36 & 0.02037 & 0.2994 & 0.382471 \tabularnewline
37 & -0.143575 & -2.1101 & 0.018 \tabularnewline
38 & 0.003303 & 0.0485 & 0.480664 \tabularnewline
39 & 0.007011 & 0.103 & 0.459014 \tabularnewline
40 & 0.048005 & 0.7055 & 0.240623 \tabularnewline
41 & -0.034177 & -0.5023 & 0.307987 \tabularnewline
42 & 0.050043 & 0.7355 & 0.231424 \tabularnewline
43 & -0.056901 & -0.8363 & 0.201964 \tabularnewline
44 & 0.12003 & 1.7641 & 0.039567 \tabularnewline
45 & -0.001234 & -0.0181 & 0.492776 \tabularnewline
46 & -0.030178 & -0.4435 & 0.328914 \tabularnewline
47 & 0.044793 & 0.6583 & 0.255516 \tabularnewline
48 & -0.033795 & -0.4967 & 0.309961 \tabularnewline
\hline
\end{tabular}
%Source: https://freestatistics.org/blog/index.php?pk=234265&T=2

[TABLE]
[ROW][C]Partial Autocorrelation Function[/C][/ROW]
[ROW][C]Time lag k[/C][C]PACF(k)[/C][C]T-STAT[/C][C]P-value[/C][/ROW]
[ROW][C]1[/C][C]0.959872[/C][C]14.1072[/C][C]0[/C][/ROW]
[ROW][C]2[/C][C]-0.108773[/C][C]-1.5986[/C][C]0.055683[/C][/ROW]
[ROW][C]3[/C][C]-0.034374[/C][C]-0.5052[/C][C]0.306968[/C][/ROW]
[ROW][C]4[/C][C]0.098659[/C][C]1.45[/C][C]0.074257[/C][/ROW]
[ROW][C]5[/C][C]0.077835[/C][C]1.1439[/C][C]0.12696[/C][/ROW]
[ROW][C]6[/C][C]0.049648[/C][C]0.7297[/C][C]0.233191[/C][/ROW]
[ROW][C]7[/C][C]0.003201[/C][C]0.047[/C][C]0.481259[/C][/ROW]
[ROW][C]8[/C][C]0.058435[/C][C]0.8588[/C][C]0.195696[/C][/ROW]
[ROW][C]9[/C][C]0.09453[/C][C]1.3893[/C][C]0.083085[/C][/ROW]
[ROW][C]10[/C][C]0.12095[/C][C]1.7776[/C][C]0.038439[/C][/ROW]
[ROW][C]11[/C][C]-0.024067[/C][C]-0.3537[/C][C]0.361948[/C][/ROW]
[ROW][C]12[/C][C]-0.044678[/C][C]-0.6566[/C][C]0.256057[/C][/ROW]
[ROW][C]13[/C][C]-0.244772[/C][C]-3.5974[/C][C]0.000199[/C][/ROW]
[ROW][C]14[/C][C]-0.059514[/C][C]-0.8747[/C][C]0.191361[/C][/ROW]
[ROW][C]15[/C][C]0.028933[/C][C]0.4252[/C][C]0.335547[/C][/ROW]
[ROW][C]16[/C][C]-0.016492[/C][C]-0.2424[/C][C]0.404359[/C][/ROW]
[ROW][C]17[/C][C]0.041883[/C][C]0.6156[/C][C]0.269417[/C][/ROW]
[ROW][C]18[/C][C]0.046012[/C][C]0.6762[/C][C]0.249808[/C][/ROW]
[ROW][C]19[/C][C]0.096439[/C][C]1.4174[/C][C]0.078909[/C][/ROW]
[ROW][C]20[/C][C]0.152563[/C][C]2.2422[/C][C]0.012982[/C][/ROW]
[ROW][C]21[/C][C]0.043385[/C][C]0.6376[/C][C]0.262198[/C][/ROW]
[ROW][C]22[/C][C]0.036853[/C][C]0.5416[/C][C]0.294319[/C][/ROW]
[ROW][C]23[/C][C]0.034701[/C][C]0.51[/C][C]0.305285[/C][/ROW]
[ROW][C]24[/C][C]-0.09213[/C][C]-1.354[/C][C]0.088571[/C][/ROW]
[ROW][C]25[/C][C]-0.200204[/C][C]-2.9424[/C][C]0.001806[/C][/ROW]
[ROW][C]26[/C][C]-0.07038[/C][C]-1.0344[/C][C]0.151058[/C][/ROW]
[ROW][C]27[/C][C]-0.001384[/C][C]-0.0203[/C][C]0.491893[/C][/ROW]
[ROW][C]28[/C][C]0.032298[/C][C]0.4747[/C][C]0.317747[/C][/ROW]
[ROW][C]29[/C][C]-0.044853[/C][C]-0.6592[/C][C]0.255236[/C][/ROW]
[ROW][C]30[/C][C]-0.027395[/C][C]-0.4026[/C][C]0.343811[/C][/ROW]
[ROW][C]31[/C][C]0.113068[/C][C]1.6618[/C][C]0.049006[/C][/ROW]
[ROW][C]32[/C][C]-0.000491[/C][C]-0.0072[/C][C]0.497126[/C][/ROW]
[ROW][C]33[/C][C]-0.019911[/C][C]-0.2926[/C][C]0.385041[/C][/ROW]
[ROW][C]34[/C][C]-0.008541[/C][C]-0.1255[/C][C]0.450112[/C][/ROW]
[ROW][C]35[/C][C]0.029653[/C][C]0.4358[/C][C]0.331708[/C][/ROW]
[ROW][C]36[/C][C]0.02037[/C][C]0.2994[/C][C]0.382471[/C][/ROW]
[ROW][C]37[/C][C]-0.143575[/C][C]-2.1101[/C][C]0.018[/C][/ROW]
[ROW][C]38[/C][C]0.003303[/C][C]0.0485[/C][C]0.480664[/C][/ROW]
[ROW][C]39[/C][C]0.007011[/C][C]0.103[/C][C]0.459014[/C][/ROW]
[ROW][C]40[/C][C]0.048005[/C][C]0.7055[/C][C]0.240623[/C][/ROW]
[ROW][C]41[/C][C]-0.034177[/C][C]-0.5023[/C][C]0.307987[/C][/ROW]
[ROW][C]42[/C][C]0.050043[/C][C]0.7355[/C][C]0.231424[/C][/ROW]
[ROW][C]43[/C][C]-0.056901[/C][C]-0.8363[/C][C]0.201964[/C][/ROW]
[ROW][C]44[/C][C]0.12003[/C][C]1.7641[/C][C]0.039567[/C][/ROW]
[ROW][C]45[/C][C]-0.001234[/C][C]-0.0181[/C][C]0.492776[/C][/ROW]
[ROW][C]46[/C][C]-0.030178[/C][C]-0.4435[/C][C]0.328914[/C][/ROW]
[ROW][C]47[/C][C]0.044793[/C][C]0.6583[/C][C]0.255516[/C][/ROW]
[ROW][C]48[/C][C]-0.033795[/C][C]-0.4967[/C][C]0.309961[/C][/ROW]
[/TABLE]
Source: https://freestatistics.org/blog/index.php?pk=234265&T=2

Globally Unique Identifier (entire table): ba.freestatistics.org/blog/index.php?pk=234265&T=2

As an alternative you can also use a QR Code:  

The GUIDs for individual cells are displayed in the table below:

Partial Autocorrelation Function
Time lag kPACF(k)T-STATP-value
10.95987214.10720
2-0.108773-1.59860.055683
3-0.034374-0.50520.306968
40.0986591.450.074257
50.0778351.14390.12696
60.0496480.72970.233191
70.0032010.0470.481259
80.0584350.85880.195696
90.094531.38930.083085
100.120951.77760.038439
11-0.024067-0.35370.361948
12-0.044678-0.65660.256057
13-0.244772-3.59740.000199
14-0.059514-0.87470.191361
150.0289330.42520.335547
16-0.016492-0.24240.404359
170.0418830.61560.269417
180.0460120.67620.249808
190.0964391.41740.078909
200.1525632.24220.012982
210.0433850.63760.262198
220.0368530.54160.294319
230.0347010.510.305285
24-0.09213-1.3540.088571
25-0.200204-2.94240.001806
26-0.07038-1.03440.151058
27-0.001384-0.02030.491893
280.0322980.47470.317747
29-0.044853-0.65920.255236
30-0.027395-0.40260.343811
310.1130681.66180.049006
32-0.000491-0.00720.497126
33-0.019911-0.29260.385041
34-0.008541-0.12550.450112
350.0296530.43580.331708
360.020370.29940.382471
37-0.143575-2.11010.018
380.0033030.04850.480664
390.0070110.1030.459014
400.0480050.70550.240623
41-0.034177-0.50230.307987
420.0500430.73550.231424
43-0.056901-0.83630.201964
440.120031.76410.039567
45-0.001234-0.01810.492776
46-0.030178-0.44350.328914
470.0447930.65830.255516
48-0.033795-0.49670.309961


Parameters (Session):
par1 = 48 ; par2 = 1 ; par3 = 0 ; par4 = 0 ; par5 = 12 ; par6 = White Noise ; par7 = 0.95 ;
Parameters (R input):
par1 = 48 ; par2 = 1 ; par3 = 0 ; par4 = 0 ; par5 = 12 ; par6 = White Noise ; par7 = 0.95 ; par8 = ;
R code (references can be found in the software module):
par8 <- ''
par7 <- '0.95'
par6 <- 'White Noise'
par5 <- '12'
par4 <- '0'
par3 <- '0'
par2 <- '1'
par1 <- 'Default'
if (par1 == 'Default') {
par1 = 10*log10(length(x))
} else {
par1 <- as.numeric(par1)
}
par2 <- as.numeric(par2)
par3 <- as.numeric(par3)
par4 <- as.numeric(par4)
par5 <- as.numeric(par5)
if (par6 == 'White Noise') par6 <- 'white' else par6 <- 'ma'
par7 <- as.numeric(par7)
if (par8 != '') par8 <- as.numeric(par8)
ox <- x
if (par8 == '') {
if (par2 == 0) {
x <- log(x)
} else {
x <- (x ^ par2 - 1) / par2
}
} else {
x <- log(x,base=par8)
}
if (par3 > 0) x <- diff(x,lag=1,difference=par3)
if (par4 > 0) x <- diff(x,lag=par5,difference=par4)
bitmap(file='picts.png')
op <- par(mfrow=c(2,1))
plot(ox,type='l',main='Original Time Series',xlab='time',ylab='value')
if (par8=='') {
mytitle <- paste('Working Time Series (lambda=',par2,', d=',par3,', D=',par4,')',sep='')
mysub <- paste('(lambda=',par2,', d=',par3,', D=',par4,', CI=', par7, ', CI type=',par6,')',sep='')
} else {
mytitle <- paste('Working Time Series (base=',par8,', d=',par3,', D=',par4,')',sep='')
mysub <- paste('(base=',par8,', d=',par3,', D=',par4,', CI=', par7, ', CI type=',par6,')',sep='')
}
plot(x,type='l', main=mytitle,xlab='time',ylab='value')
par(op)
dev.off()
bitmap(file='pic1.png')
racf <- acf(x, par1, main='Autocorrelation', xlab='time lag', ylab='ACF', ci.type=par6, ci=par7, sub=mysub)
dev.off()
bitmap(file='pic2.png')
rpacf <- pacf(x,par1,main='Partial Autocorrelation',xlab='lags',ylab='PACF',sub=mysub)
dev.off()
(myacf <- c(racf$acf))
(mypacf <- c(rpacf$acf))
lengthx <- length(x)
sqrtn <- sqrt(lengthx)
load(file='createtable')
a<-table.start()
a<-table.row.start(a)
a<-table.element(a,'Autocorrelation Function',4,TRUE)
a<-table.row.end(a)
a<-table.row.start(a)
a<-table.element(a,'Time lag k',header=TRUE)
a<-table.element(a,hyperlink('basics.htm','ACF(k)','click here for more information about the Autocorrelation Function'),header=TRUE)
a<-table.element(a,'T-STAT',header=TRUE)
a<-table.element(a,'P-value',header=TRUE)
a<-table.row.end(a)
for (i in 2:(par1+1)) {
a<-table.row.start(a)
a<-table.element(a,i-1,header=TRUE)
a<-table.element(a,round(myacf[i],6))
mytstat <- myacf[i]*sqrtn
a<-table.element(a,round(mytstat,4))
a<-table.element(a,round(1-pt(abs(mytstat),lengthx),6))
a<-table.row.end(a)
}
a<-table.end(a)
table.save(a,file='mytable.tab')
a<-table.start()
a<-table.row.start(a)
a<-table.element(a,'Partial Autocorrelation Function',4,TRUE)
a<-table.row.end(a)
a<-table.row.start(a)
a<-table.element(a,'Time lag k',header=TRUE)
a<-table.element(a,hyperlink('basics.htm','PACF(k)','click here for more information about the Partial Autocorrelation Function'),header=TRUE)
a<-table.element(a,'T-STAT',header=TRUE)
a<-table.element(a,'P-value',header=TRUE)
a<-table.row.end(a)
for (i in 1:par1) {
a<-table.row.start(a)
a<-table.element(a,i,header=TRUE)
a<-table.element(a,round(mypacf[i],6))
mytstat <- mypacf[i]*sqrtn
a<-table.element(a,round(mytstat,4))
a<-table.element(a,round(1-pt(abs(mytstat),lengthx),6))
a<-table.row.end(a)
}
a<-table.end(a)
table.save(a,file='mytable1.tab')