Free Statistics

of Irreproducible Research!

Author's title

Author*Unverified author*
R Software Modulerwasp_autocorrelation.wasp
Title produced by software(Partial) Autocorrelation Function
Date of computationSun, 16 Mar 2014 14:40:30 -0400
Cite this page as followsStatistical Computations at FreeStatistics.org, Office for Research Development and Education, URL https://freestatistics.org/blog/index.php?v=date/2014/Mar/16/t1394995300qngwjlb4vkxgniu.htm/, Retrieved Mon, 13 May 2024 20:52:39 +0000
Statistical Computations at FreeStatistics.org, Office for Research Development and Education, URL https://freestatistics.org/blog/index.php?pk=234274, Retrieved Mon, 13 May 2024 20:52:39 +0000
QR Codes:

Original text written by user:
IsPrivate?No (this computation is public)
User-defined keywords
Estimated Impact142
Family? (F = Feedback message, R = changed R code, M = changed R Module, P = changed Parameters, D = changed Data)
-       [(Partial) Autocorrelation Function] [] [2014-03-16 18:40:30] [bc62d516d7cc59b06dcff229811e1a47] [Current]
Feedback Forum

Post a new message
Dataseries X:
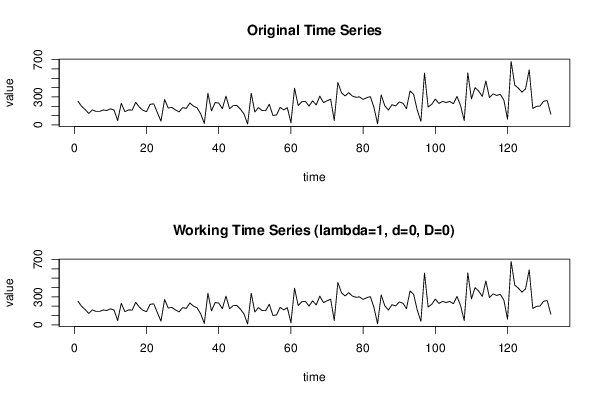
254
200
165
123
162
145
145
161
155
173
160
47
232
143
161
159
243
192
157
143
221
227
132
41
273
182
188
162
140
186
178
236
202
184
119
16
340
151
240
235
174
309
174
207
209
171
117
10
339
139
186
155
153
222
102
107
188
162
185
24
394
209
248
254
202
258
215
309
240
258
276
48
455
345
311
346
310
297
300
274
292
304
186
14
321
206
160
217
204
246
234
175
364
328
158
40
556
193
221
278
230
253
240
252
228
306
206
48
557
279
399
364
306
471
293
333
316
329
265
61
679
428
394
352
387
590
177
199
203
255
261
115


Summary of computational transaction
Raw Inputview raw input (R code)
Raw Outputview raw output of R engine
Computing time4 seconds
R Server'Gwilym Jenkins' @ jenkins.wessa.net

\begin{tabular}{lllllllll}
\hline
Summary of computational transaction \tabularnewline
Raw Input & view raw input (R code)  \tabularnewline
Raw Output & view raw output of R engine  \tabularnewline
Computing time & 4 seconds \tabularnewline
R Server & 'Gwilym Jenkins' @ jenkins.wessa.net \tabularnewline
\hline
\end{tabular}
%Source: https://freestatistics.org/blog/index.php?pk=234274&T=0

[TABLE]
[ROW][C]Summary of computational transaction[/C][/ROW]
[ROW][C]Raw Input[/C][C]view raw input (R code) [/C][/ROW]
[ROW][C]Raw Output[/C][C]view raw output of R engine [/C][/ROW]
[ROW][C]Computing time[/C][C]4 seconds[/C][/ROW]
[ROW][C]R Server[/C][C]'Gwilym Jenkins' @ jenkins.wessa.net[/C][/ROW]
[/TABLE]
Source: https://freestatistics.org/blog/index.php?pk=234274&T=0

Globally Unique Identifier (entire table): ba.freestatistics.org/blog/index.php?pk=234274&T=0

As an alternative you can also use a QR Code:  

The GUIDs for individual cells are displayed in the table below:

Summary of computational transaction
Raw Inputview raw input (R code)
Raw Outputview raw output of R engine
Computing time4 seconds
R Server'Gwilym Jenkins' @ jenkins.wessa.net


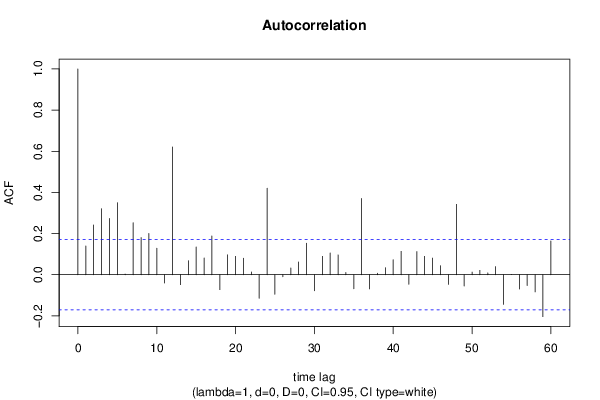
Autocorrelation Function
Time lag kACF(k)T-STATP-value
10.1395641.60350.055611
20.2417632.77770.003137
30.3205073.68230.000168
40.2734663.14190.001036
50.35014.02234.8e-05
60.0028040.03220.487175
70.2524862.90080.002181
80.1801022.06920.020239
90.1999062.29670.011604
100.128451.47580.071192
11-0.040182-0.46170.322545
120.6204997.1290
13-0.04829-0.55480.289981
140.067890.780.218394
150.1349861.55090.061664
160.080790.92820.177497
170.1880622.16070.016263
18-0.072673-0.83490.202628
190.0962931.10630.135301
200.0892691.02560.153474
210.0798130.9170.180414
220.0133180.1530.439311
23-0.114927-1.32040.094491
240.4199844.82522e-06
25-0.095059-1.09210.138379
26-0.010118-0.11630.453815
270.0325670.37420.35444
280.0621350.71390.238281
290.1525141.75230.041026
30-0.078141-0.89780.185472
310.0890461.02310.154074
320.1058571.21620.113038
330.0962241.10550.13547
340.011090.12740.449404
35-0.068734-0.78970.215563
360.3703074.25452e-05
37-0.069011-0.79290.214637
380.0072470.08330.466885
390.0335960.3860.350063
400.072290.83060.203863
410.1133951.30280.097453
42-0.0463-0.53190.29783
430.1120451.28730.100121
440.0891361.02410.153831
450.0805170.92510.178309
460.0433890.49850.309482
47-0.047284-0.54330.293934
480.3419763.9296.8e-05
49-0.054805-0.62970.265003
500.0126050.14480.442538
510.0210320.24160.404715
520.0087490.10050.460043
530.0393080.45160.326144
54-0.144463-1.65980.049669
550.0001270.00150.49942
56-0.069583-0.79940.212733
57-0.052733-0.60590.272826
58-0.083677-0.96140.169062
59-0.20392-2.34290.010315
600.1636141.87980.031171

\begin{tabular}{lllllllll}
\hline
Autocorrelation Function \tabularnewline
Time lag k & ACF(k) & T-STAT & P-value \tabularnewline
1 & 0.139564 & 1.6035 & 0.055611 \tabularnewline
2 & 0.241763 & 2.7777 & 0.003137 \tabularnewline
3 & 0.320507 & 3.6823 & 0.000168 \tabularnewline
4 & 0.273466 & 3.1419 & 0.001036 \tabularnewline
5 & 0.3501 & 4.0223 & 4.8e-05 \tabularnewline
6 & 0.002804 & 0.0322 & 0.487175 \tabularnewline
7 & 0.252486 & 2.9008 & 0.002181 \tabularnewline
8 & 0.180102 & 2.0692 & 0.020239 \tabularnewline
9 & 0.199906 & 2.2967 & 0.011604 \tabularnewline
10 & 0.12845 & 1.4758 & 0.071192 \tabularnewline
11 & -0.040182 & -0.4617 & 0.322545 \tabularnewline
12 & 0.620499 & 7.129 & 0 \tabularnewline
13 & -0.04829 & -0.5548 & 0.289981 \tabularnewline
14 & 0.06789 & 0.78 & 0.218394 \tabularnewline
15 & 0.134986 & 1.5509 & 0.061664 \tabularnewline
16 & 0.08079 & 0.9282 & 0.177497 \tabularnewline
17 & 0.188062 & 2.1607 & 0.016263 \tabularnewline
18 & -0.072673 & -0.8349 & 0.202628 \tabularnewline
19 & 0.096293 & 1.1063 & 0.135301 \tabularnewline
20 & 0.089269 & 1.0256 & 0.153474 \tabularnewline
21 & 0.079813 & 0.917 & 0.180414 \tabularnewline
22 & 0.013318 & 0.153 & 0.439311 \tabularnewline
23 & -0.114927 & -1.3204 & 0.094491 \tabularnewline
24 & 0.419984 & 4.8252 & 2e-06 \tabularnewline
25 & -0.095059 & -1.0921 & 0.138379 \tabularnewline
26 & -0.010118 & -0.1163 & 0.453815 \tabularnewline
27 & 0.032567 & 0.3742 & 0.35444 \tabularnewline
28 & 0.062135 & 0.7139 & 0.238281 \tabularnewline
29 & 0.152514 & 1.7523 & 0.041026 \tabularnewline
30 & -0.078141 & -0.8978 & 0.185472 \tabularnewline
31 & 0.089046 & 1.0231 & 0.154074 \tabularnewline
32 & 0.105857 & 1.2162 & 0.113038 \tabularnewline
33 & 0.096224 & 1.1055 & 0.13547 \tabularnewline
34 & 0.01109 & 0.1274 & 0.449404 \tabularnewline
35 & -0.068734 & -0.7897 & 0.215563 \tabularnewline
36 & 0.370307 & 4.2545 & 2e-05 \tabularnewline
37 & -0.069011 & -0.7929 & 0.214637 \tabularnewline
38 & 0.007247 & 0.0833 & 0.466885 \tabularnewline
39 & 0.033596 & 0.386 & 0.350063 \tabularnewline
40 & 0.07229 & 0.8306 & 0.203863 \tabularnewline
41 & 0.113395 & 1.3028 & 0.097453 \tabularnewline
42 & -0.0463 & -0.5319 & 0.29783 \tabularnewline
43 & 0.112045 & 1.2873 & 0.100121 \tabularnewline
44 & 0.089136 & 1.0241 & 0.153831 \tabularnewline
45 & 0.080517 & 0.9251 & 0.178309 \tabularnewline
46 & 0.043389 & 0.4985 & 0.309482 \tabularnewline
47 & -0.047284 & -0.5433 & 0.293934 \tabularnewline
48 & 0.341976 & 3.929 & 6.8e-05 \tabularnewline
49 & -0.054805 & -0.6297 & 0.265003 \tabularnewline
50 & 0.012605 & 0.1448 & 0.442538 \tabularnewline
51 & 0.021032 & 0.2416 & 0.404715 \tabularnewline
52 & 0.008749 & 0.1005 & 0.460043 \tabularnewline
53 & 0.039308 & 0.4516 & 0.326144 \tabularnewline
54 & -0.144463 & -1.6598 & 0.049669 \tabularnewline
55 & 0.000127 & 0.0015 & 0.49942 \tabularnewline
56 & -0.069583 & -0.7994 & 0.212733 \tabularnewline
57 & -0.052733 & -0.6059 & 0.272826 \tabularnewline
58 & -0.083677 & -0.9614 & 0.169062 \tabularnewline
59 & -0.20392 & -2.3429 & 0.010315 \tabularnewline
60 & 0.163614 & 1.8798 & 0.031171 \tabularnewline
\hline
\end{tabular}
%Source: https://freestatistics.org/blog/index.php?pk=234274&T=1

[TABLE]
[ROW][C]Autocorrelation Function[/C][/ROW]
[ROW][C]Time lag k[/C][C]ACF(k)[/C][C]T-STAT[/C][C]P-value[/C][/ROW]
[ROW][C]1[/C][C]0.139564[/C][C]1.6035[/C][C]0.055611[/C][/ROW]
[ROW][C]2[/C][C]0.241763[/C][C]2.7777[/C][C]0.003137[/C][/ROW]
[ROW][C]3[/C][C]0.320507[/C][C]3.6823[/C][C]0.000168[/C][/ROW]
[ROW][C]4[/C][C]0.273466[/C][C]3.1419[/C][C]0.001036[/C][/ROW]
[ROW][C]5[/C][C]0.3501[/C][C]4.0223[/C][C]4.8e-05[/C][/ROW]
[ROW][C]6[/C][C]0.002804[/C][C]0.0322[/C][C]0.487175[/C][/ROW]
[ROW][C]7[/C][C]0.252486[/C][C]2.9008[/C][C]0.002181[/C][/ROW]
[ROW][C]8[/C][C]0.180102[/C][C]2.0692[/C][C]0.020239[/C][/ROW]
[ROW][C]9[/C][C]0.199906[/C][C]2.2967[/C][C]0.011604[/C][/ROW]
[ROW][C]10[/C][C]0.12845[/C][C]1.4758[/C][C]0.071192[/C][/ROW]
[ROW][C]11[/C][C]-0.040182[/C][C]-0.4617[/C][C]0.322545[/C][/ROW]
[ROW][C]12[/C][C]0.620499[/C][C]7.129[/C][C]0[/C][/ROW]
[ROW][C]13[/C][C]-0.04829[/C][C]-0.5548[/C][C]0.289981[/C][/ROW]
[ROW][C]14[/C][C]0.06789[/C][C]0.78[/C][C]0.218394[/C][/ROW]
[ROW][C]15[/C][C]0.134986[/C][C]1.5509[/C][C]0.061664[/C][/ROW]
[ROW][C]16[/C][C]0.08079[/C][C]0.9282[/C][C]0.177497[/C][/ROW]
[ROW][C]17[/C][C]0.188062[/C][C]2.1607[/C][C]0.016263[/C][/ROW]
[ROW][C]18[/C][C]-0.072673[/C][C]-0.8349[/C][C]0.202628[/C][/ROW]
[ROW][C]19[/C][C]0.096293[/C][C]1.1063[/C][C]0.135301[/C][/ROW]
[ROW][C]20[/C][C]0.089269[/C][C]1.0256[/C][C]0.153474[/C][/ROW]
[ROW][C]21[/C][C]0.079813[/C][C]0.917[/C][C]0.180414[/C][/ROW]
[ROW][C]22[/C][C]0.013318[/C][C]0.153[/C][C]0.439311[/C][/ROW]
[ROW][C]23[/C][C]-0.114927[/C][C]-1.3204[/C][C]0.094491[/C][/ROW]
[ROW][C]24[/C][C]0.419984[/C][C]4.8252[/C][C]2e-06[/C][/ROW]
[ROW][C]25[/C][C]-0.095059[/C][C]-1.0921[/C][C]0.138379[/C][/ROW]
[ROW][C]26[/C][C]-0.010118[/C][C]-0.1163[/C][C]0.453815[/C][/ROW]
[ROW][C]27[/C][C]0.032567[/C][C]0.3742[/C][C]0.35444[/C][/ROW]
[ROW][C]28[/C][C]0.062135[/C][C]0.7139[/C][C]0.238281[/C][/ROW]
[ROW][C]29[/C][C]0.152514[/C][C]1.7523[/C][C]0.041026[/C][/ROW]
[ROW][C]30[/C][C]-0.078141[/C][C]-0.8978[/C][C]0.185472[/C][/ROW]
[ROW][C]31[/C][C]0.089046[/C][C]1.0231[/C][C]0.154074[/C][/ROW]
[ROW][C]32[/C][C]0.105857[/C][C]1.2162[/C][C]0.113038[/C][/ROW]
[ROW][C]33[/C][C]0.096224[/C][C]1.1055[/C][C]0.13547[/C][/ROW]
[ROW][C]34[/C][C]0.01109[/C][C]0.1274[/C][C]0.449404[/C][/ROW]
[ROW][C]35[/C][C]-0.068734[/C][C]-0.7897[/C][C]0.215563[/C][/ROW]
[ROW][C]36[/C][C]0.370307[/C][C]4.2545[/C][C]2e-05[/C][/ROW]
[ROW][C]37[/C][C]-0.069011[/C][C]-0.7929[/C][C]0.214637[/C][/ROW]
[ROW][C]38[/C][C]0.007247[/C][C]0.0833[/C][C]0.466885[/C][/ROW]
[ROW][C]39[/C][C]0.033596[/C][C]0.386[/C][C]0.350063[/C][/ROW]
[ROW][C]40[/C][C]0.07229[/C][C]0.8306[/C][C]0.203863[/C][/ROW]
[ROW][C]41[/C][C]0.113395[/C][C]1.3028[/C][C]0.097453[/C][/ROW]
[ROW][C]42[/C][C]-0.0463[/C][C]-0.5319[/C][C]0.29783[/C][/ROW]
[ROW][C]43[/C][C]0.112045[/C][C]1.2873[/C][C]0.100121[/C][/ROW]
[ROW][C]44[/C][C]0.089136[/C][C]1.0241[/C][C]0.153831[/C][/ROW]
[ROW][C]45[/C][C]0.080517[/C][C]0.9251[/C][C]0.178309[/C][/ROW]
[ROW][C]46[/C][C]0.043389[/C][C]0.4985[/C][C]0.309482[/C][/ROW]
[ROW][C]47[/C][C]-0.047284[/C][C]-0.5433[/C][C]0.293934[/C][/ROW]
[ROW][C]48[/C][C]0.341976[/C][C]3.929[/C][C]6.8e-05[/C][/ROW]
[ROW][C]49[/C][C]-0.054805[/C][C]-0.6297[/C][C]0.265003[/C][/ROW]
[ROW][C]50[/C][C]0.012605[/C][C]0.1448[/C][C]0.442538[/C][/ROW]
[ROW][C]51[/C][C]0.021032[/C][C]0.2416[/C][C]0.404715[/C][/ROW]
[ROW][C]52[/C][C]0.008749[/C][C]0.1005[/C][C]0.460043[/C][/ROW]
[ROW][C]53[/C][C]0.039308[/C][C]0.4516[/C][C]0.326144[/C][/ROW]
[ROW][C]54[/C][C]-0.144463[/C][C]-1.6598[/C][C]0.049669[/C][/ROW]
[ROW][C]55[/C][C]0.000127[/C][C]0.0015[/C][C]0.49942[/C][/ROW]
[ROW][C]56[/C][C]-0.069583[/C][C]-0.7994[/C][C]0.212733[/C][/ROW]
[ROW][C]57[/C][C]-0.052733[/C][C]-0.6059[/C][C]0.272826[/C][/ROW]
[ROW][C]58[/C][C]-0.083677[/C][C]-0.9614[/C][C]0.169062[/C][/ROW]
[ROW][C]59[/C][C]-0.20392[/C][C]-2.3429[/C][C]0.010315[/C][/ROW]
[ROW][C]60[/C][C]0.163614[/C][C]1.8798[/C][C]0.031171[/C][/ROW]
[/TABLE]
Source: https://freestatistics.org/blog/index.php?pk=234274&T=1

Globally Unique Identifier (entire table): ba.freestatistics.org/blog/index.php?pk=234274&T=1

As an alternative you can also use a QR Code:  

The GUIDs for individual cells are displayed in the table below:

Autocorrelation Function
Time lag kACF(k)T-STATP-value
10.1395641.60350.055611
20.2417632.77770.003137
30.3205073.68230.000168
40.2734663.14190.001036
50.35014.02234.8e-05
60.0028040.03220.487175
70.2524862.90080.002181
80.1801022.06920.020239
90.1999062.29670.011604
100.128451.47580.071192
11-0.040182-0.46170.322545
120.6204997.1290
13-0.04829-0.55480.289981
140.067890.780.218394
150.1349861.55090.061664
160.080790.92820.177497
170.1880622.16070.016263
18-0.072673-0.83490.202628
190.0962931.10630.135301
200.0892691.02560.153474
210.0798130.9170.180414
220.0133180.1530.439311
23-0.114927-1.32040.094491
240.4199844.82522e-06
25-0.095059-1.09210.138379
26-0.010118-0.11630.453815
270.0325670.37420.35444
280.0621350.71390.238281
290.1525141.75230.041026
30-0.078141-0.89780.185472
310.0890461.02310.154074
320.1058571.21620.113038
330.0962241.10550.13547
340.011090.12740.449404
35-0.068734-0.78970.215563
360.3703074.25452e-05
37-0.069011-0.79290.214637
380.0072470.08330.466885
390.0335960.3860.350063
400.072290.83060.203863
410.1133951.30280.097453
42-0.0463-0.53190.29783
430.1120451.28730.100121
440.0891361.02410.153831
450.0805170.92510.178309
460.0433890.49850.309482
47-0.047284-0.54330.293934
480.3419763.9296.8e-05
49-0.054805-0.62970.265003
500.0126050.14480.442538
510.0210320.24160.404715
520.0087490.10050.460043
530.0393080.45160.326144
54-0.144463-1.65980.049669
550.0001270.00150.49942
56-0.069583-0.79940.212733
57-0.052733-0.60590.272826
58-0.083677-0.96140.169062
59-0.20392-2.34290.010315
600.1636141.87980.031171


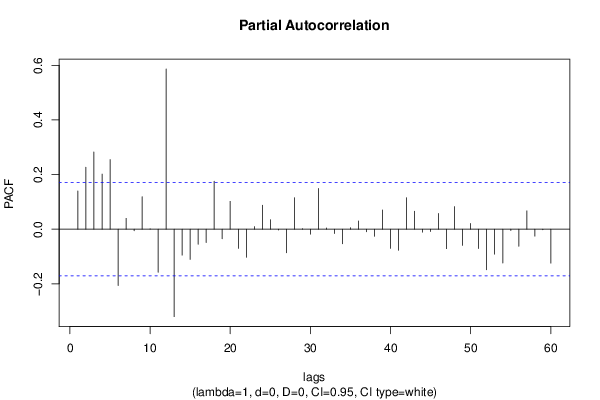
Partial Autocorrelation Function
Time lag kPACF(k)T-STATP-value
10.1395641.60350.055611
20.2267012.60460.005126
30.2825153.24580.000742
40.2015872.31610.011048
50.2547382.92670.002018
6-0.20634-2.37070.009601
70.0396640.45570.324675
8-0.005898-0.06780.47304
90.1188631.36560.087189
10-0.000475-0.00550.497829
11-0.158011-1.81540.035865
120.5867096.74080
13-0.320336-3.68040.000169
14-0.094991-1.09140.138551
15-0.11054-1.270.103159
16-0.055514-0.63780.26235
17-0.048794-0.56060.288009
180.1753922.01510.022962
19-0.035054-0.40270.343897
200.1018991.17070.121907
21-0.070274-0.80740.210449
22-0.102878-1.1820.11967
230.009410.10810.457035
240.0874871.00510.158332
250.0346010.39750.345808
26-0.002931-0.03370.486593
27-0.086328-0.99180.161546
280.1152871.32450.093805
290.0016130.01850.492623
30-0.018241-0.20960.417163
310.1492061.71420.044415
320.0045380.05210.47925
33-0.015927-0.1830.427544
34-0.0532-0.61120.27105
350.005190.05960.476272
360.0301050.34590.36499
37-0.009439-0.10840.456903
38-0.025657-0.29480.384313
390.0704910.80990.209735
40-0.070236-0.80690.210574
41-0.077049-0.88520.188823
420.1148791.31990.094584
430.0654910.75240.226564
44-0.010986-0.12620.449874
45-0.008565-0.09840.460882
460.0573140.65850.255688
47-0.071328-0.81950.20699
480.0825460.94840.172334
49-0.059511-0.68370.247673
500.0205860.23650.406698
51-0.071082-0.81670.207794
52-0.148857-1.71020.044786
53-0.091498-1.05120.147537
54-0.123604-1.42010.078968
55-0.004654-0.05350.478718
56-0.062587-0.71910.236686
570.0669470.76920.221585
58-0.025578-0.29390.384662
59-0.001958-0.02250.491045
60-0.124371-1.42890.077695

\begin{tabular}{lllllllll}
\hline
Partial Autocorrelation Function \tabularnewline
Time lag k & PACF(k) & T-STAT & P-value \tabularnewline
1 & 0.139564 & 1.6035 & 0.055611 \tabularnewline
2 & 0.226701 & 2.6046 & 0.005126 \tabularnewline
3 & 0.282515 & 3.2458 & 0.000742 \tabularnewline
4 & 0.201587 & 2.3161 & 0.011048 \tabularnewline
5 & 0.254738 & 2.9267 & 0.002018 \tabularnewline
6 & -0.20634 & -2.3707 & 0.009601 \tabularnewline
7 & 0.039664 & 0.4557 & 0.324675 \tabularnewline
8 & -0.005898 & -0.0678 & 0.47304 \tabularnewline
9 & 0.118863 & 1.3656 & 0.087189 \tabularnewline
10 & -0.000475 & -0.0055 & 0.497829 \tabularnewline
11 & -0.158011 & -1.8154 & 0.035865 \tabularnewline
12 & 0.586709 & 6.7408 & 0 \tabularnewline
13 & -0.320336 & -3.6804 & 0.000169 \tabularnewline
14 & -0.094991 & -1.0914 & 0.138551 \tabularnewline
15 & -0.11054 & -1.27 & 0.103159 \tabularnewline
16 & -0.055514 & -0.6378 & 0.26235 \tabularnewline
17 & -0.048794 & -0.5606 & 0.288009 \tabularnewline
18 & 0.175392 & 2.0151 & 0.022962 \tabularnewline
19 & -0.035054 & -0.4027 & 0.343897 \tabularnewline
20 & 0.101899 & 1.1707 & 0.121907 \tabularnewline
21 & -0.070274 & -0.8074 & 0.210449 \tabularnewline
22 & -0.102878 & -1.182 & 0.11967 \tabularnewline
23 & 0.00941 & 0.1081 & 0.457035 \tabularnewline
24 & 0.087487 & 1.0051 & 0.158332 \tabularnewline
25 & 0.034601 & 0.3975 & 0.345808 \tabularnewline
26 & -0.002931 & -0.0337 & 0.486593 \tabularnewline
27 & -0.086328 & -0.9918 & 0.161546 \tabularnewline
28 & 0.115287 & 1.3245 & 0.093805 \tabularnewline
29 & 0.001613 & 0.0185 & 0.492623 \tabularnewline
30 & -0.018241 & -0.2096 & 0.417163 \tabularnewline
31 & 0.149206 & 1.7142 & 0.044415 \tabularnewline
32 & 0.004538 & 0.0521 & 0.47925 \tabularnewline
33 & -0.015927 & -0.183 & 0.427544 \tabularnewline
34 & -0.0532 & -0.6112 & 0.27105 \tabularnewline
35 & 0.00519 & 0.0596 & 0.476272 \tabularnewline
36 & 0.030105 & 0.3459 & 0.36499 \tabularnewline
37 & -0.009439 & -0.1084 & 0.456903 \tabularnewline
38 & -0.025657 & -0.2948 & 0.384313 \tabularnewline
39 & 0.070491 & 0.8099 & 0.209735 \tabularnewline
40 & -0.070236 & -0.8069 & 0.210574 \tabularnewline
41 & -0.077049 & -0.8852 & 0.188823 \tabularnewline
42 & 0.114879 & 1.3199 & 0.094584 \tabularnewline
43 & 0.065491 & 0.7524 & 0.226564 \tabularnewline
44 & -0.010986 & -0.1262 & 0.449874 \tabularnewline
45 & -0.008565 & -0.0984 & 0.460882 \tabularnewline
46 & 0.057314 & 0.6585 & 0.255688 \tabularnewline
47 & -0.071328 & -0.8195 & 0.20699 \tabularnewline
48 & 0.082546 & 0.9484 & 0.172334 \tabularnewline
49 & -0.059511 & -0.6837 & 0.247673 \tabularnewline
50 & 0.020586 & 0.2365 & 0.406698 \tabularnewline
51 & -0.071082 & -0.8167 & 0.207794 \tabularnewline
52 & -0.148857 & -1.7102 & 0.044786 \tabularnewline
53 & -0.091498 & -1.0512 & 0.147537 \tabularnewline
54 & -0.123604 & -1.4201 & 0.078968 \tabularnewline
55 & -0.004654 & -0.0535 & 0.478718 \tabularnewline
56 & -0.062587 & -0.7191 & 0.236686 \tabularnewline
57 & 0.066947 & 0.7692 & 0.221585 \tabularnewline
58 & -0.025578 & -0.2939 & 0.384662 \tabularnewline
59 & -0.001958 & -0.0225 & 0.491045 \tabularnewline
60 & -0.124371 & -1.4289 & 0.077695 \tabularnewline
\hline
\end{tabular}
%Source: https://freestatistics.org/blog/index.php?pk=234274&T=2

[TABLE]
[ROW][C]Partial Autocorrelation Function[/C][/ROW]
[ROW][C]Time lag k[/C][C]PACF(k)[/C][C]T-STAT[/C][C]P-value[/C][/ROW]
[ROW][C]1[/C][C]0.139564[/C][C]1.6035[/C][C]0.055611[/C][/ROW]
[ROW][C]2[/C][C]0.226701[/C][C]2.6046[/C][C]0.005126[/C][/ROW]
[ROW][C]3[/C][C]0.282515[/C][C]3.2458[/C][C]0.000742[/C][/ROW]
[ROW][C]4[/C][C]0.201587[/C][C]2.3161[/C][C]0.011048[/C][/ROW]
[ROW][C]5[/C][C]0.254738[/C][C]2.9267[/C][C]0.002018[/C][/ROW]
[ROW][C]6[/C][C]-0.20634[/C][C]-2.3707[/C][C]0.009601[/C][/ROW]
[ROW][C]7[/C][C]0.039664[/C][C]0.4557[/C][C]0.324675[/C][/ROW]
[ROW][C]8[/C][C]-0.005898[/C][C]-0.0678[/C][C]0.47304[/C][/ROW]
[ROW][C]9[/C][C]0.118863[/C][C]1.3656[/C][C]0.087189[/C][/ROW]
[ROW][C]10[/C][C]-0.000475[/C][C]-0.0055[/C][C]0.497829[/C][/ROW]
[ROW][C]11[/C][C]-0.158011[/C][C]-1.8154[/C][C]0.035865[/C][/ROW]
[ROW][C]12[/C][C]0.586709[/C][C]6.7408[/C][C]0[/C][/ROW]
[ROW][C]13[/C][C]-0.320336[/C][C]-3.6804[/C][C]0.000169[/C][/ROW]
[ROW][C]14[/C][C]-0.094991[/C][C]-1.0914[/C][C]0.138551[/C][/ROW]
[ROW][C]15[/C][C]-0.11054[/C][C]-1.27[/C][C]0.103159[/C][/ROW]
[ROW][C]16[/C][C]-0.055514[/C][C]-0.6378[/C][C]0.26235[/C][/ROW]
[ROW][C]17[/C][C]-0.048794[/C][C]-0.5606[/C][C]0.288009[/C][/ROW]
[ROW][C]18[/C][C]0.175392[/C][C]2.0151[/C][C]0.022962[/C][/ROW]
[ROW][C]19[/C][C]-0.035054[/C][C]-0.4027[/C][C]0.343897[/C][/ROW]
[ROW][C]20[/C][C]0.101899[/C][C]1.1707[/C][C]0.121907[/C][/ROW]
[ROW][C]21[/C][C]-0.070274[/C][C]-0.8074[/C][C]0.210449[/C][/ROW]
[ROW][C]22[/C][C]-0.102878[/C][C]-1.182[/C][C]0.11967[/C][/ROW]
[ROW][C]23[/C][C]0.00941[/C][C]0.1081[/C][C]0.457035[/C][/ROW]
[ROW][C]24[/C][C]0.087487[/C][C]1.0051[/C][C]0.158332[/C][/ROW]
[ROW][C]25[/C][C]0.034601[/C][C]0.3975[/C][C]0.345808[/C][/ROW]
[ROW][C]26[/C][C]-0.002931[/C][C]-0.0337[/C][C]0.486593[/C][/ROW]
[ROW][C]27[/C][C]-0.086328[/C][C]-0.9918[/C][C]0.161546[/C][/ROW]
[ROW][C]28[/C][C]0.115287[/C][C]1.3245[/C][C]0.093805[/C][/ROW]
[ROW][C]29[/C][C]0.001613[/C][C]0.0185[/C][C]0.492623[/C][/ROW]
[ROW][C]30[/C][C]-0.018241[/C][C]-0.2096[/C][C]0.417163[/C][/ROW]
[ROW][C]31[/C][C]0.149206[/C][C]1.7142[/C][C]0.044415[/C][/ROW]
[ROW][C]32[/C][C]0.004538[/C][C]0.0521[/C][C]0.47925[/C][/ROW]
[ROW][C]33[/C][C]-0.015927[/C][C]-0.183[/C][C]0.427544[/C][/ROW]
[ROW][C]34[/C][C]-0.0532[/C][C]-0.6112[/C][C]0.27105[/C][/ROW]
[ROW][C]35[/C][C]0.00519[/C][C]0.0596[/C][C]0.476272[/C][/ROW]
[ROW][C]36[/C][C]0.030105[/C][C]0.3459[/C][C]0.36499[/C][/ROW]
[ROW][C]37[/C][C]-0.009439[/C][C]-0.1084[/C][C]0.456903[/C][/ROW]
[ROW][C]38[/C][C]-0.025657[/C][C]-0.2948[/C][C]0.384313[/C][/ROW]
[ROW][C]39[/C][C]0.070491[/C][C]0.8099[/C][C]0.209735[/C][/ROW]
[ROW][C]40[/C][C]-0.070236[/C][C]-0.8069[/C][C]0.210574[/C][/ROW]
[ROW][C]41[/C][C]-0.077049[/C][C]-0.8852[/C][C]0.188823[/C][/ROW]
[ROW][C]42[/C][C]0.114879[/C][C]1.3199[/C][C]0.094584[/C][/ROW]
[ROW][C]43[/C][C]0.065491[/C][C]0.7524[/C][C]0.226564[/C][/ROW]
[ROW][C]44[/C][C]-0.010986[/C][C]-0.1262[/C][C]0.449874[/C][/ROW]
[ROW][C]45[/C][C]-0.008565[/C][C]-0.0984[/C][C]0.460882[/C][/ROW]
[ROW][C]46[/C][C]0.057314[/C][C]0.6585[/C][C]0.255688[/C][/ROW]
[ROW][C]47[/C][C]-0.071328[/C][C]-0.8195[/C][C]0.20699[/C][/ROW]
[ROW][C]48[/C][C]0.082546[/C][C]0.9484[/C][C]0.172334[/C][/ROW]
[ROW][C]49[/C][C]-0.059511[/C][C]-0.6837[/C][C]0.247673[/C][/ROW]
[ROW][C]50[/C][C]0.020586[/C][C]0.2365[/C][C]0.406698[/C][/ROW]
[ROW][C]51[/C][C]-0.071082[/C][C]-0.8167[/C][C]0.207794[/C][/ROW]
[ROW][C]52[/C][C]-0.148857[/C][C]-1.7102[/C][C]0.044786[/C][/ROW]
[ROW][C]53[/C][C]-0.091498[/C][C]-1.0512[/C][C]0.147537[/C][/ROW]
[ROW][C]54[/C][C]-0.123604[/C][C]-1.4201[/C][C]0.078968[/C][/ROW]
[ROW][C]55[/C][C]-0.004654[/C][C]-0.0535[/C][C]0.478718[/C][/ROW]
[ROW][C]56[/C][C]-0.062587[/C][C]-0.7191[/C][C]0.236686[/C][/ROW]
[ROW][C]57[/C][C]0.066947[/C][C]0.7692[/C][C]0.221585[/C][/ROW]
[ROW][C]58[/C][C]-0.025578[/C][C]-0.2939[/C][C]0.384662[/C][/ROW]
[ROW][C]59[/C][C]-0.001958[/C][C]-0.0225[/C][C]0.491045[/C][/ROW]
[ROW][C]60[/C][C]-0.124371[/C][C]-1.4289[/C][C]0.077695[/C][/ROW]
[/TABLE]
Source: https://freestatistics.org/blog/index.php?pk=234274&T=2

Globally Unique Identifier (entire table): ba.freestatistics.org/blog/index.php?pk=234274&T=2

As an alternative you can also use a QR Code:  

The GUIDs for individual cells are displayed in the table below:

Partial Autocorrelation Function
Time lag kPACF(k)T-STATP-value
10.1395641.60350.055611
20.2267012.60460.005126
30.2825153.24580.000742
40.2015872.31610.011048
50.2547382.92670.002018
6-0.20634-2.37070.009601
70.0396640.45570.324675
8-0.005898-0.06780.47304
90.1188631.36560.087189
10-0.000475-0.00550.497829
11-0.158011-1.81540.035865
120.5867096.74080
13-0.320336-3.68040.000169
14-0.094991-1.09140.138551
15-0.11054-1.270.103159
16-0.055514-0.63780.26235
17-0.048794-0.56060.288009
180.1753922.01510.022962
19-0.035054-0.40270.343897
200.1018991.17070.121907
21-0.070274-0.80740.210449
22-0.102878-1.1820.11967
230.009410.10810.457035
240.0874871.00510.158332
250.0346010.39750.345808
26-0.002931-0.03370.486593
27-0.086328-0.99180.161546
280.1152871.32450.093805
290.0016130.01850.492623
30-0.018241-0.20960.417163
310.1492061.71420.044415
320.0045380.05210.47925
33-0.015927-0.1830.427544
34-0.0532-0.61120.27105
350.005190.05960.476272
360.0301050.34590.36499
37-0.009439-0.10840.456903
38-0.025657-0.29480.384313
390.0704910.80990.209735
40-0.070236-0.80690.210574
41-0.077049-0.88520.188823
420.1148791.31990.094584
430.0654910.75240.226564
44-0.010986-0.12620.449874
45-0.008565-0.09840.460882
460.0573140.65850.255688
47-0.071328-0.81950.20699
480.0825460.94840.172334
49-0.059511-0.68370.247673
500.0205860.23650.406698
51-0.071082-0.81670.207794
52-0.148857-1.71020.044786
53-0.091498-1.05120.147537
54-0.123604-1.42010.078968
55-0.004654-0.05350.478718
56-0.062587-0.71910.236686
570.0669470.76920.221585
58-0.025578-0.29390.384662
59-0.001958-0.02250.491045
60-0.124371-1.42890.077695


Parameters (Session):
par1 = 60 ; par2 = 1 ; par3 = 0 ; par4 = 0 ; par5 = 12 ; par6 = White Noise ; par7 = 0.95 ;
Parameters (R input):
par1 = 60 ; par2 = 1 ; par3 = 0 ; par4 = 0 ; par5 = 12 ; par6 = White Noise ; par7 = 0.95 ; par8 = ;
R code (references can be found in the software module):
if (par1 == 'Default') {
par1 = 10*log10(length(x))
} else {
par1 <- as.numeric(par1)
}
par2 <- as.numeric(par2)
par3 <- as.numeric(par3)
par4 <- as.numeric(par4)
par5 <- as.numeric(par5)
if (par6 == 'White Noise') par6 <- 'white' else par6 <- 'ma'
par7 <- as.numeric(par7)
if (par8 != '') par8 <- as.numeric(par8)
ox <- x
if (par8 == '') {
if (par2 == 0) {
x <- log(x)
} else {
x <- (x ^ par2 - 1) / par2
}
} else {
x <- log(x,base=par8)
}
if (par3 > 0) x <- diff(x,lag=1,difference=par3)
if (par4 > 0) x <- diff(x,lag=par5,difference=par4)
bitmap(file='picts.png')
op <- par(mfrow=c(2,1))
plot(ox,type='l',main='Original Time Series',xlab='time',ylab='value')
if (par8=='') {
mytitle <- paste('Working Time Series (lambda=',par2,', d=',par3,', D=',par4,')',sep='')
mysub <- paste('(lambda=',par2,', d=',par3,', D=',par4,', CI=', par7, ', CI type=',par6,')',sep='')
} else {
mytitle <- paste('Working Time Series (base=',par8,', d=',par3,', D=',par4,')',sep='')
mysub <- paste('(base=',par8,', d=',par3,', D=',par4,', CI=', par7, ', CI type=',par6,')',sep='')
}
plot(x,type='l', main=mytitle,xlab='time',ylab='value')
par(op)
dev.off()
bitmap(file='pic1.png')
racf <- acf(x, par1, main='Autocorrelation', xlab='time lag', ylab='ACF', ci.type=par6, ci=par7, sub=mysub)
dev.off()
bitmap(file='pic2.png')
rpacf <- pacf(x,par1,main='Partial Autocorrelation',xlab='lags',ylab='PACF',sub=mysub)
dev.off()
(myacf <- c(racf$acf))
(mypacf <- c(rpacf$acf))
lengthx <- length(x)
sqrtn <- sqrt(lengthx)
load(file='createtable')
a<-table.start()
a<-table.row.start(a)
a<-table.element(a,'Autocorrelation Function',4,TRUE)
a<-table.row.end(a)
a<-table.row.start(a)
a<-table.element(a,'Time lag k',header=TRUE)
a<-table.element(a,hyperlink('basics.htm','ACF(k)','click here for more information about the Autocorrelation Function'),header=TRUE)
a<-table.element(a,'T-STAT',header=TRUE)
a<-table.element(a,'P-value',header=TRUE)
a<-table.row.end(a)
for (i in 2:(par1+1)) {
a<-table.row.start(a)
a<-table.element(a,i-1,header=TRUE)
a<-table.element(a,round(myacf[i],6))
mytstat <- myacf[i]*sqrtn
a<-table.element(a,round(mytstat,4))
a<-table.element(a,round(1-pt(abs(mytstat),lengthx),6))
a<-table.row.end(a)
}
a<-table.end(a)
table.save(a,file='mytable.tab')
a<-table.start()
a<-table.row.start(a)
a<-table.element(a,'Partial Autocorrelation Function',4,TRUE)
a<-table.row.end(a)
a<-table.row.start(a)
a<-table.element(a,'Time lag k',header=TRUE)
a<-table.element(a,hyperlink('basics.htm','PACF(k)','click here for more information about the Partial Autocorrelation Function'),header=TRUE)
a<-table.element(a,'T-STAT',header=TRUE)
a<-table.element(a,'P-value',header=TRUE)
a<-table.row.end(a)
for (i in 1:par1) {
a<-table.row.start(a)
a<-table.element(a,i,header=TRUE)
a<-table.element(a,round(mypacf[i],6))
mytstat <- mypacf[i]*sqrtn
a<-table.element(a,round(mytstat,4))
a<-table.element(a,round(1-pt(abs(mytstat),lengthx),6))
a<-table.row.end(a)
}
a<-table.end(a)
table.save(a,file='mytable1.tab')