Free Statistics

of Irreproducible Research!

Author's title

Author*Unverified author*
R Software Modulerwasp_bootstrapplot.wasp
Title produced by softwareBlocked Bootstrap Plot - Central Tendency
Date of computationThu, 13 Nov 2014 14:08:24 +0000
Cite this page as followsStatistical Computations at FreeStatistics.org, Office for Research Development and Education, URL https://freestatistics.org/blog/index.php?v=date/2014/Nov/13/t1415887720smlty3kcpvjxpjc.htm/, Retrieved Sun, 19 May 2024 06:43:09 +0000
Statistical Computations at FreeStatistics.org, Office for Research Development and Education, URL https://freestatistics.org/blog/index.php?pk=254385, Retrieved Sun, 19 May 2024 06:43:09 +0000
QR Codes:

Original text written by user:
IsPrivate?No (this computation is public)
User-defined keywords
Estimated Impact57
Family? (F = Feedback message, R = changed R code, M = changed R Module, P = changed Parameters, D = changed Data)
-       [Blocked Bootstrap Plot - Central Tendency] [] [2014-11-13 14:08:24] [959220cfe8d8b51f3b8cc01ba011fecd] [Current]
Feedback Forum

Post a new message
Dataseries X:
123
146
156
127
128
147
128
139
130
118
147
98
141
138
130
145
123
116
90
110
102
109
111
93
120
81
84
87
110
90
108
101
87
118
82
86
103
93
83
91
69
95
96
105
121
101
111
130
134
161
186
244
145
170
164
124
154
126
173
140
142
129
171
107
98
185
142
135
126
126
134
119
134
133
129
96
150
113
99
164
127
148
166
115
199
141
149
131
171
178
181
129
112
186
153
116
190
169
165
160
202
155
257
171
168
202
189
132


Summary of computational transaction
Raw Inputview raw input (R code)
Raw Outputview raw output of R engine
Computing time3 seconds
R Server'Gwilym Jenkins' @ jenkins.wessa.net

\begin{tabular}{lllllllll}
\hline
Summary of computational transaction \tabularnewline
Raw Input & view raw input (R code)  \tabularnewline
Raw Output & view raw output of R engine  \tabularnewline
Computing time & 3 seconds \tabularnewline
R Server & 'Gwilym Jenkins' @ jenkins.wessa.net \tabularnewline
\hline
\end{tabular}
%Source: https://freestatistics.org/blog/index.php?pk=254385&T=0

[TABLE]
[ROW][C]Summary of computational transaction[/C][/ROW]
[ROW][C]Raw Input[/C][C]view raw input (R code) [/C][/ROW]
[ROW][C]Raw Output[/C][C]view raw output of R engine [/C][/ROW]
[ROW][C]Computing time[/C][C]3 seconds[/C][/ROW]
[ROW][C]R Server[/C][C]'Gwilym Jenkins' @ jenkins.wessa.net[/C][/ROW]
[/TABLE]
Source: https://freestatistics.org/blog/index.php?pk=254385&T=0

Globally Unique Identifier (entire table): ba.freestatistics.org/blog/index.php?pk=254385&T=0

As an alternative you can also use a QR Code:  

The GUIDs for individual cells are displayed in the table below:

Summary of computational transaction
Raw Inputview raw input (R code)
Raw Outputview raw output of R engine
Computing time3 seconds
R Server'Gwilym Jenkins' @ jenkins.wessa.net


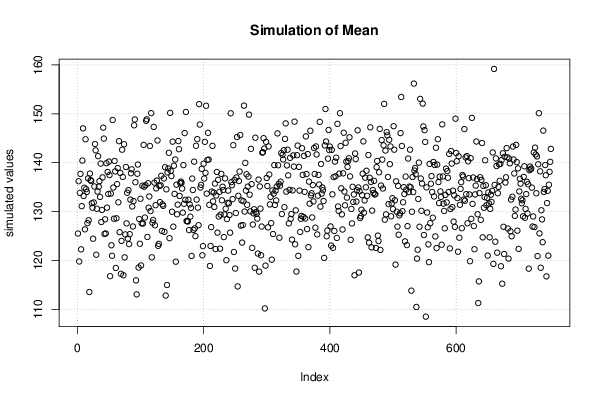
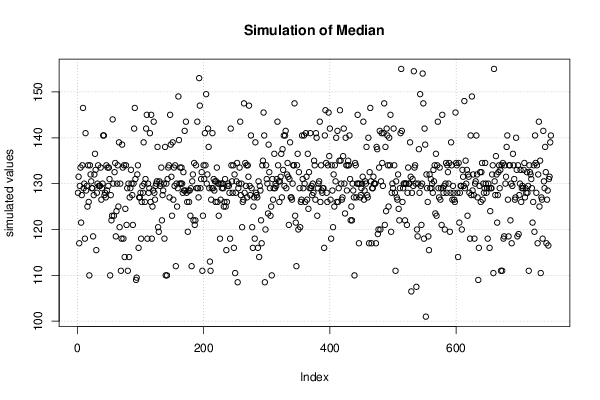
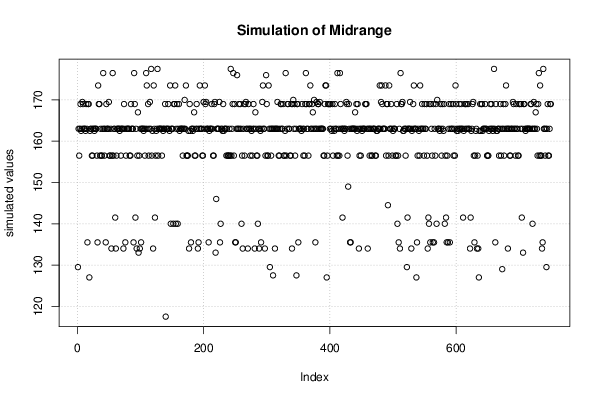
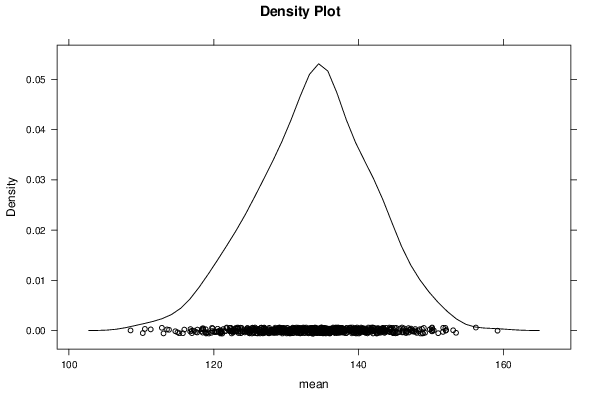
Estimation Results of Blocked Bootstrap
statisticQ1EstimateQ3S.D.IQR
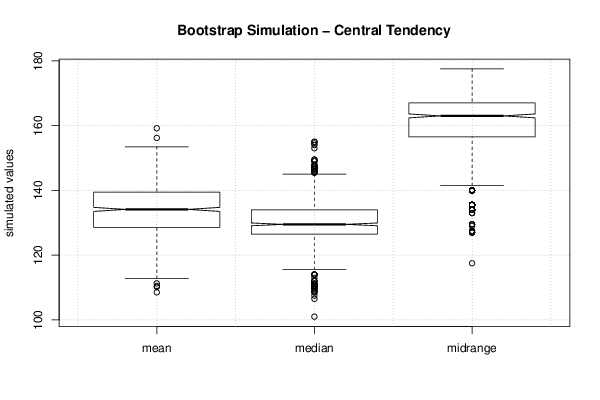
mean128.594907407407133.907407407407139.4282407407418.0544974023121110.8333333333334
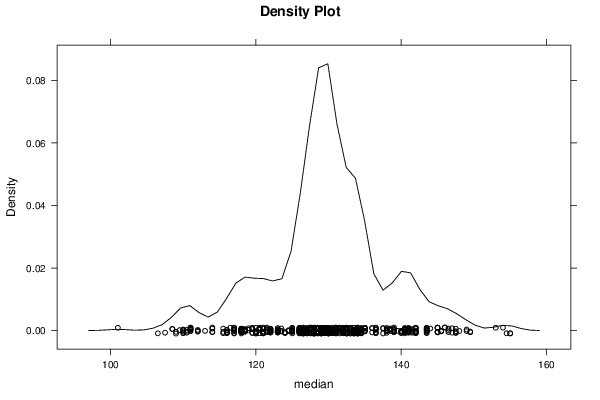
median126.5129.51347.950158378708637.5
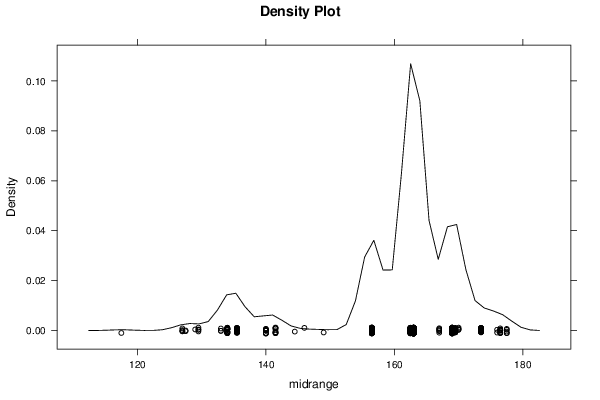
midrange156.516316610.53262538955969.5

\begin{tabular}{lllllllll}
\hline
Estimation Results of Blocked Bootstrap \tabularnewline
statistic & Q1 & Estimate & Q3 & S.D. & IQR \tabularnewline
mean & 128.594907407407 & 133.907407407407 & 139.428240740741 & 8.05449740231211 & 10.8333333333334 \tabularnewline
median & 126.5 & 129.5 & 134 & 7.95015837870863 & 7.5 \tabularnewline
midrange & 156.5 & 163 & 166 & 10.5326253895596 & 9.5 \tabularnewline
\hline
\end{tabular}
%Source: https://freestatistics.org/blog/index.php?pk=254385&T=1

[TABLE]
[ROW][C]Estimation Results of Blocked Bootstrap[/C][/ROW]
[ROW][C]statistic[/C][C]Q1[/C][C]Estimate[/C][C]Q3[/C][C]S.D.[/C][C]IQR[/C][/ROW]
[ROW][C]mean[/C][C]128.594907407407[/C][C]133.907407407407[/C][C]139.428240740741[/C][C]8.05449740231211[/C][C]10.8333333333334[/C][/ROW]
[ROW][C]median[/C][C]126.5[/C][C]129.5[/C][C]134[/C][C]7.95015837870863[/C][C]7.5[/C][/ROW]
[ROW][C]midrange[/C][C]156.5[/C][C]163[/C][C]166[/C][C]10.5326253895596[/C][C]9.5[/C][/ROW]
[/TABLE]
Source: https://freestatistics.org/blog/index.php?pk=254385&T=1

Globally Unique Identifier (entire table): ba.freestatistics.org/blog/index.php?pk=254385&T=1

As an alternative you can also use a QR Code:  

The GUIDs for individual cells are displayed in the table below:

Estimation Results of Blocked Bootstrap
statisticQ1EstimateQ3S.D.IQR
mean128.594907407407133.907407407407139.4282407407418.0544974023121110.8333333333334
median126.5129.51347.950158378708637.5
midrange156.516316610.53262538955969.5


Parameters (Session):
par1 = 750 ; par2 = 12 ;
Parameters (R input):
par1 = 750 ; par2 = 12 ;
R code (references can be found in the software module):
par2 <- '12'
par1 <- '200'
par1 <- as.numeric(par1)
par2 <- as.numeric(par2)
if (par1 < 10) par1 = 10
if (par1 > 5000) par1 = 5000
if (par2 < 3) par2 = 3
if (par2 > length(x)) par2 = length(x)
library(lattice)
library(boot)
boot.stat <- function(s)
{
s.mean <- mean(s)
s.median <- median(s)
s.midrange <- (max(s) + min(s)) / 2
c(s.mean, s.median, s.midrange)
}
(r <- tsboot(x, boot.stat, R=par1, l=12, sim='fixed'))
bitmap(file='plot1.png')
plot(r$t[,1],type='p',ylab='simulated values',main='Simulation of Mean')
grid()
dev.off()
bitmap(file='plot2.png')
plot(r$t[,2],type='p',ylab='simulated values',main='Simulation of Median')
grid()
dev.off()
bitmap(file='plot3.png')
plot(r$t[,3],type='p',ylab='simulated values',main='Simulation of Midrange')
grid()
dev.off()
bitmap(file='plot4.png')
densityplot(~r$t[,1],col='black',main='Density Plot',xlab='mean')
dev.off()
bitmap(file='plot5.png')
densityplot(~r$t[,2],col='black',main='Density Plot',xlab='median')
dev.off()
bitmap(file='plot6.png')
densityplot(~r$t[,3],col='black',main='Density Plot',xlab='midrange')
dev.off()
z <- data.frame(cbind(r$t[,1],r$t[,2],r$t[,3]))
colnames(z) <- list('mean','median','midrange')
bitmap(file='plot7.png')
boxplot(z,notch=TRUE,ylab='simulated values',main='Bootstrap Simulation - Central Tendency')
grid()
dev.off()
load(file='createtable')
a<-table.start()
a<-table.row.start(a)
a<-table.element(a,'Estimation Results of Blocked Bootstrap',6,TRUE)
a<-table.row.end(a)
a<-table.row.start(a)
a<-table.element(a,'statistic',header=TRUE)
a<-table.element(a,'Q1',header=TRUE)
a<-table.element(a,'Estimate',header=TRUE)
a<-table.element(a,'Q3',header=TRUE)
a<-table.element(a,'S.D.',header=TRUE)
a<-table.element(a,'IQR',header=TRUE)
a<-table.row.end(a)
a<-table.row.start(a)
a<-table.element(a,'mean',header=TRUE)
q1 <- quantile(r$t[,1],0.25)[[1]]
q3 <- quantile(r$t[,1],0.75)[[1]]
a<-table.element(a,q1)
a<-table.element(a,r$t0[1])
a<-table.element(a,q3)
a<-table.element(a,sqrt(var(r$t[,1])))
a<-table.element(a,q3-q1)
a<-table.row.end(a)
a<-table.row.start(a)
a<-table.element(a,'median',header=TRUE)
q1 <- quantile(r$t[,2],0.25)[[1]]
q3 <- quantile(r$t[,2],0.75)[[1]]
a<-table.element(a,q1)
a<-table.element(a,r$t0[2])
a<-table.element(a,q3)
a<-table.element(a,sqrt(var(r$t[,2])))
a<-table.element(a,q3-q1)
a<-table.row.end(a)
a<-table.row.start(a)
a<-table.element(a,'midrange',header=TRUE)
q1 <- quantile(r$t[,3],0.25)[[1]]
q3 <- quantile(r$t[,3],0.75)[[1]]
a<-table.element(a,q1)
a<-table.element(a,r$t0[3])
a<-table.element(a,q3)
a<-table.element(a,sqrt(var(r$t[,3])))
a<-table.element(a,q3-q1)
a<-table.row.end(a)
a<-table.end(a)
table.save(a,file='mytable.tab')