Free Statistics
of Irreproducible Research!
Description of Statistical Computation | |||||||||||||||||||||||||||||||||||||||||
|---|---|---|---|---|---|---|---|---|---|---|---|---|---|---|---|---|---|---|---|---|---|---|---|---|---|---|---|---|---|---|---|---|---|---|---|---|---|---|---|---|---|
| Author's title | |||||||||||||||||||||||||||||||||||||||||
| Author | *Unverified author* | ||||||||||||||||||||||||||||||||||||||||
| R Software Module | rwasp_univariatedataseries.wasp | ||||||||||||||||||||||||||||||||||||||||
| Title produced by software | Univariate Data Series | ||||||||||||||||||||||||||||||||||||||||
| Date of computation | Tue, 04 Aug 2015 11:00:09 +0100 | ||||||||||||||||||||||||||||||||||||||||
| Cite this page as follows | Statistical Computations at FreeStatistics.org, Office for Research Development and Education, URL https://freestatistics.org/blog/index.php?v=date/2015/Aug/04/t14386825607tfbkp2icjgktmk.htm/, Retrieved Tue, 01 Jul 2025 23:30:32 +0000 | ||||||||||||||||||||||||||||||||||||||||
| Statistical Computations at FreeStatistics.org, Office for Research Development and Education, URL https://freestatistics.org/blog/index.php?pk=279842, Retrieved Tue, 01 Jul 2025 23:30:32 +0000 | |||||||||||||||||||||||||||||||||||||||||
| QR Codes: | |||||||||||||||||||||||||||||||||||||||||
|
| |||||||||||||||||||||||||||||||||||||||||
| Original text written by user: | |||||||||||||||||||||||||||||||||||||||||
| IsPrivate? | No (this computation is public) | ||||||||||||||||||||||||||||||||||||||||
| User-defined keywords | |||||||||||||||||||||||||||||||||||||||||
| Estimated Impact | 237 | ||||||||||||||||||||||||||||||||||||||||
Tree of Dependent Computations | |||||||||||||||||||||||||||||||||||||||||
| Family? (F = Feedback message, R = changed R code, M = changed R Module, P = changed Parameters, D = changed Data) | |||||||||||||||||||||||||||||||||||||||||
| - [Univariate Data Series] [] [2015-08-04 10:00:09] [d41d8cd98f00b204e9800998ecf8427e] [Current] | |||||||||||||||||||||||||||||||||||||||||
| Feedback Forum | |||||||||||||||||||||||||||||||||||||||||
Post a new message | |||||||||||||||||||||||||||||||||||||||||
Dataset | |||||||||||||||||||||||||||||||||||||||||
| Dataseries X: | |||||||||||||||||||||||||||||||||||||||||
5947968.00 5925816.00 5903352.00 5856864.00 6316752.00 6292416.00 5947968.00 5718960.00 5741112.00 5741112.00 5765760.00 5810064.00 5879016.00 5879016.00 5834712.00 5718960.00 6316752.00 6407856.00 6270264.00 5947968.00 6085872.00 5879016.00 5972304.00 6016920.00 6063408.00 5947968.00 5972304.00 5810064.00 6316752.00 6476808.00 6339216.00 6085872.00 6361368.00 6063408.00 6339216.00 6316752.00 6385704.00 6132360.00 6407856.00 6385704.00 6799104.00 6705816.00 6339216.00 6154512.00 6407856.00 6063408.00 6316752.00 6361368.00 6454656.00 6248112.00 6361368.00 6430320.00 6683664.00 6476808.00 6201312.00 5903352.00 6179160.00 5421000.00 5787912.00 5994456.00 6201312.00 5903352.00 5903352.00 5903352.00 6063408.00 5834712.00 5534568.00 5283408.00 5465616.00 4754256.00 5190120.00 5443464.00 5489952.00 5236608.00 5258760.00 5190120.00 5421000.00 5258760.00 4938960.00 4707768.00 5098704.00 4249752.00 4801056.00 5052216.00 5052216.00 4754256.00 4478760.00 4456608.00 4707768.00 4478760.00 4043208.00 3743064.00 4065360.00 3307512.00 3996408.00 4363008.00 4478760.00 4225416.00 3905304.00 4134312.00 4225416.00 4156464.00 3467256.00 3147456.00 3376152.00 2687256.00 3398616.00 3651960.00 3858504.00 3514056.00 3191760.00 3376152.00 3467256.00 3285048.00 2596152.00 2296008.00 2571504.00 1813656.00 2640456.00 3147456.00 | |||||||||||||||||||||||||||||||||||||||||
Tables (Output of Computation) | |||||||||||||||||||||||||||||||||||||||||
| |||||||||||||||||||||||||||||||||||||||||
Figures (Output of Computation) | |||||||||||||||||||||||||||||||||||||||||
Input Parameters & R Code | |||||||||||||||||||||||||||||||||||||||||
| Parameters (Session): | |||||||||||||||||||||||||||||||||||||||||
| par4 = 12 ; | |||||||||||||||||||||||||||||||||||||||||
| Parameters (R input): | |||||||||||||||||||||||||||||||||||||||||
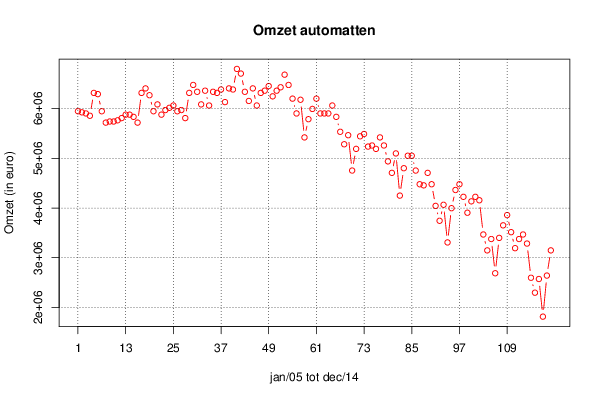
| par1 = Omzet automatten ; par2 = Niet gekend ; par3 = De data van de reeks bevat de omzet van uit de verkoop van het product �automatten� per maand weergegeven. Dit van januari 2005 t.e.m. december 2014. ; par4 = 12 ; | |||||||||||||||||||||||||||||||||||||||||
| R code (references can be found in the software module): | |||||||||||||||||||||||||||||||||||||||||
par4 <- '12' | |||||||||||||||||||||||||||||||||||||||||