Free Statistics

of Irreproducible Research!

Author's title

Author*Unverified author*
R Software Modulerwasp_smp.wasp
Title produced by softwareStandard Deviation-Mean Plot
Date of computationSat, 08 Aug 2015 15:55:04 +0100
Cite this page as followsStatistical Computations at FreeStatistics.org, Office for Research Development and Education, URL https://freestatistics.org/blog/index.php?v=date/2015/Aug/08/t1439045906fbwlwr94ocr07nb.htm/, Retrieved Wed, 15 May 2024 01:01:22 +0000
Statistical Computations at FreeStatistics.org, Office for Research Development and Education, URL https://freestatistics.org/blog/index.php?pk=279949, Retrieved Wed, 15 May 2024 01:01:22 +0000
QR Codes:

Original text written by user:
IsPrivate?No (this computation is public)
User-defined keywords
Estimated Impact128
Family? (F = Feedback message, R = changed R code, M = changed R Module, P = changed Parameters, D = changed Data)
-       [Standard Deviation-Mean Plot] [] [2015-08-08 14:55:04] [70e23d918d09c907c02097a361cd6415] [Current]
Feedback Forum

Post a new message
Dataseries X:
59400
57200
60500
48400
62700
61600
66000
68200
75900
66000
62700
78100
66000
49500
58300
44000
61600
50600
67100
60500
63800
71500
70400
83600
60500
50600
56100
40700
58300
45100
63800
60500
53900
77000
69300
79200
59400
55000
49500
40700
53900
48400
66000
63800
55000
73700
68200
88000
70400
42900
42900
42900
50600
50600
68200
62700
56100
70400
64900
93500
73700
42900
45100
37400
51700
59400
74800
73700
59400
69300
61600
88000
67100
53900
48400
36300
53900
64900
75900
71500
52800
75900
59400
91300
75900
55000
50600
34100
53900
51700
78100
78100
59400
77000
57200
89100
75900
56100
42900
29700
58300
56100
73700
84700
62700
70400
52800
91300


Summary of computational transaction
Raw Inputview raw input (R code)
Raw Outputview raw output of R engine
Computing time1 seconds
R Server'Sir Maurice George Kendall' @ kendall.wessa.net

\begin{tabular}{lllllllll}
\hline
Summary of computational transaction \tabularnewline
Raw Input & view raw input (R code)  \tabularnewline
Raw Output & view raw output of R engine  \tabularnewline
Computing time & 1 seconds \tabularnewline
R Server & 'Sir Maurice George Kendall' @ kendall.wessa.net \tabularnewline
\hline
\end{tabular}
%Source: https://freestatistics.org/blog/index.php?pk=279949&T=0

[TABLE]
[ROW][C]Summary of computational transaction[/C][/ROW]
[ROW][C]Raw Input[/C][C]view raw input (R code) [/C][/ROW]
[ROW][C]Raw Output[/C][C]view raw output of R engine [/C][/ROW]
[ROW][C]Computing time[/C][C]1 seconds[/C][/ROW]
[ROW][C]R Server[/C][C]'Sir Maurice George Kendall' @ kendall.wessa.net[/C][/ROW]
[/TABLE]
Source: https://freestatistics.org/blog/index.php?pk=279949&T=0

Globally Unique Identifier (entire table): ba.freestatistics.org/blog/index.php?pk=279949&T=0

As an alternative you can also use a QR Code:  

The GUIDs for individual cells are displayed in the table below:

Summary of computational transaction
Raw Inputview raw input (R code)
Raw Outputview raw output of R engine
Computing time1 seconds
R Server'Sir Maurice George Kendall' @ kendall.wessa.net


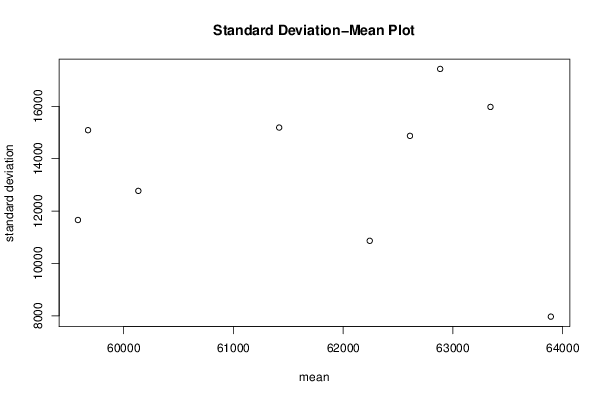
Standard Deviation-Mean Plot
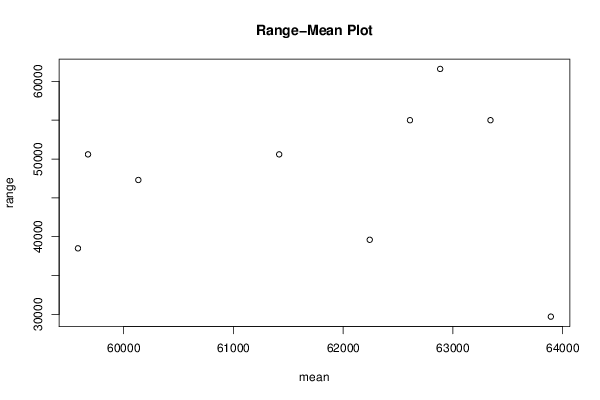
SectionMeanStandard DeviationRange
163891.66666666677966.2308109502729700
262241.666666666710863.739380771939600
359583.333333333311658.616270095438500
460133.333333333312770.800027145347300
55967515090.642796117150600
661416.666666666715190.238093372150600
762608.333333333314872.821969395555000
863341.666666666715978.136103229755000
962883.333333333317429.381323883361600

\begin{tabular}{lllllllll}
\hline
Standard Deviation-Mean Plot \tabularnewline
Section & Mean & Standard Deviation & Range \tabularnewline
1 & 63891.6666666667 & 7966.23081095027 & 29700 \tabularnewline
2 & 62241.6666666667 & 10863.7393807719 & 39600 \tabularnewline
3 & 59583.3333333333 & 11658.6162700954 & 38500 \tabularnewline
4 & 60133.3333333333 & 12770.8000271453 & 47300 \tabularnewline
5 & 59675 & 15090.6427961171 & 50600 \tabularnewline
6 & 61416.6666666667 & 15190.2380933721 & 50600 \tabularnewline
7 & 62608.3333333333 & 14872.8219693955 & 55000 \tabularnewline
8 & 63341.6666666667 & 15978.1361032297 & 55000 \tabularnewline
9 & 62883.3333333333 & 17429.3813238833 & 61600 \tabularnewline
\hline
\end{tabular}
%Source: https://freestatistics.org/blog/index.php?pk=279949&T=1

[TABLE]
[ROW][C]Standard Deviation-Mean Plot[/C][/ROW]
[ROW][C]Section[/C][C]Mean[/C][C]Standard Deviation[/C][C]Range[/C][/ROW]
[ROW][C]1[/C][C]63891.6666666667[/C][C]7966.23081095027[/C][C]29700[/C][/ROW]
[ROW][C]2[/C][C]62241.6666666667[/C][C]10863.7393807719[/C][C]39600[/C][/ROW]
[ROW][C]3[/C][C]59583.3333333333[/C][C]11658.6162700954[/C][C]38500[/C][/ROW]
[ROW][C]4[/C][C]60133.3333333333[/C][C]12770.8000271453[/C][C]47300[/C][/ROW]
[ROW][C]5[/C][C]59675[/C][C]15090.6427961171[/C][C]50600[/C][/ROW]
[ROW][C]6[/C][C]61416.6666666667[/C][C]15190.2380933721[/C][C]50600[/C][/ROW]
[ROW][C]7[/C][C]62608.3333333333[/C][C]14872.8219693955[/C][C]55000[/C][/ROW]
[ROW][C]8[/C][C]63341.6666666667[/C][C]15978.1361032297[/C][C]55000[/C][/ROW]
[ROW][C]9[/C][C]62883.3333333333[/C][C]17429.3813238833[/C][C]61600[/C][/ROW]
[/TABLE]
Source: https://freestatistics.org/blog/index.php?pk=279949&T=1

Globally Unique Identifier (entire table): ba.freestatistics.org/blog/index.php?pk=279949&T=1

As an alternative you can also use a QR Code:  

The GUIDs for individual cells are displayed in the table below:

Standard Deviation-Mean Plot
SectionMeanStandard DeviationRange
163891.66666666677966.2308109502729700
262241.666666666710863.739380771939600
359583.333333333311658.616270095438500
460133.333333333312770.800027145347300
55967515090.642796117150600
661416.666666666715190.238093372150600
762608.333333333314872.821969395555000
863341.666666666715978.136103229755000
962883.333333333317429.381323883361600


Regression: S.E.(k) = alpha + beta * Mean(k)
alpha20170.855020989
beta-0.107448317059854
S.D.0.688757001617613
T-STAT-0.156003230177699
p-value0.880434120508993

\begin{tabular}{lllllllll}
\hline
Regression: S.E.(k) = alpha + beta * Mean(k) \tabularnewline
alpha & 20170.855020989 \tabularnewline
beta & -0.107448317059854 \tabularnewline
S.D. & 0.688757001617613 \tabularnewline
T-STAT & -0.156003230177699 \tabularnewline
p-value & 0.880434120508993 \tabularnewline
\hline
\end{tabular}
%Source: https://freestatistics.org/blog/index.php?pk=279949&T=2

[TABLE]
[ROW][C]Regression: S.E.(k) = alpha + beta * Mean(k)[/C][/ROW]
[ROW][C]alpha[/C][C]20170.855020989[/C][/ROW]
[ROW][C]beta[/C][C]-0.107448317059854[/C][/ROW]
[ROW][C]S.D.[/C][C]0.688757001617613[/C][/ROW]
[ROW][C]T-STAT[/C][C]-0.156003230177699[/C][/ROW]
[ROW][C]p-value[/C][C]0.880434120508993[/C][/ROW]
[/TABLE]
Source: https://freestatistics.org/blog/index.php?pk=279949&T=2

Globally Unique Identifier (entire table): ba.freestatistics.org/blog/index.php?pk=279949&T=2

As an alternative you can also use a QR Code:  

The GUIDs for individual cells are displayed in the table below:

Regression: S.E.(k) = alpha + beta * Mean(k)
alpha20170.855020989
beta-0.107448317059854
S.D.0.688757001617613
T-STAT-0.156003230177699
p-value0.880434120508993


Regression: ln S.E.(k) = alpha + beta * ln Mean(k)
alpha23.7879271260334
beta-1.2963355072814
S.D.3.45582772786271
T-STAT-0.375115778147638
p-value0.718681736243567
Lambda2.2963355072814

\begin{tabular}{lllllllll}
\hline
Regression: ln S.E.(k) = alpha + beta * ln Mean(k) \tabularnewline
alpha & 23.7879271260334 \tabularnewline
beta & -1.2963355072814 \tabularnewline
S.D. & 3.45582772786271 \tabularnewline
T-STAT & -0.375115778147638 \tabularnewline
p-value & 0.718681736243567 \tabularnewline
Lambda & 2.2963355072814 \tabularnewline
\hline
\end{tabular}
%Source: https://freestatistics.org/blog/index.php?pk=279949&T=3

[TABLE]
[ROW][C]Regression: ln S.E.(k) = alpha + beta * ln Mean(k)[/C][/ROW]
[ROW][C]alpha[/C][C]23.7879271260334[/C][/ROW]
[ROW][C]beta[/C][C]-1.2963355072814[/C][/ROW]
[ROW][C]S.D.[/C][C]3.45582772786271[/C][/ROW]
[ROW][C]T-STAT[/C][C]-0.375115778147638[/C][/ROW]
[ROW][C]p-value[/C][C]0.718681736243567[/C][/ROW]
[ROW][C]Lambda[/C][C]2.2963355072814[/C][/ROW]
[/TABLE]
Source: https://freestatistics.org/blog/index.php?pk=279949&T=3

Globally Unique Identifier (entire table): ba.freestatistics.org/blog/index.php?pk=279949&T=3

As an alternative you can also use a QR Code:  

The GUIDs for individual cells are displayed in the table below:

Regression: ln S.E.(k) = alpha + beta * ln Mean(k)
alpha23.7879271260334
beta-1.2963355072814
S.D.3.45582772786271
T-STAT-0.375115778147638
p-value0.718681736243567
Lambda2.2963355072814


Parameters (Session):
par1 = 12 ;
Parameters (R input):
par1 = 12 ;
R code (references can be found in the software module):
par1 <- as.numeric(par1)
(n <- length(x))
(np <- floor(n / par1))
arr <- array(NA,dim=c(par1,np))
j <- 0
k <- 1
for (i in 1:(np*par1))
{
j = j + 1
arr[j,k] <- x[i]
if (j == par1) {
j = 0
k=k+1
}
}
arr
arr.mean <- array(NA,dim=np)
arr.sd <- array(NA,dim=np)
arr.range <- array(NA,dim=np)
for (j in 1:np)
{
arr.mean[j] <- mean(arr[,j],na.rm=TRUE)
arr.sd[j] <- sd(arr[,j],na.rm=TRUE)
arr.range[j] <- max(arr[,j],na.rm=TRUE) - min(arr[,j],na.rm=TRUE)
}
arr.mean
arr.sd
arr.range
(lm1 <- lm(arr.sd~arr.mean))
(lnlm1 <- lm(log(arr.sd)~log(arr.mean)))
(lm2 <- lm(arr.range~arr.mean))
bitmap(file='test1.png')
plot(arr.mean,arr.sd,main='Standard Deviation-Mean Plot',xlab='mean',ylab='standard deviation')
dev.off()
bitmap(file='test2.png')
plot(arr.mean,arr.range,main='Range-Mean Plot',xlab='mean',ylab='range')
dev.off()
load(file='createtable')
a<-table.start()
a<-table.row.start(a)
a<-table.element(a,'Standard Deviation-Mean Plot',4,TRUE)
a<-table.row.end(a)
a<-table.row.start(a)
a<-table.element(a,'Section',header=TRUE)
a<-table.element(a,'Mean',header=TRUE)
a<-table.element(a,'Standard Deviation',header=TRUE)
a<-table.element(a,'Range',header=TRUE)
a<-table.row.end(a)
for (j in 1:np) {
a<-table.row.start(a)
a<-table.element(a,j,header=TRUE)
a<-table.element(a,arr.mean[j])
a<-table.element(a,arr.sd[j] )
a<-table.element(a,arr.range[j] )
a<-table.row.end(a)
}
a<-table.end(a)
table.save(a,file='mytable.tab')
a<-table.start()
a<-table.row.start(a)
a<-table.element(a,'Regression: S.E.(k) = alpha + beta * Mean(k)',2,TRUE)
a<-table.row.end(a)
a<-table.row.start(a)
a<-table.element(a,'alpha',header=TRUE)
a<-table.element(a,lm1$coefficients[[1]])
a<-table.row.end(a)
a<-table.row.start(a)
a<-table.element(a,'beta',header=TRUE)
a<-table.element(a,lm1$coefficients[[2]])
a<-table.row.end(a)
a<-table.row.start(a)
a<-table.element(a,'S.D.',header=TRUE)
a<-table.element(a,summary(lm1)$coefficients[2,2])
a<-table.row.end(a)
a<-table.row.start(a)
a<-table.element(a,'T-STAT',header=TRUE)
a<-table.element(a,summary(lm1)$coefficients[2,3])
a<-table.row.end(a)
a<-table.row.start(a)
a<-table.element(a,'p-value',header=TRUE)
a<-table.element(a,summary(lm1)$coefficients[2,4])
a<-table.row.end(a)
a<-table.end(a)
table.save(a,file='mytable1.tab')
a<-table.start()
a<-table.row.start(a)
a<-table.element(a,'Regression: ln S.E.(k) = alpha + beta * ln Mean(k)',2,TRUE)
a<-table.row.end(a)
a<-table.row.start(a)
a<-table.element(a,'alpha',header=TRUE)
a<-table.element(a,lnlm1$coefficients[[1]])
a<-table.row.end(a)
a<-table.row.start(a)
a<-table.element(a,'beta',header=TRUE)
a<-table.element(a,lnlm1$coefficients[[2]])
a<-table.row.end(a)
a<-table.row.start(a)
a<-table.element(a,'S.D.',header=TRUE)
a<-table.element(a,summary(lnlm1)$coefficients[2,2])
a<-table.row.end(a)
a<-table.row.start(a)
a<-table.element(a,'T-STAT',header=TRUE)
a<-table.element(a,summary(lnlm1)$coefficients[2,3])
a<-table.row.end(a)
a<-table.row.start(a)
a<-table.element(a,'p-value',header=TRUE)
a<-table.element(a,summary(lnlm1)$coefficients[2,4])
a<-table.row.end(a)
a<-table.row.start(a)
a<-table.element(a,'Lambda',header=TRUE)
a<-table.element(a,1-lnlm1$coefficients[[2]])
a<-table.row.end(a)
a<-table.end(a)
table.save(a,file='mytable2.tab')