Free Statistics

of Irreproducible Research!

Author's title

Author*Unverified author*
R Software Modulerwasp_smp.wasp
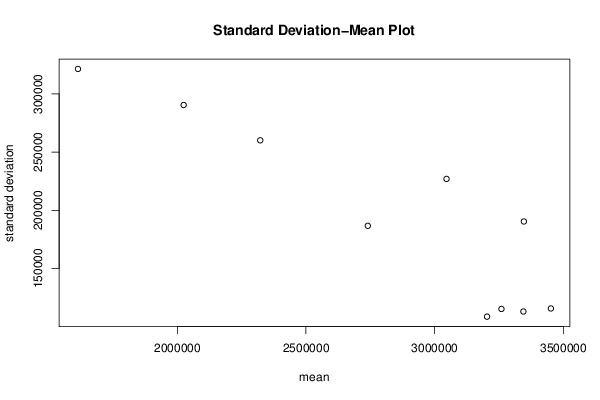
Title produced by softwareStandard Deviation-Mean Plot
Date of computationSun, 09 Aug 2015 18:04:17 +0100
Cite this page as followsStatistical Computations at FreeStatistics.org, Office for Research Development and Education, URL https://freestatistics.org/blog/index.php?v=date/2015/Aug/09/t1439139957d35g5bw7b88fahe.htm/, Retrieved Wed, 15 May 2024 21:38:08 +0000
Statistical Computations at FreeStatistics.org, Office for Research Development and Education, URL https://freestatistics.org/blog/index.php?pk=279958, Retrieved Wed, 15 May 2024 21:38:08 +0000
QR Codes:

Original text written by user:
IsPrivate?No (this computation is public)
User-defined keywordsStandard Deviation Mean Plot Sebastiaan Lunders Reeks A Omzet Mercedes A-klasse euro Ottevaere MAR204A sebastiaan.lunders@student.kdg.be
Estimated Impact132
Family? (F = Feedback message, R = changed R code, M = changed R Module, P = changed Parameters, D = changed Data)
-     [Univariate Data Series] [Cijferreeks A 2de...] [2015-08-05 23:58:24] [039d3b62ab99f9eeb4c9cc4c099c66fc]
- RMP   [(Partial) Autocorrelation Function] [Autocorrelation R...] [2015-08-09 16:24:48] [039d3b62ab99f9eeb4c9cc4c099c66fc]
- RMP     [Standard Deviation Plot] [Standard Deviatio...] [2015-08-09 16:43:04] [039d3b62ab99f9eeb4c9cc4c099c66fc]
- RM          [Standard Deviation-Mean Plot] [Standard Deviatio...] [2015-08-09 17:04:17] [2cf7618d5ff65529ef2e27cea5366de0] [Current]
- RMP           [Classical Decomposition] [Classic Decomposi...] [2015-08-09 17:24:10] [039d3b62ab99f9eeb4c9cc4c099c66fc]
- RMP             [Exponential Smoothing] [Exponential Smoot...] [2015-08-09 17:45:12] [039d3b62ab99f9eeb4c9cc4c099c66fc]
Feedback Forum

Post a new message
Dataseries X:
3221816.00
3209817.00
3197649.00
3172468.00
3421574.00
3408392.00
3221816.00
3097770.00
3109769.00
3109769.00
3123120.00
3147118.00
3184467.00
3184467.00
3160469.00
3097770.00
3421574.00
3470922.00
3396393.00
3221816.00
3296514.00
3184467.00
3234998.00
3259165.00
3284346.00
3221816.00
3234998.00
3147118.00
3421574.00
3508271.00
3433742.00
3296514.00
3445741.00
3284346.00
3433742.00
3421574.00
3458923.00
3321695.00
3470922.00
3458923.00
3682848.00
3632317.00
3433742.00
3333694.00
3470922.00
3284346.00
3421574.00
3445741.00
3496272.00
3384394.00
3445741.00
3483090.00
3620318.00
3508271.00
3359044.00
3197649.00
3347045.00
2936375.00
3135119.00
3246997.00
3359044.00
3197649.00
3197649.00
3197649.00
3284346.00
3160469.00
2997891.00
2861846.00
2960542.00
2575222.00
2811315.00
2948543.00
2973724.00
2836496.00
2848495.00
2811315.00
2936375.00
2848495.00
2675270.00
2550041.00
2761798.00
2301949.00
2600572.00
2736617.00
2736617.00
2575222.00
2425995.00
2413996.00
2550041.00
2425995.00
2190071.00
2027493.00
2202070.00
1791569.00
2164721.00
2363296.00
2425995.00
2288767.00
2115373.00
2239419.00
2288767.00
2251418.00
1878097.00
1704872.00
1828749.00
1455597.00
1840917.00
1978145.00
2090023.00
1903447.00
1728870.00
1828749.00
1878097.00
1779401.00
1406249.00
1243671.00
1392898.00
982397.00
1430247.00
1704872.00


Summary of computational transaction
Raw Inputview raw input (R code)
Raw Outputview raw output of R engine
Computing time1 seconds
R Server'Herman Ole Andreas Wold' @ wold.wessa.net

\begin{tabular}{lllllllll}
\hline
Summary of computational transaction \tabularnewline
Raw Input & view raw input (R code)  \tabularnewline
Raw Output & view raw output of R engine  \tabularnewline
Computing time & 1 seconds \tabularnewline
R Server & 'Herman Ole Andreas Wold' @ wold.wessa.net \tabularnewline
\hline
\end{tabular}
%Source: https://freestatistics.org/blog/index.php?pk=279958&T=0

[TABLE]
[ROW][C]Summary of computational transaction[/C][/ROW]
[ROW][C]Raw Input[/C][C]view raw input (R code) [/C][/ROW]
[ROW][C]Raw Output[/C][C]view raw output of R engine [/C][/ROW]
[ROW][C]Computing time[/C][C]1 seconds[/C][/ROW]
[ROW][C]R Server[/C][C]'Herman Ole Andreas Wold' @ wold.wessa.net[/C][/ROW]
[/TABLE]
Source: https://freestatistics.org/blog/index.php?pk=279958&T=0

Globally Unique Identifier (entire table): ba.freestatistics.org/blog/index.php?pk=279958&T=0

As an alternative you can also use a QR Code:  

The GUIDs for individual cells are displayed in the table below:

Summary of computational transaction
Raw Inputview raw input (R code)
Raw Outputview raw output of R engine
Computing time1 seconds
R Server'Herman Ole Andreas Wold' @ wold.wessa.net


Standard Deviation-Mean Plot
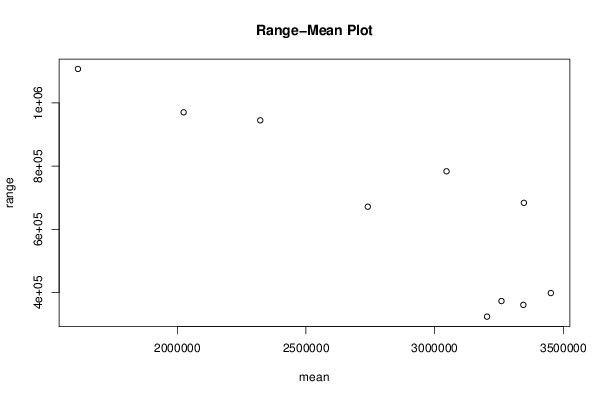
SectionMeanStandard DeviationRange
13203423.16666667108558.619971661323804
23259418.5115187.997603522373152
33344481.83333333112984.760860467361153
43451303.91666667115598.436106485398502
53346692.91666667190362.925468198683943
63046013.75226963.723906837783822
72740095.58333333186649.748390576671775
82322257.16666667260147.799653768945048
92024676.33333333290489.914081315970398
101614076.75321492.2215106311107626

\begin{tabular}{lllllllll}
\hline
Standard Deviation-Mean Plot \tabularnewline
Section & Mean & Standard Deviation & Range \tabularnewline
1 & 3203423.16666667 & 108558.619971661 & 323804 \tabularnewline
2 & 3259418.5 & 115187.997603522 & 373152 \tabularnewline
3 & 3344481.83333333 & 112984.760860467 & 361153 \tabularnewline
4 & 3451303.91666667 & 115598.436106485 & 398502 \tabularnewline
5 & 3346692.91666667 & 190362.925468198 & 683943 \tabularnewline
6 & 3046013.75 & 226963.723906837 & 783822 \tabularnewline
7 & 2740095.58333333 & 186649.748390576 & 671775 \tabularnewline
8 & 2322257.16666667 & 260147.799653768 & 945048 \tabularnewline
9 & 2024676.33333333 & 290489.914081315 & 970398 \tabularnewline
10 & 1614076.75 & 321492.221510631 & 1107626 \tabularnewline
\hline
\end{tabular}
%Source: https://freestatistics.org/blog/index.php?pk=279958&T=1

[TABLE]
[ROW][C]Standard Deviation-Mean Plot[/C][/ROW]
[ROW][C]Section[/C][C]Mean[/C][C]Standard Deviation[/C][C]Range[/C][/ROW]
[ROW][C]1[/C][C]3203423.16666667[/C][C]108558.619971661[/C][C]323804[/C][/ROW]
[ROW][C]2[/C][C]3259418.5[/C][C]115187.997603522[/C][C]373152[/C][/ROW]
[ROW][C]3[/C][C]3344481.83333333[/C][C]112984.760860467[/C][C]361153[/C][/ROW]
[ROW][C]4[/C][C]3451303.91666667[/C][C]115598.436106485[/C][C]398502[/C][/ROW]
[ROW][C]5[/C][C]3346692.91666667[/C][C]190362.925468198[/C][C]683943[/C][/ROW]
[ROW][C]6[/C][C]3046013.75[/C][C]226963.723906837[/C][C]783822[/C][/ROW]
[ROW][C]7[/C][C]2740095.58333333[/C][C]186649.748390576[/C][C]671775[/C][/ROW]
[ROW][C]8[/C][C]2322257.16666667[/C][C]260147.799653768[/C][C]945048[/C][/ROW]
[ROW][C]9[/C][C]2024676.33333333[/C][C]290489.914081315[/C][C]970398[/C][/ROW]
[ROW][C]10[/C][C]1614076.75[/C][C]321492.221510631[/C][C]1107626[/C][/ROW]
[/TABLE]
Source: https://freestatistics.org/blog/index.php?pk=279958&T=1

Globally Unique Identifier (entire table): ba.freestatistics.org/blog/index.php?pk=279958&T=1

As an alternative you can also use a QR Code:  

The GUIDs for individual cells are displayed in the table below:

Standard Deviation-Mean Plot
SectionMeanStandard DeviationRange
13203423.16666667108558.619971661323804
23259418.5115187.997603522373152
33344481.83333333112984.760860467361153
43451303.91666667115598.436106485398502
53346692.91666667190362.925468198683943
63046013.75226963.723906837783822
72740095.58333333186649.748390576671775
82322257.16666667260147.799653768945048
92024676.33333333290489.914081315970398
101614076.75321492.2215106311107626


Regression: S.E.(k) = alpha + beta * Mean(k)
alpha513656.553791114
beta-0.113151792219188
S.D.0.0185894327362385
T-STAT-6.08688784777213
p-value0.000293686871073616

\begin{tabular}{lllllllll}
\hline
Regression: S.E.(k) = alpha + beta * Mean(k) \tabularnewline
alpha & 513656.553791114 \tabularnewline
beta & -0.113151792219188 \tabularnewline
S.D. & 0.0185894327362385 \tabularnewline
T-STAT & -6.08688784777213 \tabularnewline
p-value & 0.000293686871073616 \tabularnewline
\hline
\end{tabular}
%Source: https://freestatistics.org/blog/index.php?pk=279958&T=2

[TABLE]
[ROW][C]Regression: S.E.(k) = alpha + beta * Mean(k)[/C][/ROW]
[ROW][C]alpha[/C][C]513656.553791114[/C][/ROW]
[ROW][C]beta[/C][C]-0.113151792219188[/C][/ROW]
[ROW][C]S.D.[/C][C]0.0185894327362385[/C][/ROW]
[ROW][C]T-STAT[/C][C]-6.08688784777213[/C][/ROW]
[ROW][C]p-value[/C][C]0.000293686871073616[/C][/ROW]
[/TABLE]
Source: https://freestatistics.org/blog/index.php?pk=279958&T=2

Globally Unique Identifier (entire table): ba.freestatistics.org/blog/index.php?pk=279958&T=2

As an alternative you can also use a QR Code:  

The GUIDs for individual cells are displayed in the table below:

Regression: S.E.(k) = alpha + beta * Mean(k)
alpha513656.553791114
beta-0.113151792219188
S.D.0.0185894327362385
T-STAT-6.08688784777213
p-value0.000293686871073616


Regression: ln S.E.(k) = alpha + beta * ln Mean(k)
alpha32.6429898907453
beta-1.38589065989076
S.D.0.316605261909547
T-STAT-4.37734563074542
p-value0.00235715681397511
Lambda2.38589065989076

\begin{tabular}{lllllllll}
\hline
Regression: ln S.E.(k) = alpha + beta * ln Mean(k) \tabularnewline
alpha & 32.6429898907453 \tabularnewline
beta & -1.38589065989076 \tabularnewline
S.D. & 0.316605261909547 \tabularnewline
T-STAT & -4.37734563074542 \tabularnewline
p-value & 0.00235715681397511 \tabularnewline
Lambda & 2.38589065989076 \tabularnewline
\hline
\end{tabular}
%Source: https://freestatistics.org/blog/index.php?pk=279958&T=3

[TABLE]
[ROW][C]Regression: ln S.E.(k) = alpha + beta * ln Mean(k)[/C][/ROW]
[ROW][C]alpha[/C][C]32.6429898907453[/C][/ROW]
[ROW][C]beta[/C][C]-1.38589065989076[/C][/ROW]
[ROW][C]S.D.[/C][C]0.316605261909547[/C][/ROW]
[ROW][C]T-STAT[/C][C]-4.37734563074542[/C][/ROW]
[ROW][C]p-value[/C][C]0.00235715681397511[/C][/ROW]
[ROW][C]Lambda[/C][C]2.38589065989076[/C][/ROW]
[/TABLE]
Source: https://freestatistics.org/blog/index.php?pk=279958&T=3

Globally Unique Identifier (entire table): ba.freestatistics.org/blog/index.php?pk=279958&T=3

As an alternative you can also use a QR Code:  

The GUIDs for individual cells are displayed in the table below:

Regression: ln S.E.(k) = alpha + beta * ln Mean(k)
alpha32.6429898907453
beta-1.38589065989076
S.D.0.316605261909547
T-STAT-4.37734563074542
p-value0.00235715681397511
Lambda2.38589065989076


Parameters (Session):
par1 = 12 ;
Parameters (R input):
par1 = 12 ;
R code (references can be found in the software module):
par1 <- as.numeric(par1)
(n <- length(x))
(np <- floor(n / par1))
arr <- array(NA,dim=c(par1,np))
j <- 0
k <- 1
for (i in 1:(np*par1))
{
j = j + 1
arr[j,k] <- x[i]
if (j == par1) {
j = 0
k=k+1
}
}
arr
arr.mean <- array(NA,dim=np)
arr.sd <- array(NA,dim=np)
arr.range <- array(NA,dim=np)
for (j in 1:np)
{
arr.mean[j] <- mean(arr[,j],na.rm=TRUE)
arr.sd[j] <- sd(arr[,j],na.rm=TRUE)
arr.range[j] <- max(arr[,j],na.rm=TRUE) - min(arr[,j],na.rm=TRUE)
}
arr.mean
arr.sd
arr.range
(lm1 <- lm(arr.sd~arr.mean))
(lnlm1 <- lm(log(arr.sd)~log(arr.mean)))
(lm2 <- lm(arr.range~arr.mean))
bitmap(file='test1.png')
plot(arr.mean,arr.sd,main='Standard Deviation-Mean Plot',xlab='mean',ylab='standard deviation')
dev.off()
bitmap(file='test2.png')
plot(arr.mean,arr.range,main='Range-Mean Plot',xlab='mean',ylab='range')
dev.off()
load(file='createtable')
a<-table.start()
a<-table.row.start(a)
a<-table.element(a,'Standard Deviation-Mean Plot',4,TRUE)
a<-table.row.end(a)
a<-table.row.start(a)
a<-table.element(a,'Section',header=TRUE)
a<-table.element(a,'Mean',header=TRUE)
a<-table.element(a,'Standard Deviation',header=TRUE)
a<-table.element(a,'Range',header=TRUE)
a<-table.row.end(a)
for (j in 1:np) {
a<-table.row.start(a)
a<-table.element(a,j,header=TRUE)
a<-table.element(a,arr.mean[j])
a<-table.element(a,arr.sd[j] )
a<-table.element(a,arr.range[j] )
a<-table.row.end(a)
}
a<-table.end(a)
table.save(a,file='mytable.tab')
a<-table.start()
a<-table.row.start(a)
a<-table.element(a,'Regression: S.E.(k) = alpha + beta * Mean(k)',2,TRUE)
a<-table.row.end(a)
a<-table.row.start(a)
a<-table.element(a,'alpha',header=TRUE)
a<-table.element(a,lm1$coefficients[[1]])
a<-table.row.end(a)
a<-table.row.start(a)
a<-table.element(a,'beta',header=TRUE)
a<-table.element(a,lm1$coefficients[[2]])
a<-table.row.end(a)
a<-table.row.start(a)
a<-table.element(a,'S.D.',header=TRUE)
a<-table.element(a,summary(lm1)$coefficients[2,2])
a<-table.row.end(a)
a<-table.row.start(a)
a<-table.element(a,'T-STAT',header=TRUE)
a<-table.element(a,summary(lm1)$coefficients[2,3])
a<-table.row.end(a)
a<-table.row.start(a)
a<-table.element(a,'p-value',header=TRUE)
a<-table.element(a,summary(lm1)$coefficients[2,4])
a<-table.row.end(a)
a<-table.end(a)
table.save(a,file='mytable1.tab')
a<-table.start()
a<-table.row.start(a)
a<-table.element(a,'Regression: ln S.E.(k) = alpha + beta * ln Mean(k)',2,TRUE)
a<-table.row.end(a)
a<-table.row.start(a)
a<-table.element(a,'alpha',header=TRUE)
a<-table.element(a,lnlm1$coefficients[[1]])
a<-table.row.end(a)
a<-table.row.start(a)
a<-table.element(a,'beta',header=TRUE)
a<-table.element(a,lnlm1$coefficients[[2]])
a<-table.row.end(a)
a<-table.row.start(a)
a<-table.element(a,'S.D.',header=TRUE)
a<-table.element(a,summary(lnlm1)$coefficients[2,2])
a<-table.row.end(a)
a<-table.row.start(a)
a<-table.element(a,'T-STAT',header=TRUE)
a<-table.element(a,summary(lnlm1)$coefficients[2,3])
a<-table.row.end(a)
a<-table.row.start(a)
a<-table.element(a,'p-value',header=TRUE)
a<-table.element(a,summary(lnlm1)$coefficients[2,4])
a<-table.row.end(a)
a<-table.row.start(a)
a<-table.element(a,'Lambda',header=TRUE)
a<-table.element(a,1-lnlm1$coefficients[[2]])
a<-table.row.end(a)
a<-table.end(a)
table.save(a,file='mytable2.tab')