Free Statistics
of Irreproducible Research!
Description of Statistical Computation | |||||||||||||||||||||||||||||||||||||||||
|---|---|---|---|---|---|---|---|---|---|---|---|---|---|---|---|---|---|---|---|---|---|---|---|---|---|---|---|---|---|---|---|---|---|---|---|---|---|---|---|---|---|
| Author's title | |||||||||||||||||||||||||||||||||||||||||
| Author | *Unverified author* | ||||||||||||||||||||||||||||||||||||||||
| R Software Module | rwasp_univariatedataseries.wasp | ||||||||||||||||||||||||||||||||||||||||
| Title produced by software | Univariate Data Series | ||||||||||||||||||||||||||||||||||||||||
| Date of computation | Tue, 11 Aug 2015 09:05:54 +0100 | ||||||||||||||||||||||||||||||||||||||||
| Cite this page as follows | Statistical Computations at FreeStatistics.org, Office for Research Development and Education, URL https://freestatistics.org/blog/index.php?v=date/2015/Aug/11/t14392804718rkm3r9s62euguo.htm/, Retrieved Wed, 15 May 2024 07:25:40 +0000 | ||||||||||||||||||||||||||||||||||||||||
| Statistical Computations at FreeStatistics.org, Office for Research Development and Education, URL https://freestatistics.org/blog/index.php?pk=280000, Retrieved Wed, 15 May 2024 07:25:40 +0000 | |||||||||||||||||||||||||||||||||||||||||
| QR Codes: | |||||||||||||||||||||||||||||||||||||||||
|
| |||||||||||||||||||||||||||||||||||||||||
| Original text written by user: | |||||||||||||||||||||||||||||||||||||||||
| IsPrivate? | No (this computation is public) | ||||||||||||||||||||||||||||||||||||||||
| User-defined keywords | |||||||||||||||||||||||||||||||||||||||||
| Estimated Impact | 143 | ||||||||||||||||||||||||||||||||||||||||
Tree of Dependent Computations | |||||||||||||||||||||||||||||||||||||||||
| Family? (F = Feedback message, R = changed R code, M = changed R Module, P = changed Parameters, D = changed Data) | |||||||||||||||||||||||||||||||||||||||||
| - [Univariate Data Series] [plot tijdreeks B] [2015-08-11 08:05:54] [d3245c242fac7b2d7caab09de558415e] [Current] | |||||||||||||||||||||||||||||||||||||||||
| Feedback Forum | |||||||||||||||||||||||||||||||||||||||||
Post a new message | |||||||||||||||||||||||||||||||||||||||||
Dataset | |||||||||||||||||||||||||||||||||||||||||
| Dataseries X: | |||||||||||||||||||||||||||||||||||||||||
1755000 1690000 1787500 1430000 1852500 1820000 1950000 2015000 2242500 1950000 1852500 2307500 1950000 1462500 1722500 1300000 1820000 1495000 1982500 1787500 1885000 2112500 2080000 2470000 1787500 1495000 1657500 1202500 1722500 1332500 1885000 1787500 1592500 2275000 2047500 2340000 1755000 1625000 1462500 1202500 1592500 1430000 1950000 1885000 1625000 2177500 2015000 2600000 2080000 1267500 1267500 1267500 1495000 1495000 2015000 1852500 1657500 2080000 1917500 2762500 2177500 1267500 1332500 1105000 1527500 1755000 2210000 2177500 1755000 2047500 1820000 2600000 1982500 1592500 1430000 1072500 1592500 1917500 2242500 2112500 1560000 2242500 1755000 2697500 2242500 1625000 1495000 1007500 1592500 1527500 2307500 2307500 1755000 2275000 1690000 2632500 2242500 1657500 1267500 877500 1722500 1657500 2177500 2502500 1852500 2080000 1560000 2697500 | |||||||||||||||||||||||||||||||||||||||||
Tables (Output of Computation) | |||||||||||||||||||||||||||||||||||||||||
| |||||||||||||||||||||||||||||||||||||||||
Figures (Output of Computation) | |||||||||||||||||||||||||||||||||||||||||
Input Parameters & R Code | |||||||||||||||||||||||||||||||||||||||||
| Parameters (Session): | |||||||||||||||||||||||||||||||||||||||||
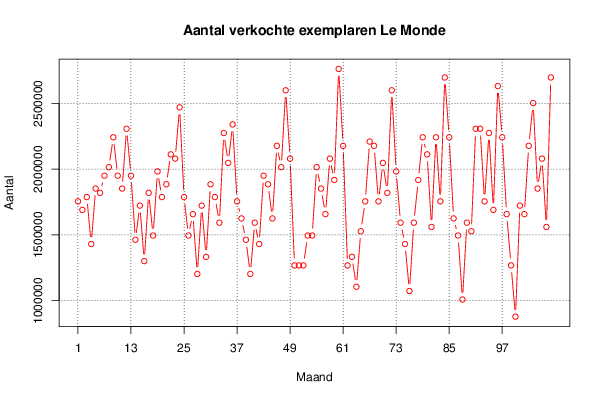
| par1 = Aantal verkochte exemplaren van Le Monde ; par2 = Niet gekend ; par3 = Hier zien we een overzicht van het aantal verkochte exemplaren van Le Monde over een periode van 9 jaar te beginnen bij januari 2006. ; par4 = 12 ; | |||||||||||||||||||||||||||||||||||||||||
| Parameters (R input): | |||||||||||||||||||||||||||||||||||||||||
| par1 = Aantal verkochte exemplaren van Le Monde ; par2 = Niet gekend ; par3 = Hier zien we een overzicht van het aantal verkochte exemplaren van Le Monde over een periode van 9 jaar te beginnen bij januari 2006. ; par4 = 12 ; | |||||||||||||||||||||||||||||||||||||||||
| R code (references can be found in the software module): | |||||||||||||||||||||||||||||||||||||||||
par4 <- '12' | |||||||||||||||||||||||||||||||||||||||||