Free Statistics

of Irreproducible Research!

Author's title

Author*The author of this computation has been verified*
R Software Modulerwasp_density.wasp
Title produced by softwareKernel Density Estimation
Date of computationThu, 13 Aug 2015 12:28:12 +0100
Cite this page as followsStatistical Computations at FreeStatistics.org, Office for Research Development and Education, URL https://freestatistics.org/blog/index.php?v=date/2015/Aug/13/t14394653157ufwmfkhux191bd.htm/, Retrieved Thu, 16 May 2024 07:39:49 +0000
Statistical Computations at FreeStatistics.org, Office for Research Development and Education, URL https://freestatistics.org/blog/index.php?pk=280039, Retrieved Thu, 16 May 2024 07:39:49 +0000
QR Codes:

Original text written by user:
IsPrivate?No (this computation is public)
User-defined keywords
Estimated Impact188
Family? (F = Feedback message, R = changed R code, M = changed R Module, P = changed Parameters, D = changed Data)
-       [Kernel Density Estimation] [] [2015-08-13 11:28:12] [63a9f0ea7bb98050796b649e85481845] [Current]
Feedback Forum

Post a new message
Dataseries X:
161.5
184.8
169.5
177.4
169
171.9
163.2
173.2
176.4
173.8
174.2
176.3
158.6
173.9
159.7
186.1
174.3
156
173.1
159.6
172.9
169.3
180.2
176.5
169.8
153.3
175.6
168.6
165.3
159.4
170
165.4
175.1
172.8
178.7
170
161.9
186.3
163.7
179.8
168
180.4
195.7
157.2
172.1
151
166.7
155.8
180.7
173.8
175.5
166.6
191.2
163.9
171.2
178.1
168
178.2
168.5
174.6
177.8
189.1
160.5
176.4
147.9
164.9
187.8
158.6
174
162.2
180.1
184.8
175.6
159.7
162.7
178.7
185
160.8
161.7
158.2
161.7
172.5
172
167
153
197.3
156.2
171.2
165.6
182.2
159.9
165
171.5
170.3
180.4
172.1
160.2
165.7
162.4
167.4


Summary of computational transaction
Raw Inputview raw input (R code)
Raw Outputview raw output of R engine
Computing time3 seconds
R Server'George Udny Yule' @ yule.wessa.net

\begin{tabular}{lllllllll}
\hline
Summary of computational transaction \tabularnewline
Raw Input & view raw input (R code)  \tabularnewline
Raw Output & view raw output of R engine  \tabularnewline
Computing time & 3 seconds \tabularnewline
R Server & 'George Udny Yule' @ yule.wessa.net \tabularnewline
\hline
\end{tabular}
%Source: https://freestatistics.org/blog/index.php?pk=280039&T=0

[TABLE]
[ROW][C]Summary of computational transaction[/C][/ROW]
[ROW][C]Raw Input[/C][C]view raw input (R code) [/C][/ROW]
[ROW][C]Raw Output[/C][C]view raw output of R engine [/C][/ROW]
[ROW][C]Computing time[/C][C]3 seconds[/C][/ROW]
[ROW][C]R Server[/C][C]'George Udny Yule' @ yule.wessa.net[/C][/ROW]
[/TABLE]
Source: https://freestatistics.org/blog/index.php?pk=280039&T=0

Globally Unique Identifier (entire table): ba.freestatistics.org/blog/index.php?pk=280039&T=0

As an alternative you can also use a QR Code:  

The GUIDs for individual cells are displayed in the table below:

Summary of computational transaction
Raw Inputview raw input (R code)
Raw Outputview raw output of R engine
Computing time3 seconds
R Server'George Udny Yule' @ yule.wessa.net


Properties of Density Trace
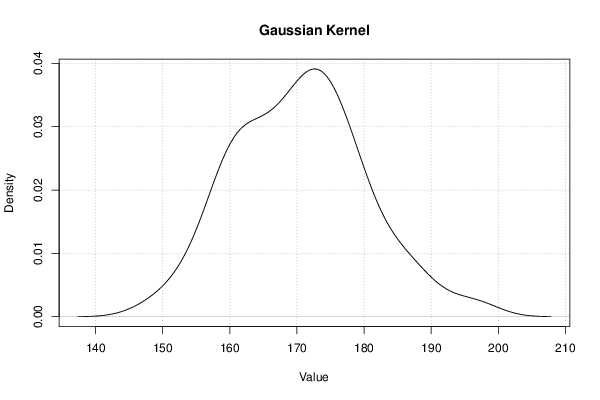
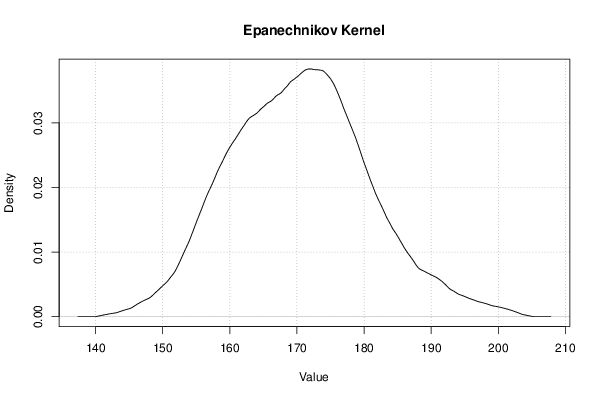
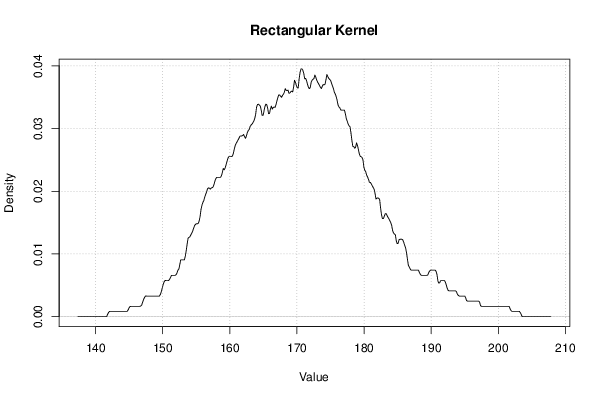
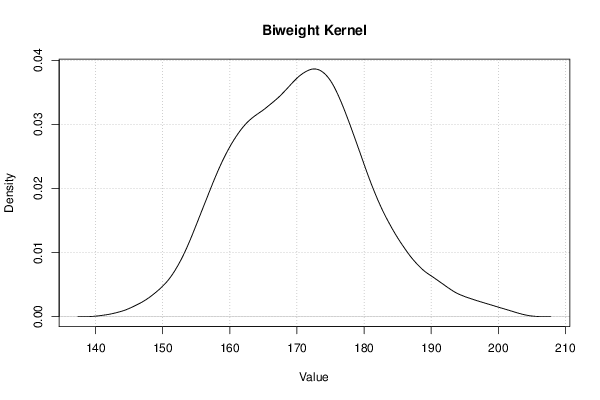
Bandwidth3.50612499579511
#Observations100

\begin{tabular}{lllllllll}
\hline
Properties of Density Trace \tabularnewline
Bandwidth & 3.50612499579511 \tabularnewline
#Observations & 100 \tabularnewline
\hline
\end{tabular}
%Source: https://freestatistics.org/blog/index.php?pk=280039&T=1

[TABLE]
[ROW][C]Properties of Density Trace[/C][/ROW]
[ROW][C]Bandwidth[/C][C]3.50612499579511[/C][/ROW]
[ROW][C]#Observations[/C][C]100[/C][/ROW]
[/TABLE]
Source: https://freestatistics.org/blog/index.php?pk=280039&T=1

Globally Unique Identifier (entire table): ba.freestatistics.org/blog/index.php?pk=280039&T=1

As an alternative you can also use a QR Code:  

The GUIDs for individual cells are displayed in the table below:

Properties of Density Trace
Bandwidth3.50612499579511
#Observations100


Maximum Density Values
Kernelx-valuemax. density
Gaussian172.6689204989970.0391044991077014
Epanechnikov171.9797155090280.0383628081169855
Rectangular170.6013055290920.0395205717912767
Triangular172.8067614969910.0389963528666791
Biweight172.5310795010030.0386435631386674
Cosine172.5310795010030.0387193249060092
Optcosine172.6689204989970.0384544774478143

\begin{tabular}{lllllllll}
\hline
Maximum Density Values \tabularnewline
Kernel & x-value & max. density \tabularnewline
Gaussian & 172.668920498997 & 0.0391044991077014 \tabularnewline
Epanechnikov & 171.979715509028 & 0.0383628081169855 \tabularnewline
Rectangular & 170.601305529092 & 0.0395205717912767 \tabularnewline
Triangular & 172.806761496991 & 0.0389963528666791 \tabularnewline
Biweight & 172.531079501003 & 0.0386435631386674 \tabularnewline
Cosine & 172.531079501003 & 0.0387193249060092 \tabularnewline
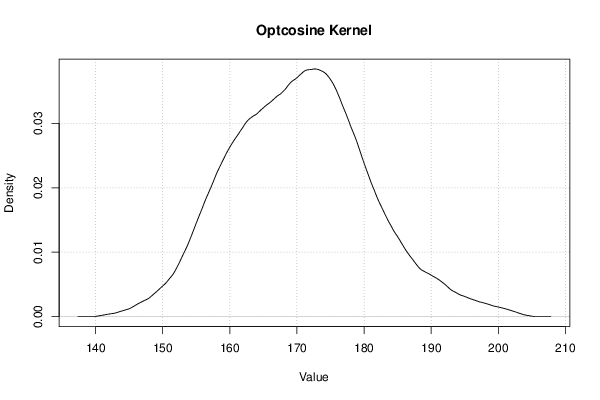
Optcosine & 172.668920498997 & 0.0384544774478143 \tabularnewline
 \hline
\end{tabular}
%Source: https://freestatistics.org/blog/index.php?pk=280039&T=2

[TABLE]
[ROW][C]Maximum Density Values[/C][/ROW]
[ROW][C]Kernel[/C][C]x-value[/C][C]max. density[/C][/ROW]
[ROW][C]Gaussian[/C][C]172.668920498997[/C][C]0.0391044991077014[/C][/ROW]
[ROW][C]Epanechnikov[/C][C]171.979715509028[/C][C]0.0383628081169855[/C][/ROW]
[ROW][C]Rectangular[/C][C]170.601305529092[/C][C]0.0395205717912767[/C][/ROW]
[ROW][C]Triangular[/C][C]172.806761496991[/C][C]0.0389963528666791[/C][/ROW]
[ROW][C]Biweight[/C][C]172.531079501003[/C][C]0.0386435631386674[/C][/ROW]
[ROW][C]Cosine[/C][C]172.531079501003[/C][C]0.0387193249060092[/C][/ROW]
[ROW][C]Optcosine[/C][C]172.668920498997[/C][C]0.0384544774478143[/C][/ROW]
 [/TABLE]
Source: https://freestatistics.org/blog/index.php?pk=280039&T=2

Globally Unique Identifier (entire table): ba.freestatistics.org/blog/index.php?pk=280039&T=2

As an alternative you can also use a QR Code:  

The GUIDs for individual cells are displayed in the table below:

Maximum Density Values
Kernelx-valuemax. density
Gaussian172.6689204989970.0391044991077014
Epanechnikov171.9797155090280.0383628081169855
Rectangular170.6013055290920.0395205717912767
Triangular172.8067614969910.0389963528666791
Biweight172.5310795010030.0386435631386674
Cosine172.5310795010030.0387193249060092
Optcosine172.6689204989970.0384544774478143


Maximum Density Values
Kernelx-valuemax. density
Gaussian172.6689204989970.0391044991077014
Epanechnikov171.9797155090280.0383628081169855
Rectangular170.7391465270850.0395205717912767
Triangular172.8067614969910.0389963528666791
Biweight172.5310795010030.0386435631386674
Cosine172.5310795010030.0387193249060092
Optcosine172.6689204989970.0384544774478143

\begin{tabular}{lllllllll}
\hline
Maximum Density Values \tabularnewline
Kernel & x-value & max. density \tabularnewline
Gaussian & 172.668920498997 & 0.0391044991077014 \tabularnewline
Epanechnikov & 171.979715509028 & 0.0383628081169855 \tabularnewline
Rectangular & 170.739146527085 & 0.0395205717912767 \tabularnewline
Triangular & 172.806761496991 & 0.0389963528666791 \tabularnewline
Biweight & 172.531079501003 & 0.0386435631386674 \tabularnewline
Cosine & 172.531079501003 & 0.0387193249060092 \tabularnewline
Optcosine & 172.668920498997 & 0.0384544774478143 \tabularnewline
\hline
\end{tabular}
%Source: https://freestatistics.org/blog/index.php?pk=280039&T=3

[TABLE]
[ROW][C]Maximum Density Values[/C][/ROW]
[ROW][C]Kernel[/C][C]x-value[/C][C]max. density[/C][/ROW]
[ROW][C]Gaussian[/C][C]172.668920498997[/C][C]0.0391044991077014[/C][/ROW]
[ROW][C]Epanechnikov[/C][C]171.979715509028[/C][C]0.0383628081169855[/C][/ROW]
[ROW][C]Rectangular[/C][C]170.739146527085[/C][C]0.0395205717912767[/C][/ROW]
[ROW][C]Triangular[/C][C]172.806761496991[/C][C]0.0389963528666791[/C][/ROW]
[ROW][C]Biweight[/C][C]172.531079501003[/C][C]0.0386435631386674[/C][/ROW]
[ROW][C]Cosine[/C][C]172.531079501003[/C][C]0.0387193249060092[/C][/ROW]
[ROW][C]Optcosine[/C][C]172.668920498997[/C][C]0.0384544774478143[/C][/ROW]
[/TABLE]
Source: https://freestatistics.org/blog/index.php?pk=280039&T=3

Globally Unique Identifier (entire table): ba.freestatistics.org/blog/index.php?pk=280039&T=3

As an alternative you can also use a QR Code:  

The GUIDs for individual cells are displayed in the table below:

Maximum Density Values
Kernelx-valuemax. density
Gaussian172.6689204989970.0391044991077014
Epanechnikov171.9797155090280.0383628081169855
Rectangular170.7391465270850.0395205717912767
Triangular172.8067614969910.0389963528666791
Biweight172.5310795010030.0386435631386674
Cosine172.5310795010030.0387193249060092
Optcosine172.6689204989970.0384544774478143


Parameters (Session):
par1 = 0 ; par2 = no ; par3 = 512 ;
Parameters (R input):
par1 = 0 ; par2 = no ; par3 = 512 ;
R code (references can be found in the software module):
if (par1 == '0') bw <- 'nrd0'
if (par1 != '0') bw <- as.numeric(par1)
par3 <- as.numeric(par3)
mydensity <- array(NA, dim=c(par3,8))
bitmap(file='density1.png')
mydensity1<-density(x,bw=bw,kernel='gaussian',na.rm=TRUE)
mydensity[,8] = signif(mydensity1$x,3)
mydensity[,1] = signif(mydensity1$y,3)
plot(mydensity1,main='Gaussian Kernel',xlab=xlab,ylab=ylab)
grid()
dev.off()
mydensity1
bitmap(file='density2.png')
mydensity2<-density(x,bw=bw,kernel='epanechnikov',na.rm=TRUE)
mydensity[,2] = signif(mydensity2$y,3)
plot(mydensity2,main='Epanechnikov Kernel',xlab=xlab,ylab=ylab)
grid()
dev.off()
bitmap(file='density3.png')
mydensity3<-density(x,bw=bw,kernel='rectangular',na.rm=TRUE)
mydensity[,3] = signif(mydensity3$y,3)
plot(mydensity3,main='Rectangular Kernel',xlab=xlab,ylab=ylab)
grid()
dev.off()
bitmap(file='density4.png')
mydensity4<-density(x,bw=bw,kernel='triangular',na.rm=TRUE)
mydensity[,4] = signif(mydensity4$y,3)
plot(mydensity4,main='Triangular Kernel',xlab=xlab,ylab=ylab)
grid()
dev.off()
bitmap(file='density5.png')
mydensity5<-density(x,bw=bw,kernel='biweight',na.rm=TRUE)
mydensity[,5] = signif(mydensity5$y,3)
plot(mydensity5,main='Biweight Kernel',xlab=xlab,ylab=ylab)
grid()
dev.off()
bitmap(file='density6.png')
mydensity6<-density(x,bw=bw,kernel='cosine',na.rm=TRUE)
mydensity[,6] = signif(mydensity6$y,3)
plot(mydensity6,main='Cosine Kernel',xlab=xlab,ylab=ylab)
grid()
dev.off()
bitmap(file='density7.png')
mydensity7<-density(x,bw=bw,kernel='optcosine',na.rm=TRUE)
mydensity[,7] = signif(mydensity7$y,3)
plot(mydensity7,main='Optcosine Kernel',xlab=xlab,ylab=ylab)
grid()
dev.off()
load(file='createtable')
a<-table.start()
a<-table.row.start(a)
a<-table.element(a,'Properties of Density Trace',2,TRUE)
a<-table.row.end(a)
a<-table.row.start(a)
a<-table.element(a,'Bandwidth',header=TRUE)
a<-table.element(a,mydensity1$bw)
a<-table.row.end(a)
a<-table.row.start(a)
a<-table.element(a,'#Observations',header=TRUE)
a<-table.element(a,mydensity1$n)
a<-table.row.end(a)
a<-table.end(a)
table.save(a,file='mytable.tab')
a<-table.start()
a<-table.row.start(a)
a<-table.element(a,'Maximum Density Values',3,TRUE)
a<-table.row.end(a)
a<-table.row.start(a)
a<-table.element(a,'Kernel',1,TRUE)
a<-table.element(a,'x-value',1,TRUE)
a<-table.element(a,'max. density',1,TRUE)
a<-table.row.end(a)
a<-table.row.start(a)
a<-table.element(a,'Gaussian',1,TRUE)
a<-table.element(a,mydensity1$x[mydensity1$y==max(mydensity1$y)],1)
a<-table.element(a,mydensity1$y[mydensity1$y==max(mydensity1$y)],1)
a<-table.row.end(a)
a<-table.row.start(a)
a<-table.element(a,'Epanechnikov',1,TRUE)
a<-table.element(a,mydensity2$x[mydensity2$y==max(mydensity2$y)],1)
a<-table.element(a,mydensity2$y[mydensity2$y==max(mydensity2$y)],1)
a<-table.row.end(a)
a<-table.row.start(a)
a<-table.element(a,'Rectangular',1,TRUE)
a<-table.element(a,mydensity3$x[mydensity3$y==max(mydensity3$y)],1)
a<-table.element(a,mydensity3$y[mydensity3$y==max(mydensity3$y)],1)
a<-table.row.end(a)
a<-table.row.start(a)
a<-table.element(a,'Triangular',1,TRUE)
a<-table.element(a,mydensity4$x[mydensity4$y==max(mydensity4$y)],1)
a<-table.element(a,mydensity4$y[mydensity4$y==max(mydensity4$y)],1)
a<-table.row.end(a)
a<-table.row.start(a)
a<-table.element(a,'Biweight',1,TRUE)
a<-table.element(a,mydensity5$x[mydensity5$y==max(mydensity5$y)],1)
a<-table.element(a,mydensity5$y[mydensity5$y==max(mydensity5$y)],1)
a<-table.row.end(a)
a<-table.row.start(a)
a<-table.element(a,'Cosine',1,TRUE)
a<-table.element(a,mydensity6$x[mydensity6$y==max(mydensity6$y)],1)
a<-table.element(a,mydensity6$y[mydensity6$y==max(mydensity6$y)],1)
a<-table.row.end(a)
a<-table.row.start(a)
a<-table.element(a,'Optcosine',1,TRUE)
a<-table.element(a,mydensity7$x[mydensity7$y==max(mydensity7$y)],1)
a<-table.element(a,mydensity7$y[mydensity7$y==max(mydensity7$y)],1)
a<-table.row.end(a)
a<-table.end(a)
table.save(a,file='mytable2.tab')
if (par2=='yes') {
a<-table.start()
a<-table.row.start(a)
a<-table.element(a,'Kernel Density Values',8,TRUE)
a<-table.row.end(a)
a<-table.row.start(a)
a<-table.element(a,'x-value',1,TRUE)
a<-table.element(a,'Gaussian',1,TRUE)
a<-table.element(a,'Epanechnikov',1,TRUE)
a<-table.element(a,'Rectangular',1,TRUE)
a<-table.element(a,'Triangular',1,TRUE)
a<-table.element(a,'Biweight',1,TRUE)
a<-table.element(a,'Cosine',1,TRUE)
a<-table.element(a,'Optcosine',1,TRUE)
a<-table.row.end(a)
for(i in 1:par3) {
a<-table.row.start(a)
a<-table.element(a,mydensity[i,8],1,TRUE)
for(j in 1:7) {
a<-table.element(a,mydensity[i,j],1)
}
a<-table.row.end(a)
}
a<-table.end(a)
table.save(a,file='mytable1.tab')
}