Free Statistics

of Irreproducible Research!

Author's title

Author*Unverified author*
R Software Modulerwasp_smp.wasp
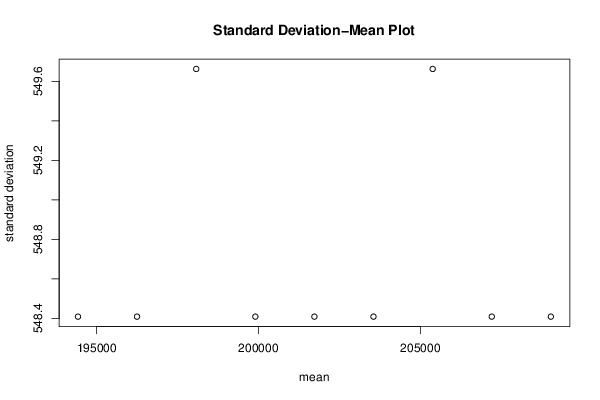
Title produced by softwareStandard Deviation-Mean Plot
Date of computationMon, 17 Aug 2015 00:25:52 +0100
Cite this page as followsStatistical Computations at FreeStatistics.org, Office for Research Development and Education, URL https://freestatistics.org/blog/index.php?v=date/2015/Aug/17/t14397676438mz958ab2fdbb7i.htm/, Retrieved Thu, 16 May 2024 02:40:51 +0000
Statistical Computations at FreeStatistics.org, Office for Research Development and Education, URL https://freestatistics.org/blog/index.php?pk=280229, Retrieved Thu, 16 May 2024 02:40:51 +0000
QR Codes:

Original text written by user:
IsPrivate?No (this computation is public)
User-defined keywords
Estimated Impact150
Family? (F = Feedback message, R = changed R code, M = changed R Module, P = changed Parameters, D = changed Data)
-     [Variability] [] [2014-11-24 12:14:04] [46d78fa4bef23992fc20db72a2a0da97]
- RMPD  [Central Tendency] [] [2015-08-16 17:50:33] [46d78fa4bef23992fc20db72a2a0da97]
- RMPD    [Standard Deviation-Mean Plot] [] [2015-08-16 20:08:52] [46d78fa4bef23992fc20db72a2a0da97]
- R  D        [Standard Deviation-Mean Plot] [] [2015-08-16 23:25:52] [fced41568b3cc41e6659ad201d611503] [Current]
Feedback Forum

Post a new message
Dataseries X:
193590
193745
193885
194040
194190
194345
194495
194650
194805
194955
195110
195260
195415
195570
195710
195865
196015
196170
196320
196475
196630
196780
196935
197085
197240
197395
197540
197695
197845
198000
198150
198305
198460
198610
198765
198915
199070
199225
199365
199520
199670
199825
199975
200130
200285
200435
200590
200740
200895
201050
201190
201345
201495
201650
201800
201955
202110
202260
202415
202565
202720
202875
203015
203170
203320
203475
203625
203780
203935
204085
204240
204390
204545
204700
204845
205000
205150
205305
205455
205610
205765
205915
206070
206220
206375
206530
206670
206825
206975
207130
207280
207435
207590
207740
207895
208045
208200
208355
208495
208650
208800
208955
209105
209260
209415
209565
209720
209870


Summary of computational transaction
Raw Inputview raw input (R code)
Raw Outputview raw output of R engine
Computing time1 seconds
R Server'Herman Ole Andreas Wold' @ wold.wessa.net

\begin{tabular}{lllllllll}
\hline
Summary of computational transaction \tabularnewline
Raw Input & view raw input (R code)  \tabularnewline
Raw Output & view raw output of R engine  \tabularnewline
Computing time & 1 seconds \tabularnewline
R Server & 'Herman Ole Andreas Wold' @ wold.wessa.net \tabularnewline
\hline
\end{tabular}
%Source: https://freestatistics.org/blog/index.php?pk=280229&T=0

[TABLE]
[ROW][C]Summary of computational transaction[/C][/ROW]
[ROW][C]Raw Input[/C][C]view raw input (R code) [/C][/ROW]
[ROW][C]Raw Output[/C][C]view raw output of R engine [/C][/ROW]
[ROW][C]Computing time[/C][C]1 seconds[/C][/ROW]
[ROW][C]R Server[/C][C]'Herman Ole Andreas Wold' @ wold.wessa.net[/C][/ROW]
[/TABLE]
Source: https://freestatistics.org/blog/index.php?pk=280229&T=0

Globally Unique Identifier (entire table): ba.freestatistics.org/blog/index.php?pk=280229&T=0

As an alternative you can also use a QR Code:  

The GUIDs for individual cells are displayed in the table below:

Summary of computational transaction
Raw Inputview raw input (R code)
Raw Outputview raw output of R engine
Computing time1 seconds
R Server'Herman Ole Andreas Wold' @ wold.wessa.net


Standard Deviation-Mean Plot
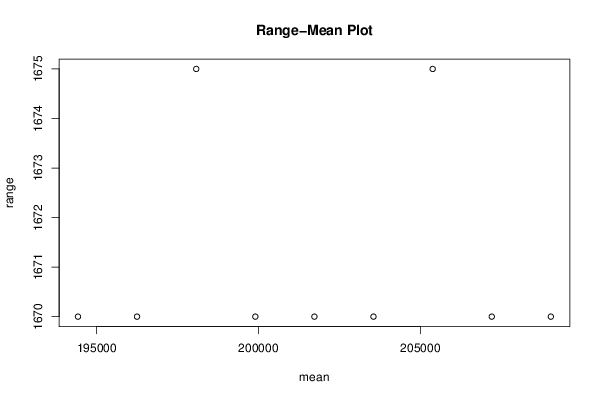
SectionMeanStandard DeviationRange
1194422.5548.4088554420621670
2196247.5548.4088554420621670
3198076.666666667549.6624308416831675
4199902.5548.4088554420621670
5201727.5548.4088554420621670
6203552.5548.4088554420621670
7205381.666666667549.6624308416831675
8207207.5548.4088554420621670
9209032.5548.4088554420621670

\begin{tabular}{lllllllll}
\hline
Standard Deviation-Mean Plot \tabularnewline
Section & Mean & Standard Deviation & Range \tabularnewline
1 & 194422.5 & 548.408855442062 & 1670 \tabularnewline
2 & 196247.5 & 548.408855442062 & 1670 \tabularnewline
3 & 198076.666666667 & 549.662430841683 & 1675 \tabularnewline
4 & 199902.5 & 548.408855442062 & 1670 \tabularnewline
5 & 201727.5 & 548.408855442062 & 1670 \tabularnewline
6 & 203552.5 & 548.408855442062 & 1670 \tabularnewline
7 & 205381.666666667 & 549.662430841683 & 1675 \tabularnewline
8 & 207207.5 & 548.408855442062 & 1670 \tabularnewline
9 & 209032.5 & 548.408855442062 & 1670 \tabularnewline
\hline
\end{tabular}
%Source: https://freestatistics.org/blog/index.php?pk=280229&T=1

[TABLE]
[ROW][C]Standard Deviation-Mean Plot[/C][/ROW]
[ROW][C]Section[/C][C]Mean[/C][C]Standard Deviation[/C][C]Range[/C][/ROW]
[ROW][C]1[/C][C]194422.5[/C][C]548.408855442062[/C][C]1670[/C][/ROW]
[ROW][C]2[/C][C]196247.5[/C][C]548.408855442062[/C][C]1670[/C][/ROW]
[ROW][C]3[/C][C]198076.666666667[/C][C]549.662430841683[/C][C]1675[/C][/ROW]
[ROW][C]4[/C][C]199902.5[/C][C]548.408855442062[/C][C]1670[/C][/ROW]
[ROW][C]5[/C][C]201727.5[/C][C]548.408855442062[/C][C]1670[/C][/ROW]
[ROW][C]6[/C][C]203552.5[/C][C]548.408855442062[/C][C]1670[/C][/ROW]
[ROW][C]7[/C][C]205381.666666667[/C][C]549.662430841683[/C][C]1675[/C][/ROW]
[ROW][C]8[/C][C]207207.5[/C][C]548.408855442062[/C][C]1670[/C][/ROW]
[ROW][C]9[/C][C]209032.5[/C][C]548.408855442062[/C][C]1670[/C][/ROW]
[/TABLE]
Source: https://freestatistics.org/blog/index.php?pk=280229&T=1

Globally Unique Identifier (entire table): ba.freestatistics.org/blog/index.php?pk=280229&T=1

As an alternative you can also use a QR Code:  

The GUIDs for individual cells are displayed in the table below:

Standard Deviation-Mean Plot
SectionMeanStandard DeviationRange
1194422.5548.4088554420621670
2196247.5548.4088554420621670
3198076.666666667549.6624308416831675
4199902.5548.4088554420621670
5201727.5548.4088554420621670
6203552.5548.4088554420621670
7205381.666666667549.6624308416831675
8207207.5548.4088554420621670
9209032.5548.4088554420621670


Regression: S.E.(k) = alpha + beta * Mean(k)
alpha548.68415178791
beta1.62395269056253e-08
S.D.4.17723124094836e-05
T-STAT0.000388762938149873
p-value0.999700659193441

\begin{tabular}{lllllllll}
\hline
Regression: S.E.(k) = alpha + beta * Mean(k) \tabularnewline
alpha & 548.68415178791 \tabularnewline
beta & 1.62395269056253e-08 \tabularnewline
S.D. & 4.17723124094836e-05 \tabularnewline
T-STAT & 0.000388762938149873 \tabularnewline
p-value & 0.999700659193441 \tabularnewline
\hline
\end{tabular}
%Source: https://freestatistics.org/blog/index.php?pk=280229&T=2

[TABLE]
[ROW][C]Regression: S.E.(k) = alpha + beta * Mean(k)[/C][/ROW]
[ROW][C]alpha[/C][C]548.68415178791[/C][/ROW]
[ROW][C]beta[/C][C]1.62395269056253e-08[/C][/ROW]
[ROW][C]S.D.[/C][C]4.17723124094836e-05[/C][/ROW]
[ROW][C]T-STAT[/C][C]0.000388762938149873[/C][/ROW]
[ROW][C]p-value[/C][C]0.999700659193441[/C][/ROW]
[/TABLE]
Source: https://freestatistics.org/blog/index.php?pk=280229&T=2

Globally Unique Identifier (entire table): ba.freestatistics.org/blog/index.php?pk=280229&T=2

As an alternative you can also use a QR Code:  

The GUIDs for individual cells are displayed in the table below:

Regression: S.E.(k) = alpha + beta * Mean(k)
alpha548.68415178791
beta1.62395269056253e-08
S.D.4.17723124094836e-05
T-STAT0.000388762938149873
p-value0.999700659193441


Regression: ln S.E.(k) = alpha + beta * ln Mean(k)
alpha6.30621571462283
beta0.000107476872866893
S.D.0.0153422523729666
T-STAT0.00700528646343148
p-value0.994606099620975
Lambda0.999892523127133

\begin{tabular}{lllllllll}
\hline
Regression: ln S.E.(k) = alpha + beta * ln Mean(k) \tabularnewline
alpha & 6.30621571462283 \tabularnewline
beta & 0.000107476872866893 \tabularnewline
S.D. & 0.0153422523729666 \tabularnewline
T-STAT & 0.00700528646343148 \tabularnewline
p-value & 0.994606099620975 \tabularnewline
Lambda & 0.999892523127133 \tabularnewline
\hline
\end{tabular}
%Source: https://freestatistics.org/blog/index.php?pk=280229&T=3

[TABLE]
[ROW][C]Regression: ln S.E.(k) = alpha + beta * ln Mean(k)[/C][/ROW]
[ROW][C]alpha[/C][C]6.30621571462283[/C][/ROW]
[ROW][C]beta[/C][C]0.000107476872866893[/C][/ROW]
[ROW][C]S.D.[/C][C]0.0153422523729666[/C][/ROW]
[ROW][C]T-STAT[/C][C]0.00700528646343148[/C][/ROW]
[ROW][C]p-value[/C][C]0.994606099620975[/C][/ROW]
[ROW][C]Lambda[/C][C]0.999892523127133[/C][/ROW]
[/TABLE]
Source: https://freestatistics.org/blog/index.php?pk=280229&T=3

Globally Unique Identifier (entire table): ba.freestatistics.org/blog/index.php?pk=280229&T=3

As an alternative you can also use a QR Code:  

The GUIDs for individual cells are displayed in the table below:

Regression: ln S.E.(k) = alpha + beta * ln Mean(k)
alpha6.30621571462283
beta0.000107476872866893
S.D.0.0153422523729666
T-STAT0.00700528646343148
p-value0.994606099620975
Lambda0.999892523127133


Parameters (Session):
par1 = 12 ;
Parameters (R input):
par1 = 12 ;
R code (references can be found in the software module):
par1 <- as.numeric(par1)
(n <- length(x))
(np <- floor(n / par1))
arr <- array(NA,dim=c(par1,np))
j <- 0
k <- 1
for (i in 1:(np*par1))
{
j = j + 1
arr[j,k] <- x[i]
if (j == par1) {
j = 0
k=k+1
}
}
arr
arr.mean <- array(NA,dim=np)
arr.sd <- array(NA,dim=np)
arr.range <- array(NA,dim=np)
for (j in 1:np)
{
arr.mean[j] <- mean(arr[,j],na.rm=TRUE)
arr.sd[j] <- sd(arr[,j],na.rm=TRUE)
arr.range[j] <- max(arr[,j],na.rm=TRUE) - min(arr[,j],na.rm=TRUE)
}
arr.mean
arr.sd
arr.range
(lm1 <- lm(arr.sd~arr.mean))
(lnlm1 <- lm(log(arr.sd)~log(arr.mean)))
(lm2 <- lm(arr.range~arr.mean))
bitmap(file='test1.png')
plot(arr.mean,arr.sd,main='Standard Deviation-Mean Plot',xlab='mean',ylab='standard deviation')
dev.off()
bitmap(file='test2.png')
plot(arr.mean,arr.range,main='Range-Mean Plot',xlab='mean',ylab='range')
dev.off()
load(file='createtable')
a<-table.start()
a<-table.row.start(a)
a<-table.element(a,'Standard Deviation-Mean Plot',4,TRUE)
a<-table.row.end(a)
a<-table.row.start(a)
a<-table.element(a,'Section',header=TRUE)
a<-table.element(a,'Mean',header=TRUE)
a<-table.element(a,'Standard Deviation',header=TRUE)
a<-table.element(a,'Range',header=TRUE)
a<-table.row.end(a)
for (j in 1:np) {
a<-table.row.start(a)
a<-table.element(a,j,header=TRUE)
a<-table.element(a,arr.mean[j])
a<-table.element(a,arr.sd[j] )
a<-table.element(a,arr.range[j] )
a<-table.row.end(a)
}
a<-table.end(a)
table.save(a,file='mytable.tab')
a<-table.start()
a<-table.row.start(a)
a<-table.element(a,'Regression: S.E.(k) = alpha + beta * Mean(k)',2,TRUE)
a<-table.row.end(a)
a<-table.row.start(a)
a<-table.element(a,'alpha',header=TRUE)
a<-table.element(a,lm1$coefficients[[1]])
a<-table.row.end(a)
a<-table.row.start(a)
a<-table.element(a,'beta',header=TRUE)
a<-table.element(a,lm1$coefficients[[2]])
a<-table.row.end(a)
a<-table.row.start(a)
a<-table.element(a,'S.D.',header=TRUE)
a<-table.element(a,summary(lm1)$coefficients[2,2])
a<-table.row.end(a)
a<-table.row.start(a)
a<-table.element(a,'T-STAT',header=TRUE)
a<-table.element(a,summary(lm1)$coefficients[2,3])
a<-table.row.end(a)
a<-table.row.start(a)
a<-table.element(a,'p-value',header=TRUE)
a<-table.element(a,summary(lm1)$coefficients[2,4])
a<-table.row.end(a)
a<-table.end(a)
table.save(a,file='mytable1.tab')
a<-table.start()
a<-table.row.start(a)
a<-table.element(a,'Regression: ln S.E.(k) = alpha + beta * ln Mean(k)',2,TRUE)
a<-table.row.end(a)
a<-table.row.start(a)
a<-table.element(a,'alpha',header=TRUE)
a<-table.element(a,lnlm1$coefficients[[1]])
a<-table.row.end(a)
a<-table.row.start(a)
a<-table.element(a,'beta',header=TRUE)
a<-table.element(a,lnlm1$coefficients[[2]])
a<-table.row.end(a)
a<-table.row.start(a)
a<-table.element(a,'S.D.',header=TRUE)
a<-table.element(a,summary(lnlm1)$coefficients[2,2])
a<-table.row.end(a)
a<-table.row.start(a)
a<-table.element(a,'T-STAT',header=TRUE)
a<-table.element(a,summary(lnlm1)$coefficients[2,3])
a<-table.row.end(a)
a<-table.row.start(a)
a<-table.element(a,'p-value',header=TRUE)
a<-table.element(a,summary(lnlm1)$coefficients[2,4])
a<-table.row.end(a)
a<-table.row.start(a)
a<-table.element(a,'Lambda',header=TRUE)
a<-table.element(a,1-lnlm1$coefficients[[2]])
a<-table.row.end(a)
a<-table.end(a)
table.save(a,file='mytable2.tab')