Free Statistics

of Irreproducible Research!

Author's title

Author*The author of this computation has been verified*
R Software Modulerwasp_histogram.wasp
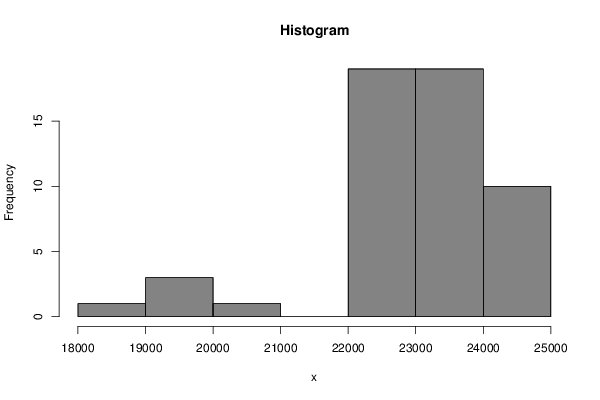
Title produced by softwareHistogram
Date of computationTue, 01 Dec 2015 12:31:52 +0000
Cite this page as followsStatistical Computations at FreeStatistics.org, Office for Research Development and Education, URL https://freestatistics.org/blog/index.php?v=date/2015/Dec/01/t14489742658g8dyn6sd2pwun3.htm/, Retrieved Thu, 16 May 2024 10:04:22 +0000
Statistical Computations at FreeStatistics.org, Office for Research Development and Education, URL https://freestatistics.org/blog/index.php?pk=284707, Retrieved Thu, 16 May 2024 10:04:22 +0000
QR Codes:

Original text written by user:
IsPrivate?No (this computation is public)
User-defined keywordsAnderlecht
Estimated Impact61
Family? (F = Feedback message, R = changed R code, M = changed R Module, P = changed Parameters, D = changed Data)
-       [Histogram] [Histogram van Toe...] [2015-12-01 12:31:52] [7f15ad2b324a02cb27046274e327e025] [Current]
Feedback Forum

Post a new message
Dataseries X:
23867
24107
24041
24415
24496
24022
24367
23869
24495
23818
24081
24132
23651
23622
23726
23942
24573
23085
22612
22960
22921
23510
22729
23047
22850
23426
22812
22446
23567
23185
22777
23508
23193
23006
22332
22347
23061
22887
22890
22701
22467
22357
22443
22824
22906
23059
23055
22564
18570
20329
19279
19541
19517


Summary of computational transaction
Raw Inputview raw input (R code)
Raw Outputview raw output of R engine
Computing time0 seconds
R Server'Sir Ronald Aylmer Fisher' @ fisher.wessa.net

\begin{tabular}{lllllllll}
\hline
Summary of computational transaction \tabularnewline
Raw Input & view raw input (R code)  \tabularnewline
Raw Output & view raw output of R engine  \tabularnewline
Computing time & 0 seconds \tabularnewline
R Server & 'Sir Ronald Aylmer Fisher' @ fisher.wessa.net \tabularnewline
\hline
\end{tabular}
%Source: https://freestatistics.org/blog/index.php?pk=284707&T=0

[TABLE]
[ROW][C]Summary of computational transaction[/C][/ROW]
[ROW][C]Raw Input[/C][C]view raw input (R code) [/C][/ROW]
[ROW][C]Raw Output[/C][C]view raw output of R engine [/C][/ROW]
[ROW][C]Computing time[/C][C]0 seconds[/C][/ROW]
[ROW][C]R Server[/C][C]'Sir Ronald Aylmer Fisher' @ fisher.wessa.net[/C][/ROW]
[/TABLE]
Source: https://freestatistics.org/blog/index.php?pk=284707&T=0

Globally Unique Identifier (entire table): ba.freestatistics.org/blog/index.php?pk=284707&T=0

As an alternative you can also use a QR Code:  

The GUIDs for individual cells are displayed in the table below:

Summary of computational transaction
Raw Inputview raw input (R code)
Raw Outputview raw output of R engine
Computing time0 seconds
R Server'Sir Ronald Aylmer Fisher' @ fisher.wessa.net


Frequency Table (Histogram)
BinsMidpointAbs. FrequencyRel. FrequencyCumul. Rel. Freq.Density
[18000,19000[1850010.0188680.0188681.9e-05
[19000,20000[1950030.0566040.0754725.7e-05
[20000,21000[2050010.0188680.094341.9e-05
[21000,22000[21500000.094340
[22000,23000[22500190.3584910.452830.000358
[23000,24000[23500190.3584910.8113210.000358
[24000,25000]24500100.18867910.000189

\begin{tabular}{lllllllll}
\hline
Frequency Table (Histogram) \tabularnewline
Bins & Midpoint & Abs. Frequency & Rel. Frequency & Cumul. Rel. Freq. & Density \tabularnewline
[18000,19000[ & 18500 & 1 & 0.018868 & 0.018868 & 1.9e-05 \tabularnewline
[19000,20000[ & 19500 & 3 & 0.056604 & 0.075472 & 5.7e-05 \tabularnewline
[20000,21000[ & 20500 & 1 & 0.018868 & 0.09434 & 1.9e-05 \tabularnewline
[21000,22000[ & 21500 & 0 & 0 & 0.09434 & 0 \tabularnewline
[22000,23000[ & 22500 & 19 & 0.358491 & 0.45283 & 0.000358 \tabularnewline
[23000,24000[ & 23500 & 19 & 0.358491 & 0.811321 & 0.000358 \tabularnewline
[24000,25000] & 24500 & 10 & 0.188679 & 1 & 0.000189 \tabularnewline
\hline
\end{tabular}
%Source: https://freestatistics.org/blog/index.php?pk=284707&T=1

[TABLE]
[ROW][C]Frequency Table (Histogram)[/C][/ROW]
[ROW][C]Bins[/C][C]Midpoint[/C][C]Abs. Frequency[/C][C]Rel. Frequency[/C][C]Cumul. Rel. Freq.[/C][C]Density[/C][/ROW]
[ROW][C][18000,19000[[/C][C]18500[/C][C]1[/C][C]0.018868[/C][C]0.018868[/C][C]1.9e-05[/C][/ROW]
[ROW][C][19000,20000[[/C][C]19500[/C][C]3[/C][C]0.056604[/C][C]0.075472[/C][C]5.7e-05[/C][/ROW]
[ROW][C][20000,21000[[/C][C]20500[/C][C]1[/C][C]0.018868[/C][C]0.09434[/C][C]1.9e-05[/C][/ROW]
[ROW][C][21000,22000[[/C][C]21500[/C][C]0[/C][C]0[/C][C]0.09434[/C][C]0[/C][/ROW]
[ROW][C][22000,23000[[/C][C]22500[/C][C]19[/C][C]0.358491[/C][C]0.45283[/C][C]0.000358[/C][/ROW]
[ROW][C][23000,24000[[/C][C]23500[/C][C]19[/C][C]0.358491[/C][C]0.811321[/C][C]0.000358[/C][/ROW]
[ROW][C][24000,25000][/C][C]24500[/C][C]10[/C][C]0.188679[/C][C]1[/C][C]0.000189[/C][/ROW]
[/TABLE]
Source: https://freestatistics.org/blog/index.php?pk=284707&T=1

Globally Unique Identifier (entire table): ba.freestatistics.org/blog/index.php?pk=284707&T=1

As an alternative you can also use a QR Code:  

The GUIDs for individual cells are displayed in the table below:

Frequency Table (Histogram)
BinsMidpointAbs. FrequencyRel. FrequencyCumul. Rel. Freq.Density
[18000,19000[1850010.0188680.0188681.9e-05
[19000,20000[1950030.0566040.0754725.7e-05
[20000,21000[2050010.0188680.094341.9e-05
[21000,22000[21500000.094340
[22000,23000[22500190.3584910.452830.000358
[23000,24000[23500190.3584910.8113210.000358
[24000,25000]24500100.18867910.000189


Parameters (Session):
Parameters (R input):
par1 = ; par2 = grey ; par3 = FALSE ; par4 = Unknown ;
R code (references can be found in the software module):
par1 <- as.numeric(par1)
if (par3 == 'TRUE') par3 <- TRUE
if (par3 == 'FALSE') par3 <- FALSE
if (par4 == 'Unknown') par1 <- as.numeric(par1)
if (par4 == 'Interval/Ratio') par1 <- as.numeric(par1)
if (par4 == '3-point Likert') par1 <- c(1:3 - 0.5, 3.5)
if (par4 == '4-point Likert') par1 <- c(1:4 - 0.5, 4.5)
if (par4 == '5-point Likert') par1 <- c(1:5 - 0.5, 5.5)
if (par4 == '6-point Likert') par1 <- c(1:6 - 0.5, 6.5)
if (par4 == '7-point Likert') par1 <- c(1:7 - 0.5, 7.5)
if (par4 == '8-point Likert') par1 <- c(1:8 - 0.5, 8.5)
if (par4 == '9-point Likert') par1 <- c(1:9 - 0.5, 9.5)
if (par4 == '10-point Likert') par1 <- c(1:10 - 0.5, 10.5)
bitmap(file='test1.png')
if(is.numeric(x[1])) {
if (is.na(par1)) {
myhist<-hist(x,col=par2,main=main,xlab=xlab,right=par3)
} else {
if (par1 < 0) par1 <- 3
if (par1 > 50) par1 <- 50
myhist<-hist(x,breaks=par1,col=par2,main=main,xlab=xlab,right=par3)
}
} else {
barplot(mytab <- sort(table(x),T),col=par2,main='Frequency Plot',xlab=xlab,ylab='Absolute Frequency')
}
dev.off()
if(is.numeric(x[1])) {
myhist
n <- length(x)
load(file='createtable')
a<-table.start()
a<-table.row.start(a)
a<-table.element(a,hyperlink('histogram.htm','Frequency Table (Histogram)',''),6,TRUE)
a<-table.row.end(a)
a<-table.row.start(a)
a<-table.element(a,'Bins',header=TRUE)
a<-table.element(a,'Midpoint',header=TRUE)
a<-table.element(a,'Abs. Frequency',header=TRUE)
a<-table.element(a,'Rel. Frequency',header=TRUE)
a<-table.element(a,'Cumul. Rel. Freq.',header=TRUE)
a<-table.element(a,'Density',header=TRUE)
a<-table.row.end(a)
crf <- 0
if (par3 == FALSE) mybracket <- '[' else mybracket <- ']'
mynumrows <- (length(myhist$breaks)-1)
for (i in 1:mynumrows) {
a<-table.row.start(a)
if (i == 1)
dum <- paste('[',myhist$breaks[i],sep='')
else
dum <- paste(mybracket,myhist$breaks[i],sep='')
dum <- paste(dum,myhist$breaks[i+1],sep=',')
if (i==mynumrows)
dum <- paste(dum,']',sep='')
else
dum <- paste(dum,mybracket,sep='')
a<-table.element(a,dum,header=TRUE)
a<-table.element(a,myhist$mids[i])
a<-table.element(a,myhist$counts[i])
rf <- myhist$counts[i]/n
crf <- crf + rf
a<-table.element(a,round(rf,6))
a<-table.element(a,round(crf,6))
a<-table.element(a,round(myhist$density[i],6))
a<-table.row.end(a)
}
a<-table.end(a)
table.save(a,file='mytable.tab')
} else {
mytab
reltab <- mytab / sum(mytab)
n <- length(mytab)
load(file='createtable')
a<-table.start()
a<-table.row.start(a)
a<-table.element(a,'Frequency Table (Categorical Data)',3,TRUE)
a<-table.row.end(a)
a<-table.row.start(a)
a<-table.element(a,'Category',header=TRUE)
a<-table.element(a,'Abs. Frequency',header=TRUE)
a<-table.element(a,'Rel. Frequency',header=TRUE)
a<-table.row.end(a)
for (i in 1:n) {
a<-table.row.start(a)
a<-table.element(a,labels(mytab)$x[i],header=TRUE)
a<-table.element(a,mytab[i])
a<-table.element(a,round(reltab[i],4))
a<-table.row.end(a)
}
a<-table.end(a)
table.save(a,file='mytable1.tab')
}