Free Statistics

of Irreproducible Research!

Author's title

Author*The author of this computation has been verified*
R Software Modulerwasp_multipleregression.wasp
Title produced by softwareMultiple Regression
Date of computationWed, 02 Dec 2015 18:27:35 +0000
Cite this page as followsStatistical Computations at FreeStatistics.org, Office for Research Development and Education, URL https://freestatistics.org/blog/index.php?v=date/2015/Dec/02/t1449081235iiwhm22ijkhcik9.htm/, Retrieved Fri, 17 May 2024 18:45:46 +0000
Statistical Computations at FreeStatistics.org, Office for Research Development and Education, URL https://freestatistics.org/blog/index.php?pk=284871, Retrieved Fri, 17 May 2024 18:45:46 +0000
QR Codes:

Original text written by user:
IsPrivate?No (this computation is public)
User-defined keywords
Estimated Impact74
Family? (F = Feedback message, R = changed R code, M = changed R Module, P = changed Parameters, D = changed Data)
-       [Multiple Regression] [multiple regressi...] [2015-12-02 18:27:35] [20fcaaf1d4bc4a12bf87c6c50d624c14] [Current]
- R       [Multiple Regression] [multiple regressi...] [2015-12-02 18:38:04] [22b6f4a061c8797aa483199554a73d13]
- RMPD    [One Sample Tests about the Mean] [p-value mannen] [2015-12-02 18:39:34] [22b6f4a061c8797aa483199554a73d13]
- R P       [One Sample Tests about the Mean] [p-value mannen 1 ...] [2015-12-02 18:50:37] [22b6f4a061c8797aa483199554a73d13]
- R           [One Sample Tests about the Mean] [p-value mannen 1 ...] [2015-12-02 18:51:53] [22b6f4a061c8797aa483199554a73d13]
-               [One Sample Tests about the Mean] [p-value mannen 1 ...] [2015-12-02 18:53:22] [22b6f4a061c8797aa483199554a73d13]
- RMP       [Testing Mean with unknown Variance - Critical Value] [] [2015-12-17 20:33:12] [22b6f4a061c8797aa483199554a73d13]
-             [Testing Mean with unknown Variance - Critical Value] [] [2015-12-17 20:34:27] [22b6f4a061c8797aa483199554a73d13]
Feedback Forum

Post a new message
Dataseries X:
276444 287224
268606 279998
267679 283495
269879 285775
265641 282329
262525 277799
258597 271980
253849 266730
256221 262433
286895 285378
294610 286692
280363 282917
269926 277686
264341 274371
263269 277466
271045 290604
267915 290770
262078 283654
257751 278601
253271 274405
257638 272817
287452 294292
298152 300562
284793 298982
274560 296917
268270 295008
267577 297295
271866 305671
268546 303853
264722 300708
262425 298194
258973 292254
262751 290646
296186 314707
304659 317009
295442 317706
285466 313312
279575 311048
279985 315917
286012 326174
281337 322116
276270 317092
271472 310468
265637 302438
268974 298493
299299 320124
305452 321873
295468 321676
285584 316696
278204 312612
276505 313307
279732 320883
276980 318749
271832 315126
263105 304600
256162 295245
260705 293619
285857 309700
291870 310597
280358 307416
270981 301126


Summary of computational transaction
Raw Inputview raw input (R code)
Raw Outputview raw output of R engine
Computing time6 seconds
R Server'George Udny Yule' @ yule.wessa.net

\begin{tabular}{lllllllll}
\hline
Summary of computational transaction \tabularnewline
Raw Input & view raw input (R code)  \tabularnewline
Raw Output & view raw output of R engine  \tabularnewline
Computing time & 6 seconds \tabularnewline
R Server & 'George Udny Yule' @ yule.wessa.net \tabularnewline
\hline
\end{tabular}
%Source: https://freestatistics.org/blog/index.php?pk=284871&T=0

[TABLE]
[ROW][C]Summary of computational transaction[/C][/ROW]
[ROW][C]Raw Input[/C][C]view raw input (R code) [/C][/ROW]
[ROW][C]Raw Output[/C][C]view raw output of R engine [/C][/ROW]
[ROW][C]Computing time[/C][C]6 seconds[/C][/ROW]
[ROW][C]R Server[/C][C]'George Udny Yule' @ yule.wessa.net[/C][/ROW]
[/TABLE]
Source: https://freestatistics.org/blog/index.php?pk=284871&T=0

Globally Unique Identifier (entire table): ba.freestatistics.org/blog/index.php?pk=284871&T=0

As an alternative you can also use a QR Code:  

The GUIDs for individual cells are displayed in the table below:

Summary of computational transaction
Raw Inputview raw input (R code)
Raw Outputview raw output of R engine
Computing time6 seconds
R Server'George Udny Yule' @ yule.wessa.net


Multiple Linear Regression - Estimated Regression Equation
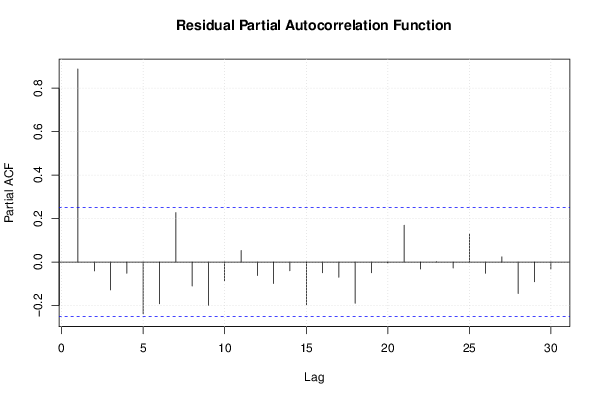
WLH_Tot_V[t] = + 108418 + 0.616701WLH_Tot_M[t] -7206.48M1[t] -11310.1M2[t] -13618.8M3[t] -13780.3M4[t] -15741.8M5[t] -17180.4M6[t] -17960.5M7[t] -18741.2M8[t] -13181.5M9[t] + 3869.61M10[t] + 10403.7M11[t] -268.966t + e[t]
Warning: you did not specify the column number of the endogenous series! The first column was selected by default.

\begin{tabular}{lllllllll}
\hline
Multiple Linear Regression - Estimated Regression Equation \tabularnewline
WLH_Tot_V[t] =  +  108418 +  0.616701WLH_Tot_M[t] -7206.48M1[t] -11310.1M2[t] -13618.8M3[t] -13780.3M4[t] -15741.8M5[t] -17180.4M6[t] -17960.5M7[t] -18741.2M8[t] -13181.5M9[t] +  3869.61M10[t] +  10403.7M11[t] -268.966t  + e[t] \tabularnewline
Warning: you did not specify the column number of the endogenous series! The first column was selected by default. \tabularnewline
\hline
\end{tabular}
%Source: https://freestatistics.org/blog/index.php?pk=284871&T=1

[TABLE]
[ROW][C]Multiple Linear Regression - Estimated Regression Equation[/C][/ROW]
[ROW][C]WLH_Tot_V[t] =  +  108418 +  0.616701WLH_Tot_M[t] -7206.48M1[t] -11310.1M2[t] -13618.8M3[t] -13780.3M4[t] -15741.8M5[t] -17180.4M6[t] -17960.5M7[t] -18741.2M8[t] -13181.5M9[t] +  3869.61M10[t] +  10403.7M11[t] -268.966t  + e[t][/C][/ROW]
[ROW][C]Warning: you did not specify the column number of the endogenous series! The first column was selected by default.[/C][/ROW]
[/TABLE]
Source: https://freestatistics.org/blog/index.php?pk=284871&T=1

Globally Unique Identifier (entire table): ba.freestatistics.org/blog/index.php?pk=284871&T=1

As an alternative you can also use a QR Code:  

The GUIDs for individual cells are displayed in the table below:

Multiple Linear Regression - Estimated Regression Equation
WLH_Tot_V[t] = + 108418 + 0.616701WLH_Tot_M[t] -7206.48M1[t] -11310.1M2[t] -13618.8M3[t] -13780.3M4[t] -15741.8M5[t] -17180.4M6[t] -17960.5M7[t] -18741.2M8[t] -13181.5M9[t] + 3869.61M10[t] + 10403.7M11[t] -268.966t + e[t]
Warning: you did not specify the column number of the endogenous series! The first column was selected by default.


Multiple Linear Regression - Ordinary Least Squares
VariableParameterS.D.T-STATH0: parameter = 02-tail p-value1-tail p-value
(Intercept)+1.084e+05 9992+1.0850e+01 2.154e-14 1.077e-14
WLH_Tot_M+0.6167 0.03552+1.7360e+01 4.453e-22 2.226e-22
M1-7206 1232-5.8510e+00 4.514e-07 2.257e-07
M2-1.131e+04 1294-8.7390e+00 2.06e-11 1.03e-11
M3-1.362e+04 1287-1.0580e+01 4.956e-14 2.478e-14
M4-1.378e+04 1300-1.0600e+01 4.774e-14 2.387e-14
M5-1.574e+04 1286-1.2240e+01 3.223e-16 1.611e-16
M6-1.718e+04 1284-1.3380e+01 1.225e-17 6.125e-18
M7-1.796e+04 1323-1.3580e+01 6.983e-18 3.491e-18
M8-1.874e+04 1409-1.3300e+01 1.528e-17 7.639e-18
M9-1.318e+04 1462-9.0130e+00 8.199e-12 4.1e-12
M10+3870 1279+3.0260e+00 0.004007 0.002003
M11+1.04e+04 1281+8.1220e+00 1.674e-10 8.372e-11
t-269 29.68-9.0640e+00 6.925e-12 3.462e-12

\begin{tabular}{lllllllll}
\hline
Multiple Linear Regression - Ordinary Least Squares \tabularnewline
Variable & Parameter & S.D. & T-STATH0: parameter = 0 & 2-tail p-value & 1-tail p-value \tabularnewline
(Intercept) & +1.084e+05 &  9992 & +1.0850e+01 &  2.154e-14 &  1.077e-14 \tabularnewline
WLH_Tot_M & +0.6167 &  0.03552 & +1.7360e+01 &  4.453e-22 &  2.226e-22 \tabularnewline
M1 & -7206 &  1232 & -5.8510e+00 &  4.514e-07 &  2.257e-07 \tabularnewline
M2 & -1.131e+04 &  1294 & -8.7390e+00 &  2.06e-11 &  1.03e-11 \tabularnewline
M3 & -1.362e+04 &  1287 & -1.0580e+01 &  4.956e-14 &  2.478e-14 \tabularnewline
M4 & -1.378e+04 &  1300 & -1.0600e+01 &  4.774e-14 &  2.387e-14 \tabularnewline
M5 & -1.574e+04 &  1286 & -1.2240e+01 &  3.223e-16 &  1.611e-16 \tabularnewline
M6 & -1.718e+04 &  1284 & -1.3380e+01 &  1.225e-17 &  6.125e-18 \tabularnewline
M7 & -1.796e+04 &  1323 & -1.3580e+01 &  6.983e-18 &  3.491e-18 \tabularnewline
M8 & -1.874e+04 &  1409 & -1.3300e+01 &  1.528e-17 &  7.639e-18 \tabularnewline
M9 & -1.318e+04 &  1462 & -9.0130e+00 &  8.199e-12 &  4.1e-12 \tabularnewline
M10 & +3870 &  1279 & +3.0260e+00 &  0.004007 &  0.002003 \tabularnewline
M11 & +1.04e+04 &  1281 & +8.1220e+00 &  1.674e-10 &  8.372e-11 \tabularnewline
t & -269 &  29.68 & -9.0640e+00 &  6.925e-12 &  3.462e-12 \tabularnewline
\hline
\end{tabular}
%Source: https://freestatistics.org/blog/index.php?pk=284871&T=2

[TABLE]
[ROW][C]Multiple Linear Regression - Ordinary Least Squares[/C][/ROW]
[ROW][C]Variable[/C][C]Parameter[/C][C]S.D.[/C][C]T-STATH0: parameter = 0[/C][C]2-tail p-value[/C][C]1-tail p-value[/C][/ROW]
[ROW][C](Intercept)[/C][C]+1.084e+05[/C][C] 9992[/C][C]+1.0850e+01[/C][C] 2.154e-14[/C][C] 1.077e-14[/C][/ROW]
[ROW][C]WLH_Tot_M[/C][C]+0.6167[/C][C] 0.03552[/C][C]+1.7360e+01[/C][C] 4.453e-22[/C][C] 2.226e-22[/C][/ROW]
[ROW][C]M1[/C][C]-7206[/C][C] 1232[/C][C]-5.8510e+00[/C][C] 4.514e-07[/C][C] 2.257e-07[/C][/ROW]
[ROW][C]M2[/C][C]-1.131e+04[/C][C] 1294[/C][C]-8.7390e+00[/C][C] 2.06e-11[/C][C] 1.03e-11[/C][/ROW]
[ROW][C]M3[/C][C]-1.362e+04[/C][C] 1287[/C][C]-1.0580e+01[/C][C] 4.956e-14[/C][C] 2.478e-14[/C][/ROW]
[ROW][C]M4[/C][C]-1.378e+04[/C][C] 1300[/C][C]-1.0600e+01[/C][C] 4.774e-14[/C][C] 2.387e-14[/C][/ROW]
[ROW][C]M5[/C][C]-1.574e+04[/C][C] 1286[/C][C]-1.2240e+01[/C][C] 3.223e-16[/C][C] 1.611e-16[/C][/ROW]
[ROW][C]M6[/C][C]-1.718e+04[/C][C] 1284[/C][C]-1.3380e+01[/C][C] 1.225e-17[/C][C] 6.125e-18[/C][/ROW]
[ROW][C]M7[/C][C]-1.796e+04[/C][C] 1323[/C][C]-1.3580e+01[/C][C] 6.983e-18[/C][C] 3.491e-18[/C][/ROW]
[ROW][C]M8[/C][C]-1.874e+04[/C][C] 1409[/C][C]-1.3300e+01[/C][C] 1.528e-17[/C][C] 7.639e-18[/C][/ROW]
[ROW][C]M9[/C][C]-1.318e+04[/C][C] 1462[/C][C]-9.0130e+00[/C][C] 8.199e-12[/C][C] 4.1e-12[/C][/ROW]
[ROW][C]M10[/C][C]+3870[/C][C] 1279[/C][C]+3.0260e+00[/C][C] 0.004007[/C][C] 0.002003[/C][/ROW]
[ROW][C]M11[/C][C]+1.04e+04[/C][C] 1281[/C][C]+8.1220e+00[/C][C] 1.674e-10[/C][C] 8.372e-11[/C][/ROW]
[ROW][C]t[/C][C]-269[/C][C] 29.68[/C][C]-9.0640e+00[/C][C] 6.925e-12[/C][C] 3.462e-12[/C][/ROW]
[/TABLE]
Source: https://freestatistics.org/blog/index.php?pk=284871&T=2

Globally Unique Identifier (entire table): ba.freestatistics.org/blog/index.php?pk=284871&T=2

As an alternative you can also use a QR Code:  

The GUIDs for individual cells are displayed in the table below:

Multiple Linear Regression - Ordinary Least Squares
VariableParameterS.D.T-STATH0: parameter = 02-tail p-value1-tail p-value
(Intercept)+1.084e+05 9992+1.0850e+01 2.154e-14 1.077e-14
WLH_Tot_M+0.6167 0.03552+1.7360e+01 4.453e-22 2.226e-22
M1-7206 1232-5.8510e+00 4.514e-07 2.257e-07
M2-1.131e+04 1294-8.7390e+00 2.06e-11 1.03e-11
M3-1.362e+04 1287-1.0580e+01 4.956e-14 2.478e-14
M4-1.378e+04 1300-1.0600e+01 4.774e-14 2.387e-14
M5-1.574e+04 1286-1.2240e+01 3.223e-16 1.611e-16
M6-1.718e+04 1284-1.3380e+01 1.225e-17 6.125e-18
M7-1.796e+04 1323-1.3580e+01 6.983e-18 3.491e-18
M8-1.874e+04 1409-1.3300e+01 1.528e-17 7.639e-18
M9-1.318e+04 1462-9.0130e+00 8.199e-12 4.1e-12
M10+3870 1279+3.0260e+00 0.004007 0.002003
M11+1.04e+04 1281+8.1220e+00 1.674e-10 8.372e-11
t-269 29.68-9.0640e+00 6.925e-12 3.462e-12


Multiple Linear Regression - Regression Statistics
Multiple R 0.9909
R-squared 0.9819
Adjusted R-squared 0.9769
F-TEST (value) 196.3
F-TEST (DF numerator)13
F-TEST (DF denominator)47
p-value 0
Multiple Linear Regression - Residual Statistics
Residual Standard Deviation 2021
Sum Squared Residuals 1.919e+08

\begin{tabular}{lllllllll}
\hline
Multiple Linear Regression - Regression Statistics \tabularnewline
Multiple R &  0.9909 \tabularnewline
R-squared &  0.9819 \tabularnewline
Adjusted R-squared &  0.9769 \tabularnewline
F-TEST (value) &  196.3 \tabularnewline
F-TEST (DF numerator) & 13 \tabularnewline
F-TEST (DF denominator) & 47 \tabularnewline
p-value &  0 \tabularnewline
Multiple Linear Regression - Residual Statistics \tabularnewline
Residual Standard Deviation &  2021 \tabularnewline
Sum Squared Residuals &  1.919e+08 \tabularnewline
\hline
\end{tabular}
%Source: https://freestatistics.org/blog/index.php?pk=284871&T=3

[TABLE]
[ROW][C]Multiple Linear Regression - Regression Statistics[/C][/ROW]
[ROW][C]Multiple R[/C][C] 0.9909[/C][/ROW]
[ROW][C]R-squared[/C][C] 0.9819[/C][/ROW]
[ROW][C]Adjusted R-squared[/C][C] 0.9769[/C][/ROW]
[ROW][C]F-TEST (value)[/C][C] 196.3[/C][/ROW]
[ROW][C]F-TEST (DF numerator)[/C][C]13[/C][/ROW]
[ROW][C]F-TEST (DF denominator)[/C][C]47[/C][/ROW]
[ROW][C]p-value[/C][C] 0[/C][/ROW]
[ROW][C]Multiple Linear Regression - Residual Statistics[/C][/ROW]
[ROW][C]Residual Standard Deviation[/C][C] 2021[/C][/ROW]
[ROW][C]Sum Squared Residuals[/C][C] 1.919e+08[/C][/ROW]
[/TABLE]
Source: https://freestatistics.org/blog/index.php?pk=284871&T=3

Globally Unique Identifier (entire table): ba.freestatistics.org/blog/index.php?pk=284871&T=3

As an alternative you can also use a QR Code:  

The GUIDs for individual cells are displayed in the table below:

Multiple Linear Regression - Regression Statistics
Multiple R 0.9909
R-squared 0.9819
Adjusted R-squared 0.9769
F-TEST (value) 196.3
F-TEST (DF numerator)13
F-TEST (DF denominator)47
p-value 0
Multiple Linear Regression - Residual Statistics
Residual Standard Deviation 2021
Sum Squared Residuals 1.919e+08


Multiple Linear Regression - Actuals, Interpolation, and Residuals
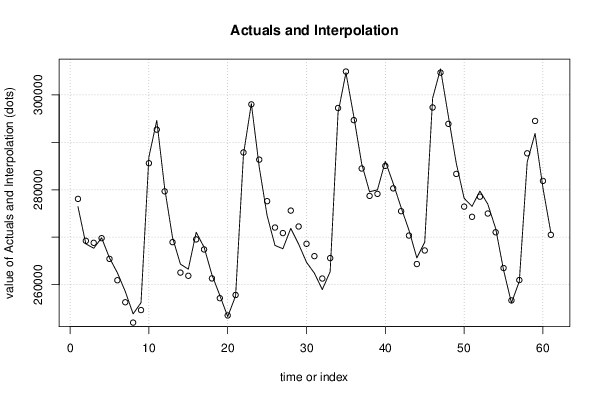
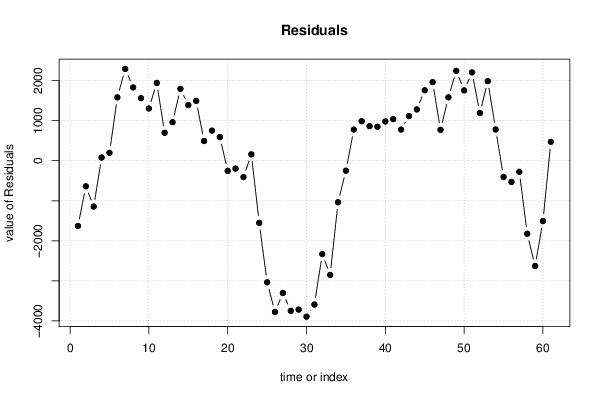
Time or IndexActualsInterpolationForecastResidualsPrediction Error
1 2.764e+05 2.781e+05-1630
2 2.686e+05 2.692e+05-638.7
3 2.677e+05 2.688e+05-1145
4 2.699e+05 2.698e+05 79.66
5 2.656e+05 2.654e+05 197.3
6 2.625e+05 2.609e+05 1583
7 2.586e+05 2.563e+05 2292
8 2.538e+05 2.52e+05 1831
9 2.562e+05 2.547e+05 1563
10 2.869e+05 2.856e+05 1304
11 2.946e+05 2.927e+05 1944
12 2.804e+05 2.797e+05 697.6
13 2.699e+05 2.69e+05 962
14 2.643e+05 2.625e+05 1794
15 2.633e+05 2.619e+05 1391
16 2.71e+05 2.696e+05 1495
17 2.679e+05 2.674e+05 493.3
18 2.621e+05 2.613e+05 752.3
19 2.578e+05 2.572e+05 590.6
20 2.533e+05 2.535e+05-252.1
21 2.576e+05 2.578e+05-196.5
22 2.875e+05 2.879e+05-408.3
23 2.982e+05 2.98e+05 159.9
24 2.848e+05 2.863e+05-1552
25 2.746e+05 2.776e+05-3036
26 2.683e+05 2.72e+05-3776
27 2.676e+05 2.709e+05-3302
28 2.719e+05 2.756e+05-3748
29 2.685e+05 2.723e+05-3716
30 2.647e+05 2.686e+05-3893
31 2.624e+05 2.66e+05-3591
32 2.59e+05 2.613e+05-2330
33 2.628e+05 2.656e+05-2851
34 2.962e+05 2.972e+05-1037
35 3.047e+05 3.049e+05-248.4
36 2.954e+05 2.947e+05 777.4
37 2.855e+05 2.845e+05 986.6
38 2.796e+05 2.787e+05 864.5
39 2.8e+05 2.791e+05 849.3
40 2.86e+05 2.85e+05 981.3
41 2.813e+05 2.803e+05 1039
42 2.763e+05 2.755e+05 778.2
43 2.715e+05 2.704e+05 1114
44 2.656e+05 2.644e+05 1281
45 2.69e+05 2.672e+05 1760
46 2.993e+05 2.973e+05 1963
47 3.055e+05 3.047e+05 772.5
48 2.955e+05 2.939e+05 1583
49 2.856e+05 2.833e+05 2245
50 2.782e+05 2.764e+05 1757
51 2.765e+05 2.743e+05 2207
52 2.797e+05 2.785e+05 1192
53 2.77e+05 2.75e+05 1986
54 2.718e+05 2.711e+05 780.3
55 2.631e+05 2.635e+05-406.3
56 2.562e+05 2.567e+05-530.4
57 2.607e+05 2.61e+05-275.4
58 2.859e+05 2.877e+05-1823
59 2.919e+05 2.945e+05-2628
60 2.804e+05 2.819e+05-1506
61 2.71e+05 2.705e+05 471.9

\begin{tabular}{lllllllll}
\hline
Multiple Linear Regression - Actuals, Interpolation, and Residuals \tabularnewline
Time or Index & Actuals & InterpolationForecast & ResidualsPrediction Error \tabularnewline
1 &  2.764e+05 &  2.781e+05 & -1630 \tabularnewline
2 &  2.686e+05 &  2.692e+05 & -638.7 \tabularnewline
3 &  2.677e+05 &  2.688e+05 & -1145 \tabularnewline
4 &  2.699e+05 &  2.698e+05 &  79.66 \tabularnewline
5 &  2.656e+05 &  2.654e+05 &  197.3 \tabularnewline
6 &  2.625e+05 &  2.609e+05 &  1583 \tabularnewline
7 &  2.586e+05 &  2.563e+05 &  2292 \tabularnewline
8 &  2.538e+05 &  2.52e+05 &  1831 \tabularnewline
9 &  2.562e+05 &  2.547e+05 &  1563 \tabularnewline
10 &  2.869e+05 &  2.856e+05 &  1304 \tabularnewline
11 &  2.946e+05 &  2.927e+05 &  1944 \tabularnewline
12 &  2.804e+05 &  2.797e+05 &  697.6 \tabularnewline
13 &  2.699e+05 &  2.69e+05 &  962 \tabularnewline
14 &  2.643e+05 &  2.625e+05 &  1794 \tabularnewline
15 &  2.633e+05 &  2.619e+05 &  1391 \tabularnewline
16 &  2.71e+05 &  2.696e+05 &  1495 \tabularnewline
17 &  2.679e+05 &  2.674e+05 &  493.3 \tabularnewline
18 &  2.621e+05 &  2.613e+05 &  752.3 \tabularnewline
19 &  2.578e+05 &  2.572e+05 &  590.6 \tabularnewline
20 &  2.533e+05 &  2.535e+05 & -252.1 \tabularnewline
21 &  2.576e+05 &  2.578e+05 & -196.5 \tabularnewline
22 &  2.875e+05 &  2.879e+05 & -408.3 \tabularnewline
23 &  2.982e+05 &  2.98e+05 &  159.9 \tabularnewline
24 &  2.848e+05 &  2.863e+05 & -1552 \tabularnewline
25 &  2.746e+05 &  2.776e+05 & -3036 \tabularnewline
26 &  2.683e+05 &  2.72e+05 & -3776 \tabularnewline
27 &  2.676e+05 &  2.709e+05 & -3302 \tabularnewline
28 &  2.719e+05 &  2.756e+05 & -3748 \tabularnewline
29 &  2.685e+05 &  2.723e+05 & -3716 \tabularnewline
30 &  2.647e+05 &  2.686e+05 & -3893 \tabularnewline
31 &  2.624e+05 &  2.66e+05 & -3591 \tabularnewline
32 &  2.59e+05 &  2.613e+05 & -2330 \tabularnewline
33 &  2.628e+05 &  2.656e+05 & -2851 \tabularnewline
34 &  2.962e+05 &  2.972e+05 & -1037 \tabularnewline
35 &  3.047e+05 &  3.049e+05 & -248.4 \tabularnewline
36 &  2.954e+05 &  2.947e+05 &  777.4 \tabularnewline
37 &  2.855e+05 &  2.845e+05 &  986.6 \tabularnewline
38 &  2.796e+05 &  2.787e+05 &  864.5 \tabularnewline
39 &  2.8e+05 &  2.791e+05 &  849.3 \tabularnewline
40 &  2.86e+05 &  2.85e+05 &  981.3 \tabularnewline
41 &  2.813e+05 &  2.803e+05 &  1039 \tabularnewline
42 &  2.763e+05 &  2.755e+05 &  778.2 \tabularnewline
43 &  2.715e+05 &  2.704e+05 &  1114 \tabularnewline
44 &  2.656e+05 &  2.644e+05 &  1281 \tabularnewline
45 &  2.69e+05 &  2.672e+05 &  1760 \tabularnewline
46 &  2.993e+05 &  2.973e+05 &  1963 \tabularnewline
47 &  3.055e+05 &  3.047e+05 &  772.5 \tabularnewline
48 &  2.955e+05 &  2.939e+05 &  1583 \tabularnewline
49 &  2.856e+05 &  2.833e+05 &  2245 \tabularnewline
50 &  2.782e+05 &  2.764e+05 &  1757 \tabularnewline
51 &  2.765e+05 &  2.743e+05 &  2207 \tabularnewline
52 &  2.797e+05 &  2.785e+05 &  1192 \tabularnewline
53 &  2.77e+05 &  2.75e+05 &  1986 \tabularnewline
54 &  2.718e+05 &  2.711e+05 &  780.3 \tabularnewline
55 &  2.631e+05 &  2.635e+05 & -406.3 \tabularnewline
56 &  2.562e+05 &  2.567e+05 & -530.4 \tabularnewline
57 &  2.607e+05 &  2.61e+05 & -275.4 \tabularnewline
58 &  2.859e+05 &  2.877e+05 & -1823 \tabularnewline
59 &  2.919e+05 &  2.945e+05 & -2628 \tabularnewline
60 &  2.804e+05 &  2.819e+05 & -1506 \tabularnewline
61 &  2.71e+05 &  2.705e+05 &  471.9 \tabularnewline
\hline
\end{tabular}
%Source: https://freestatistics.org/blog/index.php?pk=284871&T=4

[TABLE]
[ROW][C]Multiple Linear Regression - Actuals, Interpolation, and Residuals[/C][/ROW]
[ROW][C]Time or Index[/C][C]Actuals[/C][C]InterpolationForecast[/C][C]ResidualsPrediction Error[/C][/ROW]
[ROW][C]1[/C][C] 2.764e+05[/C][C] 2.781e+05[/C][C]-1630[/C][/ROW]
[ROW][C]2[/C][C] 2.686e+05[/C][C] 2.692e+05[/C][C]-638.7[/C][/ROW]
[ROW][C]3[/C][C] 2.677e+05[/C][C] 2.688e+05[/C][C]-1145[/C][/ROW]
[ROW][C]4[/C][C] 2.699e+05[/C][C] 2.698e+05[/C][C] 79.66[/C][/ROW]
[ROW][C]5[/C][C] 2.656e+05[/C][C] 2.654e+05[/C][C] 197.3[/C][/ROW]
[ROW][C]6[/C][C] 2.625e+05[/C][C] 2.609e+05[/C][C] 1583[/C][/ROW]
[ROW][C]7[/C][C] 2.586e+05[/C][C] 2.563e+05[/C][C] 2292[/C][/ROW]
[ROW][C]8[/C][C] 2.538e+05[/C][C] 2.52e+05[/C][C] 1831[/C][/ROW]
[ROW][C]9[/C][C] 2.562e+05[/C][C] 2.547e+05[/C][C] 1563[/C][/ROW]
[ROW][C]10[/C][C] 2.869e+05[/C][C] 2.856e+05[/C][C] 1304[/C][/ROW]
[ROW][C]11[/C][C] 2.946e+05[/C][C] 2.927e+05[/C][C] 1944[/C][/ROW]
[ROW][C]12[/C][C] 2.804e+05[/C][C] 2.797e+05[/C][C] 697.6[/C][/ROW]
[ROW][C]13[/C][C] 2.699e+05[/C][C] 2.69e+05[/C][C] 962[/C][/ROW]
[ROW][C]14[/C][C] 2.643e+05[/C][C] 2.625e+05[/C][C] 1794[/C][/ROW]
[ROW][C]15[/C][C] 2.633e+05[/C][C] 2.619e+05[/C][C] 1391[/C][/ROW]
[ROW][C]16[/C][C] 2.71e+05[/C][C] 2.696e+05[/C][C] 1495[/C][/ROW]
[ROW][C]17[/C][C] 2.679e+05[/C][C] 2.674e+05[/C][C] 493.3[/C][/ROW]
[ROW][C]18[/C][C] 2.621e+05[/C][C] 2.613e+05[/C][C] 752.3[/C][/ROW]
[ROW][C]19[/C][C] 2.578e+05[/C][C] 2.572e+05[/C][C] 590.6[/C][/ROW]
[ROW][C]20[/C][C] 2.533e+05[/C][C] 2.535e+05[/C][C]-252.1[/C][/ROW]
[ROW][C]21[/C][C] 2.576e+05[/C][C] 2.578e+05[/C][C]-196.5[/C][/ROW]
[ROW][C]22[/C][C] 2.875e+05[/C][C] 2.879e+05[/C][C]-408.3[/C][/ROW]
[ROW][C]23[/C][C] 2.982e+05[/C][C] 2.98e+05[/C][C] 159.9[/C][/ROW]
[ROW][C]24[/C][C] 2.848e+05[/C][C] 2.863e+05[/C][C]-1552[/C][/ROW]
[ROW][C]25[/C][C] 2.746e+05[/C][C] 2.776e+05[/C][C]-3036[/C][/ROW]
[ROW][C]26[/C][C] 2.683e+05[/C][C] 2.72e+05[/C][C]-3776[/C][/ROW]
[ROW][C]27[/C][C] 2.676e+05[/C][C] 2.709e+05[/C][C]-3302[/C][/ROW]
[ROW][C]28[/C][C] 2.719e+05[/C][C] 2.756e+05[/C][C]-3748[/C][/ROW]
[ROW][C]29[/C][C] 2.685e+05[/C][C] 2.723e+05[/C][C]-3716[/C][/ROW]
[ROW][C]30[/C][C] 2.647e+05[/C][C] 2.686e+05[/C][C]-3893[/C][/ROW]
[ROW][C]31[/C][C] 2.624e+05[/C][C] 2.66e+05[/C][C]-3591[/C][/ROW]
[ROW][C]32[/C][C] 2.59e+05[/C][C] 2.613e+05[/C][C]-2330[/C][/ROW]
[ROW][C]33[/C][C] 2.628e+05[/C][C] 2.656e+05[/C][C]-2851[/C][/ROW]
[ROW][C]34[/C][C] 2.962e+05[/C][C] 2.972e+05[/C][C]-1037[/C][/ROW]
[ROW][C]35[/C][C] 3.047e+05[/C][C] 3.049e+05[/C][C]-248.4[/C][/ROW]
[ROW][C]36[/C][C] 2.954e+05[/C][C] 2.947e+05[/C][C] 777.4[/C][/ROW]
[ROW][C]37[/C][C] 2.855e+05[/C][C] 2.845e+05[/C][C] 986.6[/C][/ROW]
[ROW][C]38[/C][C] 2.796e+05[/C][C] 2.787e+05[/C][C] 864.5[/C][/ROW]
[ROW][C]39[/C][C] 2.8e+05[/C][C] 2.791e+05[/C][C] 849.3[/C][/ROW]
[ROW][C]40[/C][C] 2.86e+05[/C][C] 2.85e+05[/C][C] 981.3[/C][/ROW]
[ROW][C]41[/C][C] 2.813e+05[/C][C] 2.803e+05[/C][C] 1039[/C][/ROW]
[ROW][C]42[/C][C] 2.763e+05[/C][C] 2.755e+05[/C][C] 778.2[/C][/ROW]
[ROW][C]43[/C][C] 2.715e+05[/C][C] 2.704e+05[/C][C] 1114[/C][/ROW]
[ROW][C]44[/C][C] 2.656e+05[/C][C] 2.644e+05[/C][C] 1281[/C][/ROW]
[ROW][C]45[/C][C] 2.69e+05[/C][C] 2.672e+05[/C][C] 1760[/C][/ROW]
[ROW][C]46[/C][C] 2.993e+05[/C][C] 2.973e+05[/C][C] 1963[/C][/ROW]
[ROW][C]47[/C][C] 3.055e+05[/C][C] 3.047e+05[/C][C] 772.5[/C][/ROW]
[ROW][C]48[/C][C] 2.955e+05[/C][C] 2.939e+05[/C][C] 1583[/C][/ROW]
[ROW][C]49[/C][C] 2.856e+05[/C][C] 2.833e+05[/C][C] 2245[/C][/ROW]
[ROW][C]50[/C][C] 2.782e+05[/C][C] 2.764e+05[/C][C] 1757[/C][/ROW]
[ROW][C]51[/C][C] 2.765e+05[/C][C] 2.743e+05[/C][C] 2207[/C][/ROW]
[ROW][C]52[/C][C] 2.797e+05[/C][C] 2.785e+05[/C][C] 1192[/C][/ROW]
[ROW][C]53[/C][C] 2.77e+05[/C][C] 2.75e+05[/C][C] 1986[/C][/ROW]
[ROW][C]54[/C][C] 2.718e+05[/C][C] 2.711e+05[/C][C] 780.3[/C][/ROW]
[ROW][C]55[/C][C] 2.631e+05[/C][C] 2.635e+05[/C][C]-406.3[/C][/ROW]
[ROW][C]56[/C][C] 2.562e+05[/C][C] 2.567e+05[/C][C]-530.4[/C][/ROW]
[ROW][C]57[/C][C] 2.607e+05[/C][C] 2.61e+05[/C][C]-275.4[/C][/ROW]
[ROW][C]58[/C][C] 2.859e+05[/C][C] 2.877e+05[/C][C]-1823[/C][/ROW]
[ROW][C]59[/C][C] 2.919e+05[/C][C] 2.945e+05[/C][C]-2628[/C][/ROW]
[ROW][C]60[/C][C] 2.804e+05[/C][C] 2.819e+05[/C][C]-1506[/C][/ROW]
[ROW][C]61[/C][C] 2.71e+05[/C][C] 2.705e+05[/C][C] 471.9[/C][/ROW]
[/TABLE]
Source: https://freestatistics.org/blog/index.php?pk=284871&T=4

Globally Unique Identifier (entire table): ba.freestatistics.org/blog/index.php?pk=284871&T=4

As an alternative you can also use a QR Code:  

The GUIDs for individual cells are displayed in the table below:

Multiple Linear Regression - Actuals, Interpolation, and Residuals
Time or IndexActualsInterpolationForecastResidualsPrediction Error
1 2.764e+05 2.781e+05-1630
2 2.686e+05 2.692e+05-638.7
3 2.677e+05 2.688e+05-1145
4 2.699e+05 2.698e+05 79.66
5 2.656e+05 2.654e+05 197.3
6 2.625e+05 2.609e+05 1583
7 2.586e+05 2.563e+05 2292
8 2.538e+05 2.52e+05 1831
9 2.562e+05 2.547e+05 1563
10 2.869e+05 2.856e+05 1304
11 2.946e+05 2.927e+05 1944
12 2.804e+05 2.797e+05 697.6
13 2.699e+05 2.69e+05 962
14 2.643e+05 2.625e+05 1794
15 2.633e+05 2.619e+05 1391
16 2.71e+05 2.696e+05 1495
17 2.679e+05 2.674e+05 493.3
18 2.621e+05 2.613e+05 752.3
19 2.578e+05 2.572e+05 590.6
20 2.533e+05 2.535e+05-252.1
21 2.576e+05 2.578e+05-196.5
22 2.875e+05 2.879e+05-408.3
23 2.982e+05 2.98e+05 159.9
24 2.848e+05 2.863e+05-1552
25 2.746e+05 2.776e+05-3036
26 2.683e+05 2.72e+05-3776
27 2.676e+05 2.709e+05-3302
28 2.719e+05 2.756e+05-3748
29 2.685e+05 2.723e+05-3716
30 2.647e+05 2.686e+05-3893
31 2.624e+05 2.66e+05-3591
32 2.59e+05 2.613e+05-2330
33 2.628e+05 2.656e+05-2851
34 2.962e+05 2.972e+05-1037
35 3.047e+05 3.049e+05-248.4
36 2.954e+05 2.947e+05 777.4
37 2.855e+05 2.845e+05 986.6
38 2.796e+05 2.787e+05 864.5
39 2.8e+05 2.791e+05 849.3
40 2.86e+05 2.85e+05 981.3
41 2.813e+05 2.803e+05 1039
42 2.763e+05 2.755e+05 778.2
43 2.715e+05 2.704e+05 1114
44 2.656e+05 2.644e+05 1281
45 2.69e+05 2.672e+05 1760
46 2.993e+05 2.973e+05 1963
47 3.055e+05 3.047e+05 772.5
48 2.955e+05 2.939e+05 1583
49 2.856e+05 2.833e+05 2245
50 2.782e+05 2.764e+05 1757
51 2.765e+05 2.743e+05 2207
52 2.797e+05 2.785e+05 1192
53 2.77e+05 2.75e+05 1986
54 2.718e+05 2.711e+05 780.3
55 2.631e+05 2.635e+05-406.3
56 2.562e+05 2.567e+05-530.4
57 2.607e+05 2.61e+05-275.4
58 2.859e+05 2.877e+05-1823
59 2.919e+05 2.945e+05-2628
60 2.804e+05 2.819e+05-1506
61 2.71e+05 2.705e+05 471.9


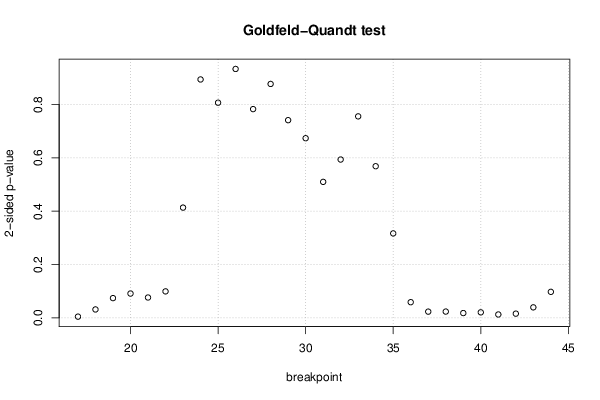
Goldfeld-Quandt test for Heteroskedasticity
p-valuesAlternative Hypothesis
breakpoint indexgreater2-sidedless
17 0.002231 0.004462 0.9978
18 0.01573 0.03146 0.9843
19 0.03703 0.07405 0.963
20 0.04558 0.09115 0.9544
21 0.03813 0.07625 0.9619
22 0.04967 0.09933 0.9503
23 0.2068 0.4136 0.7932
24 0.4472 0.8944 0.5528
25 0.4036 0.8071 0.5964
26 0.4669 0.9338 0.5331
27 0.3916 0.7832 0.6084
28 0.4388 0.8775 0.5612
29 0.3708 0.7417 0.6292
30 0.337 0.6739 0.663
31 0.2551 0.5101 0.7449
32 0.2969 0.5939 0.7031
33 0.378 0.7559 0.622
34 0.7156 0.5688 0.2844
35 0.8416 0.3168 0.1584
36 0.9706 0.05871 0.02935
37 0.9884 0.02327 0.01163
38 0.9882 0.02354 0.01177
39 0.991 0.01792 0.008962
40 0.9897 0.02068 0.01034
41 0.9937 0.01262 0.006308
42 0.9922 0.01567 0.007837
43 0.9803 0.03937 0.01969
44 0.9512 0.0976 0.0488

\begin{tabular}{lllllllll}
\hline
Goldfeld-Quandt test for Heteroskedasticity \tabularnewline
p-values & Alternative Hypothesis \tabularnewline
breakpoint index & greater & 2-sided & less \tabularnewline
17 &  0.002231 &  0.004462 &  0.9978 \tabularnewline
18 &  0.01573 &  0.03146 &  0.9843 \tabularnewline
19 &  0.03703 &  0.07405 &  0.963 \tabularnewline
20 &  0.04558 &  0.09115 &  0.9544 \tabularnewline
21 &  0.03813 &  0.07625 &  0.9619 \tabularnewline
22 &  0.04967 &  0.09933 &  0.9503 \tabularnewline
23 &  0.2068 &  0.4136 &  0.7932 \tabularnewline
24 &  0.4472 &  0.8944 &  0.5528 \tabularnewline
25 &  0.4036 &  0.8071 &  0.5964 \tabularnewline
26 &  0.4669 &  0.9338 &  0.5331 \tabularnewline
27 &  0.3916 &  0.7832 &  0.6084 \tabularnewline
28 &  0.4388 &  0.8775 &  0.5612 \tabularnewline
29 &  0.3708 &  0.7417 &  0.6292 \tabularnewline
30 &  0.337 &  0.6739 &  0.663 \tabularnewline
31 &  0.2551 &  0.5101 &  0.7449 \tabularnewline
32 &  0.2969 &  0.5939 &  0.7031 \tabularnewline
33 &  0.378 &  0.7559 &  0.622 \tabularnewline
34 &  0.7156 &  0.5688 &  0.2844 \tabularnewline
35 &  0.8416 &  0.3168 &  0.1584 \tabularnewline
36 &  0.9706 &  0.05871 &  0.02935 \tabularnewline
37 &  0.9884 &  0.02327 &  0.01163 \tabularnewline
38 &  0.9882 &  0.02354 &  0.01177 \tabularnewline
39 &  0.991 &  0.01792 &  0.008962 \tabularnewline
40 &  0.9897 &  0.02068 &  0.01034 \tabularnewline
41 &  0.9937 &  0.01262 &  0.006308 \tabularnewline
42 &  0.9922 &  0.01567 &  0.007837 \tabularnewline
43 &  0.9803 &  0.03937 &  0.01969 \tabularnewline
44 &  0.9512 &  0.0976 &  0.0488 \tabularnewline
\hline
\end{tabular}
%Source: https://freestatistics.org/blog/index.php?pk=284871&T=5

[TABLE]
[ROW][C]Goldfeld-Quandt test for Heteroskedasticity[/C][/ROW]
[ROW][C]p-values[/C][C]Alternative Hypothesis[/C][/ROW]
[ROW][C]breakpoint index[/C][C]greater[/C][C]2-sided[/C][C]less[/C][/ROW]
[ROW][C]17[/C][C] 0.002231[/C][C] 0.004462[/C][C] 0.9978[/C][/ROW]
[ROW][C]18[/C][C] 0.01573[/C][C] 0.03146[/C][C] 0.9843[/C][/ROW]
[ROW][C]19[/C][C] 0.03703[/C][C] 0.07405[/C][C] 0.963[/C][/ROW]
[ROW][C]20[/C][C] 0.04558[/C][C] 0.09115[/C][C] 0.9544[/C][/ROW]
[ROW][C]21[/C][C] 0.03813[/C][C] 0.07625[/C][C] 0.9619[/C][/ROW]
[ROW][C]22[/C][C] 0.04967[/C][C] 0.09933[/C][C] 0.9503[/C][/ROW]
[ROW][C]23[/C][C] 0.2068[/C][C] 0.4136[/C][C] 0.7932[/C][/ROW]
[ROW][C]24[/C][C] 0.4472[/C][C] 0.8944[/C][C] 0.5528[/C][/ROW]
[ROW][C]25[/C][C] 0.4036[/C][C] 0.8071[/C][C] 0.5964[/C][/ROW]
[ROW][C]26[/C][C] 0.4669[/C][C] 0.9338[/C][C] 0.5331[/C][/ROW]
[ROW][C]27[/C][C] 0.3916[/C][C] 0.7832[/C][C] 0.6084[/C][/ROW]
[ROW][C]28[/C][C] 0.4388[/C][C] 0.8775[/C][C] 0.5612[/C][/ROW]
[ROW][C]29[/C][C] 0.3708[/C][C] 0.7417[/C][C] 0.6292[/C][/ROW]
[ROW][C]30[/C][C] 0.337[/C][C] 0.6739[/C][C] 0.663[/C][/ROW]
[ROW][C]31[/C][C] 0.2551[/C][C] 0.5101[/C][C] 0.7449[/C][/ROW]
[ROW][C]32[/C][C] 0.2969[/C][C] 0.5939[/C][C] 0.7031[/C][/ROW]
[ROW][C]33[/C][C] 0.378[/C][C] 0.7559[/C][C] 0.622[/C][/ROW]
[ROW][C]34[/C][C] 0.7156[/C][C] 0.5688[/C][C] 0.2844[/C][/ROW]
[ROW][C]35[/C][C] 0.8416[/C][C] 0.3168[/C][C] 0.1584[/C][/ROW]
[ROW][C]36[/C][C] 0.9706[/C][C] 0.05871[/C][C] 0.02935[/C][/ROW]
[ROW][C]37[/C][C] 0.9884[/C][C] 0.02327[/C][C] 0.01163[/C][/ROW]
[ROW][C]38[/C][C] 0.9882[/C][C] 0.02354[/C][C] 0.01177[/C][/ROW]
[ROW][C]39[/C][C] 0.991[/C][C] 0.01792[/C][C] 0.008962[/C][/ROW]
[ROW][C]40[/C][C] 0.9897[/C][C] 0.02068[/C][C] 0.01034[/C][/ROW]
[ROW][C]41[/C][C] 0.9937[/C][C] 0.01262[/C][C] 0.006308[/C][/ROW]
[ROW][C]42[/C][C] 0.9922[/C][C] 0.01567[/C][C] 0.007837[/C][/ROW]
[ROW][C]43[/C][C] 0.9803[/C][C] 0.03937[/C][C] 0.01969[/C][/ROW]
[ROW][C]44[/C][C] 0.9512[/C][C] 0.0976[/C][C] 0.0488[/C][/ROW]
[/TABLE]
Source: https://freestatistics.org/blog/index.php?pk=284871&T=5

Globally Unique Identifier (entire table): ba.freestatistics.org/blog/index.php?pk=284871&T=5

As an alternative you can also use a QR Code:  

The GUIDs for individual cells are displayed in the table below:

Goldfeld-Quandt test for Heteroskedasticity
p-valuesAlternative Hypothesis
breakpoint indexgreater2-sidedless
17 0.002231 0.004462 0.9978
18 0.01573 0.03146 0.9843
19 0.03703 0.07405 0.963
20 0.04558 0.09115 0.9544
21 0.03813 0.07625 0.9619
22 0.04967 0.09933 0.9503
23 0.2068 0.4136 0.7932
24 0.4472 0.8944 0.5528
25 0.4036 0.8071 0.5964
26 0.4669 0.9338 0.5331
27 0.3916 0.7832 0.6084
28 0.4388 0.8775 0.5612
29 0.3708 0.7417 0.6292
30 0.337 0.6739 0.663
31 0.2551 0.5101 0.7449
32 0.2969 0.5939 0.7031
33 0.378 0.7559 0.622
34 0.7156 0.5688 0.2844
35 0.8416 0.3168 0.1584
36 0.9706 0.05871 0.02935
37 0.9884 0.02327 0.01163
38 0.9882 0.02354 0.01177
39 0.991 0.01792 0.008962
40 0.9897 0.02068 0.01034
41 0.9937 0.01262 0.006308
42 0.9922 0.01567 0.007837
43 0.9803 0.03937 0.01969
44 0.9512 0.0976 0.0488


Meta Analysis of Goldfeld-Quandt test for Heteroskedasticity
Description# significant tests% significant testsOK/NOK
1% type I error level1 0.03571NOK
5% type I error level90.321429NOK
10% type I error level150.535714NOK

\begin{tabular}{lllllllll}
\hline
Meta Analysis of Goldfeld-Quandt test for Heteroskedasticity \tabularnewline
Description & # significant tests & % significant tests & OK/NOK \tabularnewline
1% type I error level & 1 &  0.03571 & NOK \tabularnewline
5% type I error level & 9 & 0.321429 & NOK \tabularnewline
10% type I error level & 15 & 0.535714 & NOK \tabularnewline
\hline
\end{tabular}
%Source: https://freestatistics.org/blog/index.php?pk=284871&T=6

[TABLE]
[ROW][C]Meta Analysis of Goldfeld-Quandt test for Heteroskedasticity[/C][/ROW]
[ROW][C]Description[/C][C]# significant tests[/C][C]% significant tests[/C][C]OK/NOK[/C][/ROW]
[ROW][C]1% type I error level[/C][C]1[/C][C] 0.03571[/C][C]NOK[/C][/ROW]
[ROW][C]5% type I error level[/C][C]9[/C][C]0.321429[/C][C]NOK[/C][/ROW]
[ROW][C]10% type I error level[/C][C]15[/C][C]0.535714[/C][C]NOK[/C][/ROW]
[/TABLE]
Source: https://freestatistics.org/blog/index.php?pk=284871&T=6

Globally Unique Identifier (entire table): ba.freestatistics.org/blog/index.php?pk=284871&T=6

As an alternative you can also use a QR Code:  

The GUIDs for individual cells are displayed in the table below:

Meta Analysis of Goldfeld-Quandt test for Heteroskedasticity
Description# significant tests% significant testsOK/NOK
1% type I error level1 0.03571NOK
5% type I error level90.321429NOK
10% type I error level150.535714NOK


Parameters (Session):
par2 = Include Monthly Dummies ; par3 = Linear Trend ;
Parameters (R input):
par1 = ; par2 = Include Monthly Dummies ; par3 = Linear Trend ; par4 = ; par5 = ;
R code (references can be found in the software module):
par5 <- ''
par4 <- ''
par3 <- 'Linear Trend'
par2 <- 'Do not include Seasonal Dummies'
par1 <- ''
library(lattice)
library(lmtest)
n25 <- 25 #minimum number of obs. for Goldfeld-Quandt test
mywarning <- ''
par1 <- as.numeric(par1)
if(is.na(par1)) {
par1 <- 1
mywarning = 'Warning: you did not specify the column number of the endogenous series! The first column was selected by default.'
}
if (par4=='') par4 <- 0
par4 <- as.numeric(par4)
if (par5=='') par5 <- 0
par5 <- as.numeric(par5)
x <- na.omit(t(y))
k <- length(x[1,])
n <- length(x[,1])
x1 <- cbind(x[,par1], x[,1:k!=par1])
mycolnames <- c(colnames(x)[par1], colnames(x)[1:k!=par1])
colnames(x1) <- mycolnames #colnames(x)[par1]
x <- x1
if (par3 == 'First Differences'){
x2 <- array(0, dim=c(n-1,k), dimnames=list(1:(n-1), paste('(1-B)',colnames(x),sep='')))
for (i in 1:n-1) {
for (j in 1:k) {
x2[i,j] <- x[i+1,j] - x[i,j]
}
}
x <- x2
}
if(par4 > 0) {
x2 <- array(0, dim=c(n-par4,par4), dimnames=list(1:(n-par4), paste(colnames(x)[par1],'(t-',1:par4,')',sep='')))
for (i in 1:(n-par4)) {
for (j in 1:par4) {
x2[i,j] <- x[i+par4-j,par1]
}
}
x <- cbind(x[(par4+1):n,], x2)
n <- n - par4
}
if (par2 == 'Include Monthly Dummies'){
x2 <- array(0, dim=c(n,11), dimnames=list(1:n, paste('M', seq(1:11), sep ='')))
for (i in 1:11){
x2[seq(i,n,12),i] <- 1
}
x <- cbind(x, x2)
}
if (par2 == 'Include Quarterly Dummies'){
x2 <- array(0, dim=c(n,3), dimnames=list(1:n, paste('Q', seq(1:3), sep ='')))
for (i in 1:3){
x2[seq(i,n,4),i] <- 1
}
x <- cbind(x, x2)
}
k <- length(x[1+par4,])
if (par3 == 'Linear Trend'){
x <- cbind(x, c(1:n))
colnames(x)[k+1] <- 't'
}
x
k <- length(x[1+par4,])
df <- as.data.frame(x)
(mylm <- lm(df))
(mysum <- summary(mylm))
if (n > n25) {
kp3 <- k + 3
nmkm3 <- n - k - 3
gqarr <- array(NA, dim=c(nmkm3-kp3+1,3))
numgqtests <- 0
numsignificant1 <- 0
numsignificant5 <- 0
numsignificant10 <- 0
for (mypoint in kp3:nmkm3) {
j <- 0
numgqtests <- numgqtests + 1
for (myalt in c('greater', 'two.sided', 'less')) {
j <- j + 1
gqarr[mypoint-kp3+1,j] <- gqtest(mylm, point=mypoint, alternative=myalt)$p.value
}
if (gqarr[mypoint-kp3+1,2] < 0.01) numsignificant1 <- numsignificant1 + 1
if (gqarr[mypoint-kp3+1,2] < 0.05) numsignificant5 <- numsignificant5 + 1
if (gqarr[mypoint-kp3+1,2] < 0.10) numsignificant10 <- numsignificant10 + 1
}
gqarr
}
bitmap(file='test0.png')
plot(x[,1], type='l', main='Actuals and Interpolation', ylab='value of Actuals and Interpolation (dots)', xlab='time or index')
points(x[,1]-mysum$resid)
grid()
dev.off()
bitmap(file='test1.png')
plot(mysum$resid, type='b', pch=19, main='Residuals', ylab='value of Residuals', xlab='time or index')
grid()
dev.off()
bitmap(file='test2.png')
hist(mysum$resid, main='Residual Histogram', xlab='values of Residuals')
grid()
dev.off()
bitmap(file='test3.png')
densityplot(~mysum$resid,col='black',main='Residual Density Plot', xlab='values of Residuals')
dev.off()
bitmap(file='test4.png')
qqnorm(mysum$resid, main='Residual Normal Q-Q Plot')
qqline(mysum$resid)
grid()
dev.off()
(myerror <- as.ts(mysum$resid))
bitmap(file='test5.png')
dum <- cbind(lag(myerror,k=1),myerror)
dum
dum1 <- dum[2:length(myerror),]
dum1
z <- as.data.frame(dum1)
z
plot(z,main=paste('Residual Lag plot, lowess, and regression line'), ylab='values of Residuals', xlab='lagged values of Residuals')
lines(lowess(z))
abline(lm(z))
grid()
dev.off()
bitmap(file='test6.png')
acf(mysum$resid, lag.max=length(mysum$resid)/2, main='Residual Autocorrelation Function')
grid()
dev.off()
bitmap(file='test7.png')
pacf(mysum$resid, lag.max=length(mysum$resid)/2, main='Residual Partial Autocorrelation Function')
grid()
dev.off()
bitmap(file='test8.png')
opar <- par(mfrow = c(2,2), oma = c(0, 0, 1.1, 0))
plot(mylm, las = 1, sub='Residual Diagnostics')
par(opar)
dev.off()
if (n > n25) {
bitmap(file='test9.png')
plot(kp3:nmkm3,gqarr[,2], main='Goldfeld-Quandt test',ylab='2-sided p-value',xlab='breakpoint')
grid()
dev.off()
}
load(file='createtable')
a<-table.start()
a<-table.row.start(a)
a<-table.element(a, 'Multiple Linear Regression - Estimated Regression Equation', 1, TRUE)
a<-table.row.end(a)
myeq <- colnames(x)[1]
myeq <- paste(myeq, '[t] = ', sep='')
for (i in 1:k){
if (mysum$coefficients[i,1] > 0) myeq <- paste(myeq, '+', '')
myeq <- paste(myeq, signif(mysum$coefficients[i,1],6), sep=' ')
if (rownames(mysum$coefficients)[i] != '(Intercept)') {
myeq <- paste(myeq, rownames(mysum$coefficients)[i], sep='')
if (rownames(mysum$coefficients)[i] != 't') myeq <- paste(myeq, '[t]', sep='')
}
}
myeq <- paste(myeq, ' + e[t]')
a<-table.row.start(a)
a<-table.element(a, myeq)
a<-table.row.end(a)
a<-table.row.start(a)
a<-table.element(a, mywarning)
a<-table.row.end(a)
a<-table.end(a)
table.save(a,file='mytable1.tab')
a<-table.start()
a<-table.row.start(a)
a<-table.element(a,hyperlink('ols1.htm','Multiple Linear Regression - Ordinary Least Squares',''), 6, TRUE)
a<-table.row.end(a)
a<-table.row.start(a)
a<-table.element(a,'Variable',header=TRUE)
a<-table.element(a,'Parameter',header=TRUE)
a<-table.element(a,'S.D.',header=TRUE)
a<-table.element(a,'T-STAT
H0: parameter = 0',header=TRUE)
a<-table.element(a,'2-tail p-value',header=TRUE)
a<-table.element(a,'1-tail p-value',header=TRUE)
a<-table.row.end(a)
for (i in 1:k){
a<-table.row.start(a)
a<-table.element(a,rownames(mysum$coefficients)[i],header=TRUE)
a<-table.element(a,formatC(signif(mysum$coefficients[i,1],5),format='g',flag='+'))
a<-table.element(a,formatC(signif(mysum$coefficients[i,2],5),format='g',flag=' '))
a<-table.element(a,formatC(signif(mysum$coefficients[i,3],4),format='e',flag='+'))
a<-table.element(a,formatC(signif(mysum$coefficients[i,4],4),format='g',flag=' '))
a<-table.element(a,formatC(signif(mysum$coefficients[i,4]/2,4),format='g',flag=' '))
a<-table.row.end(a)
}
a<-table.end(a)
table.save(a,file='mytable2.tab')
a<-table.start()
a<-table.row.start(a)
a<-table.element(a, 'Multiple Linear Regression - Regression Statistics', 2, TRUE)
a<-table.row.end(a)
a<-table.row.start(a)
a<-table.element(a, 'Multiple R',1,TRUE)
a<-table.element(a,formatC(signif(sqrt(mysum$r.squared),6),format='g',flag=' '))
a<-table.row.end(a)
a<-table.row.start(a)
a<-table.element(a, 'R-squared',1,TRUE)
a<-table.element(a,formatC(signif(mysum$r.squared,6),format='g',flag=' '))
a<-table.row.end(a)
a<-table.row.start(a)
a<-table.element(a, 'Adjusted R-squared',1,TRUE)
a<-table.element(a,formatC(signif(mysum$adj.r.squared,6),format='g',flag=' '))
a<-table.row.end(a)
a<-table.row.start(a)
a<-table.element(a, 'F-TEST (value)',1,TRUE)
a<-table.element(a,formatC(signif(mysum$fstatistic[1],6),format='g',flag=' '))
a<-table.row.end(a)
a<-table.row.start(a)
a<-table.element(a, 'F-TEST (DF numerator)',1,TRUE)
a<-table.element(a, signif(mysum$fstatistic[2],6))
a<-table.row.end(a)
a<-table.row.start(a)
a<-table.element(a, 'F-TEST (DF denominator)',1,TRUE)
a<-table.element(a, signif(mysum$fstatistic[3],6))
a<-table.row.end(a)
a<-table.row.start(a)
a<-table.element(a, 'p-value',1,TRUE)
a<-table.element(a,formatC(signif(1-pf(mysum$fstatistic[1],mysum$fstatistic[2],mysum$fstatistic[3]),6),format='g',flag=' '))
a<-table.row.end(a)
a<-table.row.start(a)
a<-table.element(a, 'Multiple Linear Regression - Residual Statistics', 2, TRUE)
a<-table.row.end(a)
a<-table.row.start(a)
a<-table.element(a, 'Residual Standard Deviation',1,TRUE)
a<-table.element(a,formatC(signif(mysum$sigma,6),format='g',flag=' '))
a<-table.row.end(a)
a<-table.row.start(a)
a<-table.element(a, 'Sum Squared Residuals',1,TRUE)
a<-table.element(a,formatC(signif(sum(myerror*myerror),6),format='g',flag=' '))
a<-table.row.end(a)
a<-table.end(a)
table.save(a,file='mytable3.tab')
if(n < 200) {
a<-table.start()
a<-table.row.start(a)
a<-table.element(a, 'Multiple Linear Regression - Actuals, Interpolation, and Residuals', 4, TRUE)
a<-table.row.end(a)
a<-table.row.start(a)
a<-table.element(a, 'Time or Index', 1, TRUE)
a<-table.element(a, 'Actuals', 1, TRUE)
a<-table.element(a, 'Interpolation
Forecast', 1, TRUE)
a<-table.element(a, 'Residuals
Prediction Error', 1, TRUE)
a<-table.row.end(a)
for (i in 1:n) {
a<-table.row.start(a)
a<-table.element(a,i, 1, TRUE)
a<-table.element(a,formatC(signif(x[i],6),format='g',flag=' '))
a<-table.element(a,formatC(signif(x[i]-mysum$resid[i],6),format='g',flag=' '))
a<-table.element(a,formatC(signif(mysum$resid[i],6),format='g',flag=' '))
a<-table.row.end(a)
}
a<-table.end(a)
table.save(a,file='mytable4.tab')
if (n > n25) {
a<-table.start()
a<-table.row.start(a)
a<-table.element(a,'Goldfeld-Quandt test for Heteroskedasticity',4,TRUE)
a<-table.row.end(a)
a<-table.row.start(a)
a<-table.element(a,'p-values',header=TRUE)
a<-table.element(a,'Alternative Hypothesis',3,header=TRUE)
a<-table.row.end(a)
a<-table.row.start(a)
a<-table.element(a,'breakpoint index',header=TRUE)
a<-table.element(a,'greater',header=TRUE)
a<-table.element(a,'2-sided',header=TRUE)
a<-table.element(a,'less',header=TRUE)
a<-table.row.end(a)
for (mypoint in kp3:nmkm3) {
a<-table.row.start(a)
a<-table.element(a,mypoint,header=TRUE)
a<-table.element(a,formatC(signif(gqarr[mypoint-kp3+1,1],6),format='g',flag=' '))
a<-table.element(a,formatC(signif(gqarr[mypoint-kp3+1,2],6),format='g',flag=' '))
a<-table.element(a,formatC(signif(gqarr[mypoint-kp3+1,3],6),format='g',flag=' '))
a<-table.row.end(a)
}
a<-table.end(a)
table.save(a,file='mytable5.tab')
a<-table.start()
a<-table.row.start(a)
a<-table.element(a,'Meta Analysis of Goldfeld-Quandt test for Heteroskedasticity',4,TRUE)
a<-table.row.end(a)
a<-table.row.start(a)
a<-table.element(a,'Description',header=TRUE)
a<-table.element(a,'# significant tests',header=TRUE)
a<-table.element(a,'% significant tests',header=TRUE)
a<-table.element(a,'OK/NOK',header=TRUE)
a<-table.row.end(a)
a<-table.row.start(a)
a<-table.element(a,'1% type I error level',header=TRUE)
a<-table.element(a,signif(numsignificant1,6))
a<-table.element(a,formatC(signif(numsignificant1/numgqtests,6),format='g',flag=' '))
if (numsignificant1/numgqtests < 0.01) dum <- 'OK' else dum <- 'NOK'
a<-table.element(a,dum)
a<-table.row.end(a)
a<-table.row.start(a)
a<-table.element(a,'5% type I error level',header=TRUE)
a<-table.element(a,signif(numsignificant5,6))
a<-table.element(a,signif(numsignificant5/numgqtests,6))
if (numsignificant5/numgqtests < 0.05) dum <- 'OK' else dum <- 'NOK'
a<-table.element(a,dum)
a<-table.row.end(a)
a<-table.row.start(a)
a<-table.element(a,'10% type I error level',header=TRUE)
a<-table.element(a,signif(numsignificant10,6))
a<-table.element(a,signif(numsignificant10/numgqtests,6))
if (numsignificant10/numgqtests < 0.1) dum <- 'OK' else dum <- 'NOK'
a<-table.element(a,dum)
a<-table.row.end(a)
a<-table.end(a)
table.save(a,file='mytable6.tab')
}
}