Free Statistics

of Irreproducible Research!

Author's title

Author*The author of this computation has been verified*
R Software Modulerwasp_multipleregression.wasp
Title produced by softwareMultiple Regression
Date of computationWed, 02 Dec 2015 18:11:52 +0000
Cite this page as followsStatistical Computations at FreeStatistics.org, Office for Research Development and Education, URL https://freestatistics.org/blog/index.php?v=date/2015/Dec/02/t14490813520n8hh5c71sntdfp.htm/, Retrieved Fri, 17 May 2024 16:06:49 +0000
Statistical Computations at FreeStatistics.org, Office for Research Development and Education, URL https://freestatistics.org/blog/index.php?pk=284873, Retrieved Fri, 17 May 2024 16:06:49 +0000
QR Codes:

Original text written by user:
IsPrivate?No (this computation is public)
User-defined keywords
Estimated Impact83
Family? (F = Feedback message, R = changed R code, M = changed R Module, P = changed Parameters, D = changed Data)
-       [Multiple Regression] [Multiple Regressi...] [2015-12-02 18:11:52] [60fe8c82fc27b8a1ae22563c57c4f789] [Current]
Feedback Forum

Post a new message
Dataseries X:
115608
194014
159504
270964
199258
152936
179409
218608
147835
212057
152764
170917
114223
213729
182766
256519
170775
190548
183871
233954
151108
226560
166132
211313
116620
192975
226055
276867
223481
155405
167692
207738
152378
171706
229257
185841
136063
199989
221635
276772
243634
158156
169797
235822
149088
224093
198357
191417
135318
221121
205032
280922
242591
174553
178911
240407
154373
229870
190009
196735


Summary of computational transaction
Raw Inputview raw input (R code)
Raw Outputview raw output of R engine
Computing time5 seconds
R Server'George Udny Yule' @ yule.wessa.net

\begin{tabular}{lllllllll}
\hline
Summary of computational transaction \tabularnewline
Raw Input & view raw input (R code)  \tabularnewline
Raw Output & view raw output of R engine  \tabularnewline
Computing time & 5 seconds \tabularnewline
R Server & 'George Udny Yule' @ yule.wessa.net \tabularnewline
\hline
\end{tabular}
%Source: https://freestatistics.org/blog/index.php?pk=284873&T=0

[TABLE]
[ROW][C]Summary of computational transaction[/C][/ROW]
[ROW][C]Raw Input[/C][C]view raw input (R code) [/C][/ROW]
[ROW][C]Raw Output[/C][C]view raw output of R engine [/C][/ROW]
[ROW][C]Computing time[/C][C]5 seconds[/C][/ROW]
[ROW][C]R Server[/C][C]'George Udny Yule' @ yule.wessa.net[/C][/ROW]
[/TABLE]
Source: https://freestatistics.org/blog/index.php?pk=284873&T=0

Globally Unique Identifier (entire table): ba.freestatistics.org/blog/index.php?pk=284873&T=0

As an alternative you can also use a QR Code:  

The GUIDs for individual cells are displayed in the table below:

Summary of computational transaction
Raw Inputview raw input (R code)
Raw Outputview raw output of R engine
Computing time5 seconds
R Server'George Udny Yule' @ yule.wessa.net


Multiple Linear Regression - Estimated Regression Equation
Frankrijk[t] = + 174863 -62672.7M1[t] + 17671.4M2[t] + 11849.2M3[t] + 84804.5M4[t] + 27888.5M5[t] -22194.7M6[t] -13033.4M7[t] + 37881.4M8[t] -38923.1M9[t] + 22522.7M10[t] -3485.76M11[t] + 455.042t + e[t]
Warning: you did not specify the column number of the endogenous series! The first column was selected by default.

\begin{tabular}{lllllllll}
\hline
Multiple Linear Regression - Estimated Regression Equation \tabularnewline
Frankrijk[t] =  +  174863 -62672.7M1[t] +  17671.4M2[t] +  11849.2M3[t] +  84804.5M4[t] +  27888.5M5[t] -22194.7M6[t] -13033.4M7[t] +  37881.4M8[t] -38923.1M9[t] +  22522.7M10[t] -3485.76M11[t] +  455.042t  + e[t] \tabularnewline
Warning: you did not specify the column number of the endogenous series! The first column was selected by default. \tabularnewline
\hline
\end{tabular}
%Source: https://freestatistics.org/blog/index.php?pk=284873&T=1

[TABLE]
[ROW][C]Multiple Linear Regression - Estimated Regression Equation[/C][/ROW]
[ROW][C]Frankrijk[t] =  +  174863 -62672.7M1[t] +  17671.4M2[t] +  11849.2M3[t] +  84804.5M4[t] +  27888.5M5[t] -22194.7M6[t] -13033.4M7[t] +  37881.4M8[t] -38923.1M9[t] +  22522.7M10[t] -3485.76M11[t] +  455.042t  + e[t][/C][/ROW]
[ROW][C]Warning: you did not specify the column number of the endogenous series! The first column was selected by default.[/C][/ROW]
[/TABLE]
Source: https://freestatistics.org/blog/index.php?pk=284873&T=1

Globally Unique Identifier (entire table): ba.freestatistics.org/blog/index.php?pk=284873&T=1

As an alternative you can also use a QR Code:  

The GUIDs for individual cells are displayed in the table below:

Multiple Linear Regression - Estimated Regression Equation
Frankrijk[t] = + 174863 -62672.7M1[t] + 17671.4M2[t] + 11849.2M3[t] + 84804.5M4[t] + 27888.5M5[t] -22194.7M6[t] -13033.4M7[t] + 37881.4M8[t] -38923.1M9[t] + 22522.7M10[t] -3485.76M11[t] + 455.042t + e[t]
Warning: you did not specify the column number of the endogenous series! The first column was selected by default.


Multiple Linear Regression - Ordinary Least Squares
VariableParameterS.D.T-STATH0: parameter = 02-tail p-value1-tail p-value
(Intercept)+1.749e+05 8904+1.9640e+01 2.698e-24 1.349e-24
M1-6.267e+04 1.083e+04-5.7860e+00 5.665e-07 2.833e-07
M2+1.767e+04 1.082e+04+1.6340e+00 0.109 0.05448
M3+1.185e+04 1.08e+04+1.0970e+00 0.2782 0.1391
M4+8.48e+04 1.079e+04+7.8610e+00 4.108e-10 2.054e-10
M5+2.789e+04 1.078e+04+2.5880e+00 0.0128 0.006402
M6-2.22e+04 1.077e+04-2.0620e+00 0.04481 0.0224
M7-1.303e+04 1.076e+04-1.2120e+00 0.2317 0.1159
M8+3.788e+04 1.075e+04+3.5240e+00 0.0009599 0.0004799
M9-3.892e+04 1.074e+04-3.6220e+00 0.000714 0.000357
M10+2.252e+04 1.074e+04+2.0970e+00 0.04142 0.02071
M11-3486 1.074e+04-3.2460e-01 0.7469 0.3735
t+455 129.2+3.5230e+00 0.0009615 0.0004808

\begin{tabular}{lllllllll}
\hline
Multiple Linear Regression - Ordinary Least Squares \tabularnewline
Variable & Parameter & S.D. & T-STATH0: parameter = 0 & 2-tail p-value & 1-tail p-value \tabularnewline
(Intercept) & +1.749e+05 &  8904 & +1.9640e+01 &  2.698e-24 &  1.349e-24 \tabularnewline
M1 & -6.267e+04 &  1.083e+04 & -5.7860e+00 &  5.665e-07 &  2.833e-07 \tabularnewline
M2 & +1.767e+04 &  1.082e+04 & +1.6340e+00 &  0.109 &  0.05448 \tabularnewline
M3 & +1.185e+04 &  1.08e+04 & +1.0970e+00 &  0.2782 &  0.1391 \tabularnewline
M4 & +8.48e+04 &  1.079e+04 & +7.8610e+00 &  4.108e-10 &  2.054e-10 \tabularnewline
M5 & +2.789e+04 &  1.078e+04 & +2.5880e+00 &  0.0128 &  0.006402 \tabularnewline
M6 & -2.22e+04 &  1.077e+04 & -2.0620e+00 &  0.04481 &  0.0224 \tabularnewline
M7 & -1.303e+04 &  1.076e+04 & -1.2120e+00 &  0.2317 &  0.1159 \tabularnewline
M8 & +3.788e+04 &  1.075e+04 & +3.5240e+00 &  0.0009599 &  0.0004799 \tabularnewline
M9 & -3.892e+04 &  1.074e+04 & -3.6220e+00 &  0.000714 &  0.000357 \tabularnewline
M10 & +2.252e+04 &  1.074e+04 & +2.0970e+00 &  0.04142 &  0.02071 \tabularnewline
M11 & -3486 &  1.074e+04 & -3.2460e-01 &  0.7469 &  0.3735 \tabularnewline
t & +455 &  129.2 & +3.5230e+00 &  0.0009615 &  0.0004808 \tabularnewline
\hline
\end{tabular}
%Source: https://freestatistics.org/blog/index.php?pk=284873&T=2

[TABLE]
[ROW][C]Multiple Linear Regression - Ordinary Least Squares[/C][/ROW]
[ROW][C]Variable[/C][C]Parameter[/C][C]S.D.[/C][C]T-STATH0: parameter = 0[/C][C]2-tail p-value[/C][C]1-tail p-value[/C][/ROW]
[ROW][C](Intercept)[/C][C]+1.749e+05[/C][C] 8904[/C][C]+1.9640e+01[/C][C] 2.698e-24[/C][C] 1.349e-24[/C][/ROW]
[ROW][C]M1[/C][C]-6.267e+04[/C][C] 1.083e+04[/C][C]-5.7860e+00[/C][C] 5.665e-07[/C][C] 2.833e-07[/C][/ROW]
[ROW][C]M2[/C][C]+1.767e+04[/C][C] 1.082e+04[/C][C]+1.6340e+00[/C][C] 0.109[/C][C] 0.05448[/C][/ROW]
[ROW][C]M3[/C][C]+1.185e+04[/C][C] 1.08e+04[/C][C]+1.0970e+00[/C][C] 0.2782[/C][C] 0.1391[/C][/ROW]
[ROW][C]M4[/C][C]+8.48e+04[/C][C] 1.079e+04[/C][C]+7.8610e+00[/C][C] 4.108e-10[/C][C] 2.054e-10[/C][/ROW]
[ROW][C]M5[/C][C]+2.789e+04[/C][C] 1.078e+04[/C][C]+2.5880e+00[/C][C] 0.0128[/C][C] 0.006402[/C][/ROW]
[ROW][C]M6[/C][C]-2.22e+04[/C][C] 1.077e+04[/C][C]-2.0620e+00[/C][C] 0.04481[/C][C] 0.0224[/C][/ROW]
[ROW][C]M7[/C][C]-1.303e+04[/C][C] 1.076e+04[/C][C]-1.2120e+00[/C][C] 0.2317[/C][C] 0.1159[/C][/ROW]
[ROW][C]M8[/C][C]+3.788e+04[/C][C] 1.075e+04[/C][C]+3.5240e+00[/C][C] 0.0009599[/C][C] 0.0004799[/C][/ROW]
[ROW][C]M9[/C][C]-3.892e+04[/C][C] 1.074e+04[/C][C]-3.6220e+00[/C][C] 0.000714[/C][C] 0.000357[/C][/ROW]
[ROW][C]M10[/C][C]+2.252e+04[/C][C] 1.074e+04[/C][C]+2.0970e+00[/C][C] 0.04142[/C][C] 0.02071[/C][/ROW]
[ROW][C]M11[/C][C]-3486[/C][C] 1.074e+04[/C][C]-3.2460e-01[/C][C] 0.7469[/C][C] 0.3735[/C][/ROW]
[ROW][C]t[/C][C]+455[/C][C] 129.2[/C][C]+3.5230e+00[/C][C] 0.0009615[/C][C] 0.0004808[/C][/ROW]
[/TABLE]
Source: https://freestatistics.org/blog/index.php?pk=284873&T=2

Globally Unique Identifier (entire table): ba.freestatistics.org/blog/index.php?pk=284873&T=2

As an alternative you can also use a QR Code:  

The GUIDs for individual cells are displayed in the table below:

Multiple Linear Regression - Ordinary Least Squares
VariableParameterS.D.T-STATH0: parameter = 02-tail p-value1-tail p-value
(Intercept)+1.749e+05 8904+1.9640e+01 2.698e-24 1.349e-24
M1-6.267e+04 1.083e+04-5.7860e+00 5.665e-07 2.833e-07
M2+1.767e+04 1.082e+04+1.6340e+00 0.109 0.05448
M3+1.185e+04 1.08e+04+1.0970e+00 0.2782 0.1391
M4+8.48e+04 1.079e+04+7.8610e+00 4.108e-10 2.054e-10
M5+2.789e+04 1.078e+04+2.5880e+00 0.0128 0.006402
M6-2.22e+04 1.077e+04-2.0620e+00 0.04481 0.0224
M7-1.303e+04 1.076e+04-1.2120e+00 0.2317 0.1159
M8+3.788e+04 1.075e+04+3.5240e+00 0.0009599 0.0004799
M9-3.892e+04 1.074e+04-3.6220e+00 0.000714 0.000357
M10+2.252e+04 1.074e+04+2.0970e+00 0.04142 0.02071
M11-3486 1.074e+04-3.2460e-01 0.7469 0.3735
t+455 129.2+3.5230e+00 0.0009615 0.0004808


Multiple Linear Regression - Regression Statistics
Multiple R 0.9283
R-squared 0.8618
Adjusted R-squared 0.8265
F-TEST (value) 24.43
F-TEST (DF numerator)12
F-TEST (DF denominator)47
p-value 3.331e-16
Multiple Linear Regression - Residual Statistics
Residual Standard Deviation 1.698e+04
Sum Squared Residuals 1.355e+10

\begin{tabular}{lllllllll}
\hline
Multiple Linear Regression - Regression Statistics \tabularnewline
Multiple R &  0.9283 \tabularnewline
R-squared &  0.8618 \tabularnewline
Adjusted R-squared &  0.8265 \tabularnewline
F-TEST (value) &  24.43 \tabularnewline
F-TEST (DF numerator) & 12 \tabularnewline
F-TEST (DF denominator) & 47 \tabularnewline
p-value &  3.331e-16 \tabularnewline
Multiple Linear Regression - Residual Statistics \tabularnewline
Residual Standard Deviation &  1.698e+04 \tabularnewline
Sum Squared Residuals &  1.355e+10 \tabularnewline
\hline
\end{tabular}
%Source: https://freestatistics.org/blog/index.php?pk=284873&T=3

[TABLE]
[ROW][C]Multiple Linear Regression - Regression Statistics[/C][/ROW]
[ROW][C]Multiple R[/C][C] 0.9283[/C][/ROW]
[ROW][C]R-squared[/C][C] 0.8618[/C][/ROW]
[ROW][C]Adjusted R-squared[/C][C] 0.8265[/C][/ROW]
[ROW][C]F-TEST (value)[/C][C] 24.43[/C][/ROW]
[ROW][C]F-TEST (DF numerator)[/C][C]12[/C][/ROW]
[ROW][C]F-TEST (DF denominator)[/C][C]47[/C][/ROW]
[ROW][C]p-value[/C][C] 3.331e-16[/C][/ROW]
[ROW][C]Multiple Linear Regression - Residual Statistics[/C][/ROW]
[ROW][C]Residual Standard Deviation[/C][C] 1.698e+04[/C][/ROW]
[ROW][C]Sum Squared Residuals[/C][C] 1.355e+10[/C][/ROW]
[/TABLE]
Source: https://freestatistics.org/blog/index.php?pk=284873&T=3

Globally Unique Identifier (entire table): ba.freestatistics.org/blog/index.php?pk=284873&T=3

As an alternative you can also use a QR Code:  

The GUIDs for individual cells are displayed in the table below:

Multiple Linear Regression - Regression Statistics
Multiple R 0.9283
R-squared 0.8618
Adjusted R-squared 0.8265
F-TEST (value) 24.43
F-TEST (DF numerator)12
F-TEST (DF denominator)47
p-value 3.331e-16
Multiple Linear Regression - Residual Statistics
Residual Standard Deviation 1.698e+04
Sum Squared Residuals 1.355e+10


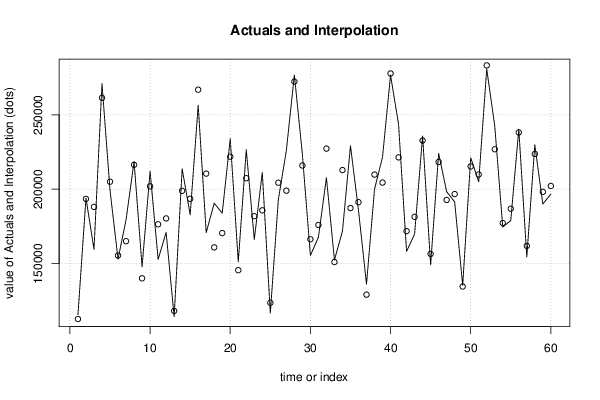
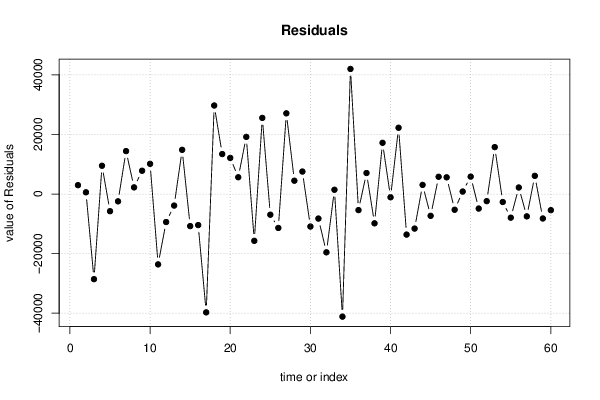
Multiple Linear Regression - Actuals, Interpolation, and Residuals
Time or IndexActualsInterpolationForecastResidualsPrediction Error
1 1.156e+05 1.126e+05 2963
2 1.94e+05 1.934e+05 569.4
3 1.595e+05 1.881e+05-2.857e+04
4 2.71e+05 2.615e+05 9476
5 1.993e+05 2.05e+05-5769
6 1.529e+05 1.554e+05-2463
7 1.794e+05 1.65e+05 1.439e+04
8 2.186e+05 2.164e+05 2223
9 1.478e+05 1.4e+05 7800
10 2.121e+05 2.019e+05 1.012e+04
11 1.528e+05 1.764e+05-2.362e+04
12 1.709e+05 1.803e+05-9407
13 1.142e+05 1.181e+05-3883
14 2.137e+05 1.989e+05 1.482e+04
15 1.828e+05 1.935e+05-1.077e+04
16 2.565e+05 2.669e+05-1.043e+04
17 1.708e+05 2.105e+05-3.971e+04
18 1.905e+05 1.609e+05 2.969e+04
19 1.839e+05 1.705e+05 1.34e+04
20 2.34e+05 2.218e+05 1.211e+04
21 1.511e+05 1.455e+05 5612
22 2.266e+05 2.074e+05 1.916e+04
23 1.661e+05 1.818e+05-1.571e+04
24 2.113e+05 1.858e+05 2.553e+04
25 1.166e+05 1.236e+05-6946
26 1.93e+05 2.044e+05-1.139e+04
27 2.261e+05 1.99e+05 2.706e+04
28 2.769e+05 2.724e+05 4458
29 2.235e+05 2.159e+05 7533
30 1.554e+05 1.663e+05-1.091e+04
31 1.677e+05 1.759e+05-8244
32 2.077e+05 2.273e+05-1.957e+04
33 1.524e+05 1.51e+05 1422
34 1.717e+05 2.129e+05-4.115e+04
35 2.293e+05 1.873e+05 4.195e+04
36 1.858e+05 1.912e+05-5404
37 1.361e+05 1.29e+05 7036
38 2e+05 2.098e+05-9837
39 2.216e+05 2.045e+05 1.718e+04
40 2.768e+05 2.779e+05-1097
41 2.436e+05 2.214e+05 2.223e+04
42 1.582e+05 1.718e+05-1.362e+04
43 1.698e+05 1.814e+05-1.16e+04
44 2.358e+05 2.328e+05 3056
45 1.491e+05 1.564e+05-7329
46 2.241e+05 2.183e+05 5775
47 1.984e+05 1.928e+05 5593
48 1.914e+05 1.967e+05-5288
49 1.353e+05 1.345e+05 830.6
50 2.211e+05 2.153e+05 5834
51 2.05e+05 2.099e+05-4887
52 2.809e+05 2.833e+05-2408
53 2.426e+05 2.269e+05 1.572e+04
54 1.746e+05 1.772e+05-2688
55 1.789e+05 1.869e+05-7946
56 2.404e+05 2.382e+05 2180
57 1.544e+05 1.619e+05-7504
58 2.299e+05 2.238e+05 6092
59 1.9e+05 1.982e+05-8216
60 1.967e+05 2.022e+05-5431

\begin{tabular}{lllllllll}
\hline
Multiple Linear Regression - Actuals, Interpolation, and Residuals \tabularnewline
Time or Index & Actuals & InterpolationForecast & ResidualsPrediction Error \tabularnewline
1 &  1.156e+05 &  1.126e+05 &  2963 \tabularnewline
2 &  1.94e+05 &  1.934e+05 &  569.4 \tabularnewline
3 &  1.595e+05 &  1.881e+05 & -2.857e+04 \tabularnewline
4 &  2.71e+05 &  2.615e+05 &  9476 \tabularnewline
5 &  1.993e+05 &  2.05e+05 & -5769 \tabularnewline
6 &  1.529e+05 &  1.554e+05 & -2463 \tabularnewline
7 &  1.794e+05 &  1.65e+05 &  1.439e+04 \tabularnewline
8 &  2.186e+05 &  2.164e+05 &  2223 \tabularnewline
9 &  1.478e+05 &  1.4e+05 &  7800 \tabularnewline
10 &  2.121e+05 &  2.019e+05 &  1.012e+04 \tabularnewline
11 &  1.528e+05 &  1.764e+05 & -2.362e+04 \tabularnewline
12 &  1.709e+05 &  1.803e+05 & -9407 \tabularnewline
13 &  1.142e+05 &  1.181e+05 & -3883 \tabularnewline
14 &  2.137e+05 &  1.989e+05 &  1.482e+04 \tabularnewline
15 &  1.828e+05 &  1.935e+05 & -1.077e+04 \tabularnewline
16 &  2.565e+05 &  2.669e+05 & -1.043e+04 \tabularnewline
17 &  1.708e+05 &  2.105e+05 & -3.971e+04 \tabularnewline
18 &  1.905e+05 &  1.609e+05 &  2.969e+04 \tabularnewline
19 &  1.839e+05 &  1.705e+05 &  1.34e+04 \tabularnewline
20 &  2.34e+05 &  2.218e+05 &  1.211e+04 \tabularnewline
21 &  1.511e+05 &  1.455e+05 &  5612 \tabularnewline
22 &  2.266e+05 &  2.074e+05 &  1.916e+04 \tabularnewline
23 &  1.661e+05 &  1.818e+05 & -1.571e+04 \tabularnewline
24 &  2.113e+05 &  1.858e+05 &  2.553e+04 \tabularnewline
25 &  1.166e+05 &  1.236e+05 & -6946 \tabularnewline
26 &  1.93e+05 &  2.044e+05 & -1.139e+04 \tabularnewline
27 &  2.261e+05 &  1.99e+05 &  2.706e+04 \tabularnewline
28 &  2.769e+05 &  2.724e+05 &  4458 \tabularnewline
29 &  2.235e+05 &  2.159e+05 &  7533 \tabularnewline
30 &  1.554e+05 &  1.663e+05 & -1.091e+04 \tabularnewline
31 &  1.677e+05 &  1.759e+05 & -8244 \tabularnewline
32 &  2.077e+05 &  2.273e+05 & -1.957e+04 \tabularnewline
33 &  1.524e+05 &  1.51e+05 &  1422 \tabularnewline
34 &  1.717e+05 &  2.129e+05 & -4.115e+04 \tabularnewline
35 &  2.293e+05 &  1.873e+05 &  4.195e+04 \tabularnewline
36 &  1.858e+05 &  1.912e+05 & -5404 \tabularnewline
37 &  1.361e+05 &  1.29e+05 &  7036 \tabularnewline
38 &  2e+05 &  2.098e+05 & -9837 \tabularnewline
39 &  2.216e+05 &  2.045e+05 &  1.718e+04 \tabularnewline
40 &  2.768e+05 &  2.779e+05 & -1097 \tabularnewline
41 &  2.436e+05 &  2.214e+05 &  2.223e+04 \tabularnewline
42 &  1.582e+05 &  1.718e+05 & -1.362e+04 \tabularnewline
43 &  1.698e+05 &  1.814e+05 & -1.16e+04 \tabularnewline
44 &  2.358e+05 &  2.328e+05 &  3056 \tabularnewline
45 &  1.491e+05 &  1.564e+05 & -7329 \tabularnewline
46 &  2.241e+05 &  2.183e+05 &  5775 \tabularnewline
47 &  1.984e+05 &  1.928e+05 &  5593 \tabularnewline
48 &  1.914e+05 &  1.967e+05 & -5288 \tabularnewline
49 &  1.353e+05 &  1.345e+05 &  830.6 \tabularnewline
50 &  2.211e+05 &  2.153e+05 &  5834 \tabularnewline
51 &  2.05e+05 &  2.099e+05 & -4887 \tabularnewline
52 &  2.809e+05 &  2.833e+05 & -2408 \tabularnewline
53 &  2.426e+05 &  2.269e+05 &  1.572e+04 \tabularnewline
54 &  1.746e+05 &  1.772e+05 & -2688 \tabularnewline
55 &  1.789e+05 &  1.869e+05 & -7946 \tabularnewline
56 &  2.404e+05 &  2.382e+05 &  2180 \tabularnewline
57 &  1.544e+05 &  1.619e+05 & -7504 \tabularnewline
58 &  2.299e+05 &  2.238e+05 &  6092 \tabularnewline
59 &  1.9e+05 &  1.982e+05 & -8216 \tabularnewline
60 &  1.967e+05 &  2.022e+05 & -5431 \tabularnewline
\hline
\end{tabular}
%Source: https://freestatistics.org/blog/index.php?pk=284873&T=4

[TABLE]
[ROW][C]Multiple Linear Regression - Actuals, Interpolation, and Residuals[/C][/ROW]
[ROW][C]Time or Index[/C][C]Actuals[/C][C]InterpolationForecast[/C][C]ResidualsPrediction Error[/C][/ROW]
[ROW][C]1[/C][C] 1.156e+05[/C][C] 1.126e+05[/C][C] 2963[/C][/ROW]
[ROW][C]2[/C][C] 1.94e+05[/C][C] 1.934e+05[/C][C] 569.4[/C][/ROW]
[ROW][C]3[/C][C] 1.595e+05[/C][C] 1.881e+05[/C][C]-2.857e+04[/C][/ROW]
[ROW][C]4[/C][C] 2.71e+05[/C][C] 2.615e+05[/C][C] 9476[/C][/ROW]
[ROW][C]5[/C][C] 1.993e+05[/C][C] 2.05e+05[/C][C]-5769[/C][/ROW]
[ROW][C]6[/C][C] 1.529e+05[/C][C] 1.554e+05[/C][C]-2463[/C][/ROW]
[ROW][C]7[/C][C] 1.794e+05[/C][C] 1.65e+05[/C][C] 1.439e+04[/C][/ROW]
[ROW][C]8[/C][C] 2.186e+05[/C][C] 2.164e+05[/C][C] 2223[/C][/ROW]
[ROW][C]9[/C][C] 1.478e+05[/C][C] 1.4e+05[/C][C] 7800[/C][/ROW]
[ROW][C]10[/C][C] 2.121e+05[/C][C] 2.019e+05[/C][C] 1.012e+04[/C][/ROW]
[ROW][C]11[/C][C] 1.528e+05[/C][C] 1.764e+05[/C][C]-2.362e+04[/C][/ROW]
[ROW][C]12[/C][C] 1.709e+05[/C][C] 1.803e+05[/C][C]-9407[/C][/ROW]
[ROW][C]13[/C][C] 1.142e+05[/C][C] 1.181e+05[/C][C]-3883[/C][/ROW]
[ROW][C]14[/C][C] 2.137e+05[/C][C] 1.989e+05[/C][C] 1.482e+04[/C][/ROW]
[ROW][C]15[/C][C] 1.828e+05[/C][C] 1.935e+05[/C][C]-1.077e+04[/C][/ROW]
[ROW][C]16[/C][C] 2.565e+05[/C][C] 2.669e+05[/C][C]-1.043e+04[/C][/ROW]
[ROW][C]17[/C][C] 1.708e+05[/C][C] 2.105e+05[/C][C]-3.971e+04[/C][/ROW]
[ROW][C]18[/C][C] 1.905e+05[/C][C] 1.609e+05[/C][C] 2.969e+04[/C][/ROW]
[ROW][C]19[/C][C] 1.839e+05[/C][C] 1.705e+05[/C][C] 1.34e+04[/C][/ROW]
[ROW][C]20[/C][C] 2.34e+05[/C][C] 2.218e+05[/C][C] 1.211e+04[/C][/ROW]
[ROW][C]21[/C][C] 1.511e+05[/C][C] 1.455e+05[/C][C] 5612[/C][/ROW]
[ROW][C]22[/C][C] 2.266e+05[/C][C] 2.074e+05[/C][C] 1.916e+04[/C][/ROW]
[ROW][C]23[/C][C] 1.661e+05[/C][C] 1.818e+05[/C][C]-1.571e+04[/C][/ROW]
[ROW][C]24[/C][C] 2.113e+05[/C][C] 1.858e+05[/C][C] 2.553e+04[/C][/ROW]
[ROW][C]25[/C][C] 1.166e+05[/C][C] 1.236e+05[/C][C]-6946[/C][/ROW]
[ROW][C]26[/C][C] 1.93e+05[/C][C] 2.044e+05[/C][C]-1.139e+04[/C][/ROW]
[ROW][C]27[/C][C] 2.261e+05[/C][C] 1.99e+05[/C][C] 2.706e+04[/C][/ROW]
[ROW][C]28[/C][C] 2.769e+05[/C][C] 2.724e+05[/C][C] 4458[/C][/ROW]
[ROW][C]29[/C][C] 2.235e+05[/C][C] 2.159e+05[/C][C] 7533[/C][/ROW]
[ROW][C]30[/C][C] 1.554e+05[/C][C] 1.663e+05[/C][C]-1.091e+04[/C][/ROW]
[ROW][C]31[/C][C] 1.677e+05[/C][C] 1.759e+05[/C][C]-8244[/C][/ROW]
[ROW][C]32[/C][C] 2.077e+05[/C][C] 2.273e+05[/C][C]-1.957e+04[/C][/ROW]
[ROW][C]33[/C][C] 1.524e+05[/C][C] 1.51e+05[/C][C] 1422[/C][/ROW]
[ROW][C]34[/C][C] 1.717e+05[/C][C] 2.129e+05[/C][C]-4.115e+04[/C][/ROW]
[ROW][C]35[/C][C] 2.293e+05[/C][C] 1.873e+05[/C][C] 4.195e+04[/C][/ROW]
[ROW][C]36[/C][C] 1.858e+05[/C][C] 1.912e+05[/C][C]-5404[/C][/ROW]
[ROW][C]37[/C][C] 1.361e+05[/C][C] 1.29e+05[/C][C] 7036[/C][/ROW]
[ROW][C]38[/C][C] 2e+05[/C][C] 2.098e+05[/C][C]-9837[/C][/ROW]
[ROW][C]39[/C][C] 2.216e+05[/C][C] 2.045e+05[/C][C] 1.718e+04[/C][/ROW]
[ROW][C]40[/C][C] 2.768e+05[/C][C] 2.779e+05[/C][C]-1097[/C][/ROW]
[ROW][C]41[/C][C] 2.436e+05[/C][C] 2.214e+05[/C][C] 2.223e+04[/C][/ROW]
[ROW][C]42[/C][C] 1.582e+05[/C][C] 1.718e+05[/C][C]-1.362e+04[/C][/ROW]
[ROW][C]43[/C][C] 1.698e+05[/C][C] 1.814e+05[/C][C]-1.16e+04[/C][/ROW]
[ROW][C]44[/C][C] 2.358e+05[/C][C] 2.328e+05[/C][C] 3056[/C][/ROW]
[ROW][C]45[/C][C] 1.491e+05[/C][C] 1.564e+05[/C][C]-7329[/C][/ROW]
[ROW][C]46[/C][C] 2.241e+05[/C][C] 2.183e+05[/C][C] 5775[/C][/ROW]
[ROW][C]47[/C][C] 1.984e+05[/C][C] 1.928e+05[/C][C] 5593[/C][/ROW]
[ROW][C]48[/C][C] 1.914e+05[/C][C] 1.967e+05[/C][C]-5288[/C][/ROW]
[ROW][C]49[/C][C] 1.353e+05[/C][C] 1.345e+05[/C][C] 830.6[/C][/ROW]
[ROW][C]50[/C][C] 2.211e+05[/C][C] 2.153e+05[/C][C] 5834[/C][/ROW]
[ROW][C]51[/C][C] 2.05e+05[/C][C] 2.099e+05[/C][C]-4887[/C][/ROW]
[ROW][C]52[/C][C] 2.809e+05[/C][C] 2.833e+05[/C][C]-2408[/C][/ROW]
[ROW][C]53[/C][C] 2.426e+05[/C][C] 2.269e+05[/C][C] 1.572e+04[/C][/ROW]
[ROW][C]54[/C][C] 1.746e+05[/C][C] 1.772e+05[/C][C]-2688[/C][/ROW]
[ROW][C]55[/C][C] 1.789e+05[/C][C] 1.869e+05[/C][C]-7946[/C][/ROW]
[ROW][C]56[/C][C] 2.404e+05[/C][C] 2.382e+05[/C][C] 2180[/C][/ROW]
[ROW][C]57[/C][C] 1.544e+05[/C][C] 1.619e+05[/C][C]-7504[/C][/ROW]
[ROW][C]58[/C][C] 2.299e+05[/C][C] 2.238e+05[/C][C] 6092[/C][/ROW]
[ROW][C]59[/C][C] 1.9e+05[/C][C] 1.982e+05[/C][C]-8216[/C][/ROW]
[ROW][C]60[/C][C] 1.967e+05[/C][C] 2.022e+05[/C][C]-5431[/C][/ROW]
[/TABLE]
Source: https://freestatistics.org/blog/index.php?pk=284873&T=4

Globally Unique Identifier (entire table): ba.freestatistics.org/blog/index.php?pk=284873&T=4

As an alternative you can also use a QR Code:  

The GUIDs for individual cells are displayed in the table below:

Multiple Linear Regression - Actuals, Interpolation, and Residuals
Time or IndexActualsInterpolationForecastResidualsPrediction Error
1 1.156e+05 1.126e+05 2963
2 1.94e+05 1.934e+05 569.4
3 1.595e+05 1.881e+05-2.857e+04
4 2.71e+05 2.615e+05 9476
5 1.993e+05 2.05e+05-5769
6 1.529e+05 1.554e+05-2463
7 1.794e+05 1.65e+05 1.439e+04
8 2.186e+05 2.164e+05 2223
9 1.478e+05 1.4e+05 7800
10 2.121e+05 2.019e+05 1.012e+04
11 1.528e+05 1.764e+05-2.362e+04
12 1.709e+05 1.803e+05-9407
13 1.142e+05 1.181e+05-3883
14 2.137e+05 1.989e+05 1.482e+04
15 1.828e+05 1.935e+05-1.077e+04
16 2.565e+05 2.669e+05-1.043e+04
17 1.708e+05 2.105e+05-3.971e+04
18 1.905e+05 1.609e+05 2.969e+04
19 1.839e+05 1.705e+05 1.34e+04
20 2.34e+05 2.218e+05 1.211e+04
21 1.511e+05 1.455e+05 5612
22 2.266e+05 2.074e+05 1.916e+04
23 1.661e+05 1.818e+05-1.571e+04
24 2.113e+05 1.858e+05 2.553e+04
25 1.166e+05 1.236e+05-6946
26 1.93e+05 2.044e+05-1.139e+04
27 2.261e+05 1.99e+05 2.706e+04
28 2.769e+05 2.724e+05 4458
29 2.235e+05 2.159e+05 7533
30 1.554e+05 1.663e+05-1.091e+04
31 1.677e+05 1.759e+05-8244
32 2.077e+05 2.273e+05-1.957e+04
33 1.524e+05 1.51e+05 1422
34 1.717e+05 2.129e+05-4.115e+04
35 2.293e+05 1.873e+05 4.195e+04
36 1.858e+05 1.912e+05-5404
37 1.361e+05 1.29e+05 7036
38 2e+05 2.098e+05-9837
39 2.216e+05 2.045e+05 1.718e+04
40 2.768e+05 2.779e+05-1097
41 2.436e+05 2.214e+05 2.223e+04
42 1.582e+05 1.718e+05-1.362e+04
43 1.698e+05 1.814e+05-1.16e+04
44 2.358e+05 2.328e+05 3056
45 1.491e+05 1.564e+05-7329
46 2.241e+05 2.183e+05 5775
47 1.984e+05 1.928e+05 5593
48 1.914e+05 1.967e+05-5288
49 1.353e+05 1.345e+05 830.6
50 2.211e+05 2.153e+05 5834
51 2.05e+05 2.099e+05-4887
52 2.809e+05 2.833e+05-2408
53 2.426e+05 2.269e+05 1.572e+04
54 1.746e+05 1.772e+05-2688
55 1.789e+05 1.869e+05-7946
56 2.404e+05 2.382e+05 2180
57 1.544e+05 1.619e+05-7504
58 2.299e+05 2.238e+05 6092
59 1.9e+05 1.982e+05-8216
60 1.967e+05 2.022e+05-5431


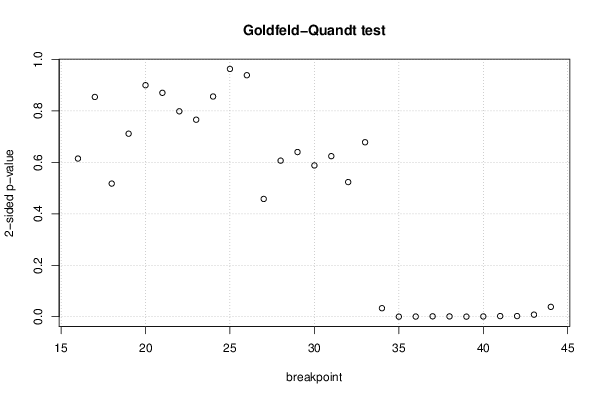
Goldfeld-Quandt test for Heteroskedasticity
p-valuesAlternative Hypothesis
breakpoint indexgreater2-sidedless
16 0.3075 0.6149 0.6925
17 0.5728 0.8544 0.4272
18 0.7412 0.5176 0.2588
19 0.6442 0.7116 0.3558
20 0.5499 0.9002 0.4501
21 0.4353 0.8706 0.5647
22 0.3994 0.7987 0.6006
23 0.383 0.7659 0.617
24 0.5719 0.8562 0.4281
25 0.5183 0.9634 0.4817
26 0.5305 0.939 0.4695
27 0.7711 0.4579 0.2289
28 0.6966 0.6068 0.3034
29 0.6799 0.6403 0.3201
30 0.7059 0.5881 0.2941
31 0.6879 0.6242 0.3121
32 0.7382 0.5235 0.2618
33 0.6608 0.6783 0.3392
34 0.9835 0.03307 0.01653
35 0.9999 0.0001683 8.414e-05
36 0.9997 0.0005144 0.0002572
37 0.9993 0.001459 0.0007297
38 0.9995 0.001081 0.0005407
39 0.9999 0.0002067 0.0001034
40 0.9995 0.0009363 0.0004681
41 0.9988 0.002409 0.001205
42 0.9988 0.002459 0.00123
43 0.9961 0.00787 0.003935
44 0.9809 0.03823 0.01911

\begin{tabular}{lllllllll}
\hline
Goldfeld-Quandt test for Heteroskedasticity \tabularnewline
p-values & Alternative Hypothesis \tabularnewline
breakpoint index & greater & 2-sided & less \tabularnewline
16 &  0.3075 &  0.6149 &  0.6925 \tabularnewline
17 &  0.5728 &  0.8544 &  0.4272 \tabularnewline
18 &  0.7412 &  0.5176 &  0.2588 \tabularnewline
19 &  0.6442 &  0.7116 &  0.3558 \tabularnewline
20 &  0.5499 &  0.9002 &  0.4501 \tabularnewline
21 &  0.4353 &  0.8706 &  0.5647 \tabularnewline
22 &  0.3994 &  0.7987 &  0.6006 \tabularnewline
23 &  0.383 &  0.7659 &  0.617 \tabularnewline
24 &  0.5719 &  0.8562 &  0.4281 \tabularnewline
25 &  0.5183 &  0.9634 &  0.4817 \tabularnewline
26 &  0.5305 &  0.939 &  0.4695 \tabularnewline
27 &  0.7711 &  0.4579 &  0.2289 \tabularnewline
28 &  0.6966 &  0.6068 &  0.3034 \tabularnewline
29 &  0.6799 &  0.6403 &  0.3201 \tabularnewline
30 &  0.7059 &  0.5881 &  0.2941 \tabularnewline
31 &  0.6879 &  0.6242 &  0.3121 \tabularnewline
32 &  0.7382 &  0.5235 &  0.2618 \tabularnewline
33 &  0.6608 &  0.6783 &  0.3392 \tabularnewline
34 &  0.9835 &  0.03307 &  0.01653 \tabularnewline
35 &  0.9999 &  0.0001683 &  8.414e-05 \tabularnewline
36 &  0.9997 &  0.0005144 &  0.0002572 \tabularnewline
37 &  0.9993 &  0.001459 &  0.0007297 \tabularnewline
38 &  0.9995 &  0.001081 &  0.0005407 \tabularnewline
39 &  0.9999 &  0.0002067 &  0.0001034 \tabularnewline
40 &  0.9995 &  0.0009363 &  0.0004681 \tabularnewline
41 &  0.9988 &  0.002409 &  0.001205 \tabularnewline
42 &  0.9988 &  0.002459 &  0.00123 \tabularnewline
43 &  0.9961 &  0.00787 &  0.003935 \tabularnewline
44 &  0.9809 &  0.03823 &  0.01911 \tabularnewline
\hline
\end{tabular}
%Source: https://freestatistics.org/blog/index.php?pk=284873&T=5

[TABLE]
[ROW][C]Goldfeld-Quandt test for Heteroskedasticity[/C][/ROW]
[ROW][C]p-values[/C][C]Alternative Hypothesis[/C][/ROW]
[ROW][C]breakpoint index[/C][C]greater[/C][C]2-sided[/C][C]less[/C][/ROW]
[ROW][C]16[/C][C] 0.3075[/C][C] 0.6149[/C][C] 0.6925[/C][/ROW]
[ROW][C]17[/C][C] 0.5728[/C][C] 0.8544[/C][C] 0.4272[/C][/ROW]
[ROW][C]18[/C][C] 0.7412[/C][C] 0.5176[/C][C] 0.2588[/C][/ROW]
[ROW][C]19[/C][C] 0.6442[/C][C] 0.7116[/C][C] 0.3558[/C][/ROW]
[ROW][C]20[/C][C] 0.5499[/C][C] 0.9002[/C][C] 0.4501[/C][/ROW]
[ROW][C]21[/C][C] 0.4353[/C][C] 0.8706[/C][C] 0.5647[/C][/ROW]
[ROW][C]22[/C][C] 0.3994[/C][C] 0.7987[/C][C] 0.6006[/C][/ROW]
[ROW][C]23[/C][C] 0.383[/C][C] 0.7659[/C][C] 0.617[/C][/ROW]
[ROW][C]24[/C][C] 0.5719[/C][C] 0.8562[/C][C] 0.4281[/C][/ROW]
[ROW][C]25[/C][C] 0.5183[/C][C] 0.9634[/C][C] 0.4817[/C][/ROW]
[ROW][C]26[/C][C] 0.5305[/C][C] 0.939[/C][C] 0.4695[/C][/ROW]
[ROW][C]27[/C][C] 0.7711[/C][C] 0.4579[/C][C] 0.2289[/C][/ROW]
[ROW][C]28[/C][C] 0.6966[/C][C] 0.6068[/C][C] 0.3034[/C][/ROW]
[ROW][C]29[/C][C] 0.6799[/C][C] 0.6403[/C][C] 0.3201[/C][/ROW]
[ROW][C]30[/C][C] 0.7059[/C][C] 0.5881[/C][C] 0.2941[/C][/ROW]
[ROW][C]31[/C][C] 0.6879[/C][C] 0.6242[/C][C] 0.3121[/C][/ROW]
[ROW][C]32[/C][C] 0.7382[/C][C] 0.5235[/C][C] 0.2618[/C][/ROW]
[ROW][C]33[/C][C] 0.6608[/C][C] 0.6783[/C][C] 0.3392[/C][/ROW]
[ROW][C]34[/C][C] 0.9835[/C][C] 0.03307[/C][C] 0.01653[/C][/ROW]
[ROW][C]35[/C][C] 0.9999[/C][C] 0.0001683[/C][C] 8.414e-05[/C][/ROW]
[ROW][C]36[/C][C] 0.9997[/C][C] 0.0005144[/C][C] 0.0002572[/C][/ROW]
[ROW][C]37[/C][C] 0.9993[/C][C] 0.001459[/C][C] 0.0007297[/C][/ROW]
[ROW][C]38[/C][C] 0.9995[/C][C] 0.001081[/C][C] 0.0005407[/C][/ROW]
[ROW][C]39[/C][C] 0.9999[/C][C] 0.0002067[/C][C] 0.0001034[/C][/ROW]
[ROW][C]40[/C][C] 0.9995[/C][C] 0.0009363[/C][C] 0.0004681[/C][/ROW]
[ROW][C]41[/C][C] 0.9988[/C][C] 0.002409[/C][C] 0.001205[/C][/ROW]
[ROW][C]42[/C][C] 0.9988[/C][C] 0.002459[/C][C] 0.00123[/C][/ROW]
[ROW][C]43[/C][C] 0.9961[/C][C] 0.00787[/C][C] 0.003935[/C][/ROW]
[ROW][C]44[/C][C] 0.9809[/C][C] 0.03823[/C][C] 0.01911[/C][/ROW]
[/TABLE]
Source: https://freestatistics.org/blog/index.php?pk=284873&T=5

Globally Unique Identifier (entire table): ba.freestatistics.org/blog/index.php?pk=284873&T=5

As an alternative you can also use a QR Code:  

The GUIDs for individual cells are displayed in the table below:

Goldfeld-Quandt test for Heteroskedasticity
p-valuesAlternative Hypothesis
breakpoint indexgreater2-sidedless
16 0.3075 0.6149 0.6925
17 0.5728 0.8544 0.4272
18 0.7412 0.5176 0.2588
19 0.6442 0.7116 0.3558
20 0.5499 0.9002 0.4501
21 0.4353 0.8706 0.5647
22 0.3994 0.7987 0.6006
23 0.383 0.7659 0.617
24 0.5719 0.8562 0.4281
25 0.5183 0.9634 0.4817
26 0.5305 0.939 0.4695
27 0.7711 0.4579 0.2289
28 0.6966 0.6068 0.3034
29 0.6799 0.6403 0.3201
30 0.7059 0.5881 0.2941
31 0.6879 0.6242 0.3121
32 0.7382 0.5235 0.2618
33 0.6608 0.6783 0.3392
34 0.9835 0.03307 0.01653
35 0.9999 0.0001683 8.414e-05
36 0.9997 0.0005144 0.0002572
37 0.9993 0.001459 0.0007297
38 0.9995 0.001081 0.0005407
39 0.9999 0.0002067 0.0001034
40 0.9995 0.0009363 0.0004681
41 0.9988 0.002409 0.001205
42 0.9988 0.002459 0.00123
43 0.9961 0.00787 0.003935
44 0.9809 0.03823 0.01911


Meta Analysis of Goldfeld-Quandt test for Heteroskedasticity
Description# significant tests% significant testsOK/NOK
1% type I error level9 0.3103NOK
5% type I error level110.37931NOK
10% type I error level110.37931NOK

\begin{tabular}{lllllllll}
\hline
Meta Analysis of Goldfeld-Quandt test for Heteroskedasticity \tabularnewline
Description & # significant tests & % significant tests & OK/NOK \tabularnewline
1% type I error level & 9 &  0.3103 & NOK \tabularnewline
5% type I error level & 11 & 0.37931 & NOK \tabularnewline
10% type I error level & 11 & 0.37931 & NOK \tabularnewline
\hline
\end{tabular}
%Source: https://freestatistics.org/blog/index.php?pk=284873&T=6

[TABLE]
[ROW][C]Meta Analysis of Goldfeld-Quandt test for Heteroskedasticity[/C][/ROW]
[ROW][C]Description[/C][C]# significant tests[/C][C]% significant tests[/C][C]OK/NOK[/C][/ROW]
[ROW][C]1% type I error level[/C][C]9[/C][C] 0.3103[/C][C]NOK[/C][/ROW]
[ROW][C]5% type I error level[/C][C]11[/C][C]0.37931[/C][C]NOK[/C][/ROW]
[ROW][C]10% type I error level[/C][C]11[/C][C]0.37931[/C][C]NOK[/C][/ROW]
[/TABLE]
Source: https://freestatistics.org/blog/index.php?pk=284873&T=6

Globally Unique Identifier (entire table): ba.freestatistics.org/blog/index.php?pk=284873&T=6

As an alternative you can also use a QR Code:  

The GUIDs for individual cells are displayed in the table below:

Meta Analysis of Goldfeld-Quandt test for Heteroskedasticity
Description# significant tests% significant testsOK/NOK
1% type I error level9 0.3103NOK
5% type I error level110.37931NOK
10% type I error level110.37931NOK


Parameters (Session):
par2 = Include Monthly Dummies ; par3 = Linear Trend ;
Parameters (R input):
par1 = ; par2 = Include Monthly Dummies ; par3 = Linear Trend ; par4 = ; par5 = ;
R code (references can be found in the software module):
library(lattice)
library(lmtest)
n25 <- 25 #minimum number of obs. for Goldfeld-Quandt test
mywarning <- ''
par1 <- as.numeric(par1)
if(is.na(par1)) {
par1 <- 1
mywarning = 'Warning: you did not specify the column number of the endogenous series! The first column was selected by default.'
}
if (par4=='') par4 <- 0
par4 <- as.numeric(par4)
if (par5=='') par5 <- 0
par5 <- as.numeric(par5)
x <- na.omit(t(y))
k <- length(x[1,])
n <- length(x[,1])
x1 <- cbind(x[,par1], x[,1:k!=par1])
mycolnames <- c(colnames(x)[par1], colnames(x)[1:k!=par1])
colnames(x1) <- mycolnames #colnames(x)[par1]
x <- x1
if (par3 == 'First Differences'){
x2 <- array(0, dim=c(n-1,k), dimnames=list(1:(n-1), paste('(1-B)',colnames(x),sep='')))
for (i in 1:n-1) {
for (j in 1:k) {
x2[i,j] <- x[i+1,j] - x[i,j]
}
}
x <- x2
}
if(par4 > 0) {
x2 <- array(0, dim=c(n-par4,par4), dimnames=list(1:(n-par4), paste(colnames(x)[par1],'(t-',1:par4,')',sep='')))
for (i in 1:(n-par4)) {
for (j in 1:par4) {
x2[i,j] <- x[i+par4-j,par1]
}
}
x <- cbind(x[(par4+1):n,], x2)
n <- n - par4
}
if (par2 == 'Include Monthly Dummies'){
x2 <- array(0, dim=c(n,11), dimnames=list(1:n, paste('M', seq(1:11), sep ='')))
for (i in 1:11){
x2[seq(i,n,12),i] <- 1
}
x <- cbind(x, x2)
}
if (par2 == 'Include Quarterly Dummies'){
x2 <- array(0, dim=c(n,3), dimnames=list(1:n, paste('Q', seq(1:3), sep ='')))
for (i in 1:3){
x2[seq(i,n,4),i] <- 1
}
x <- cbind(x, x2)
}
k <- length(x[1+par4,])
if (par3 == 'Linear Trend'){
x <- cbind(x, c(1:n))
colnames(x)[k+1] <- 't'
}
x
k <- length(x[1+par4,])
df <- as.data.frame(x)
(mylm <- lm(df))
(mysum <- summary(mylm))
if (n > n25) {
kp3 <- k + 3
nmkm3 <- n - k - 3
gqarr <- array(NA, dim=c(nmkm3-kp3+1,3))
numgqtests <- 0
numsignificant1 <- 0
numsignificant5 <- 0
numsignificant10 <- 0
for (mypoint in kp3:nmkm3) {
j <- 0
numgqtests <- numgqtests + 1
for (myalt in c('greater', 'two.sided', 'less')) {
j <- j + 1
gqarr[mypoint-kp3+1,j] <- gqtest(mylm, point=mypoint, alternative=myalt)$p.value
}
if (gqarr[mypoint-kp3+1,2] < 0.01) numsignificant1 <- numsignificant1 + 1
if (gqarr[mypoint-kp3+1,2] < 0.05) numsignificant5 <- numsignificant5 + 1
if (gqarr[mypoint-kp3+1,2] < 0.10) numsignificant10 <- numsignificant10 + 1
}
gqarr
}
bitmap(file='test0.png')
plot(x[,1], type='l', main='Actuals and Interpolation', ylab='value of Actuals and Interpolation (dots)', xlab='time or index')
points(x[,1]-mysum$resid)
grid()
dev.off()
bitmap(file='test1.png')
plot(mysum$resid, type='b', pch=19, main='Residuals', ylab='value of Residuals', xlab='time or index')
grid()
dev.off()
bitmap(file='test2.png')
hist(mysum$resid, main='Residual Histogram', xlab='values of Residuals')
grid()
dev.off()
bitmap(file='test3.png')
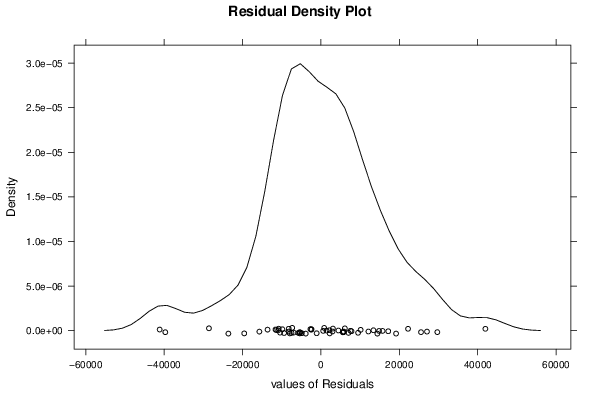
densityplot(~mysum$resid,col='black',main='Residual Density Plot', xlab='values of Residuals')
dev.off()
bitmap(file='test4.png')
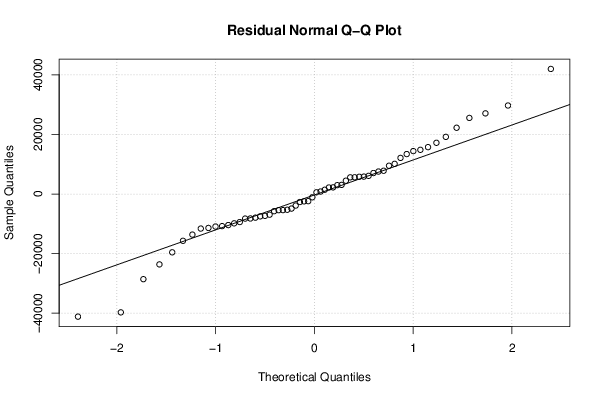
qqnorm(mysum$resid, main='Residual Normal Q-Q Plot')
qqline(mysum$resid)
grid()
dev.off()
(myerror <- as.ts(mysum$resid))
bitmap(file='test5.png')
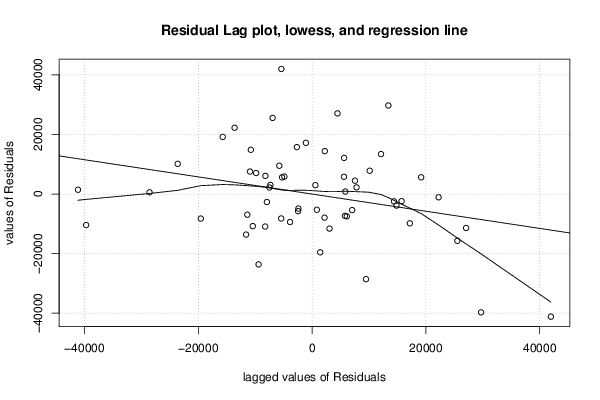
dum <- cbind(lag(myerror,k=1),myerror)
dum
dum1 <- dum[2:length(myerror),]
dum1
z <- as.data.frame(dum1)
z
plot(z,main=paste('Residual Lag plot, lowess, and regression line'), ylab='values of Residuals', xlab='lagged values of Residuals')
lines(lowess(z))
abline(lm(z))
grid()
dev.off()
bitmap(file='test6.png')
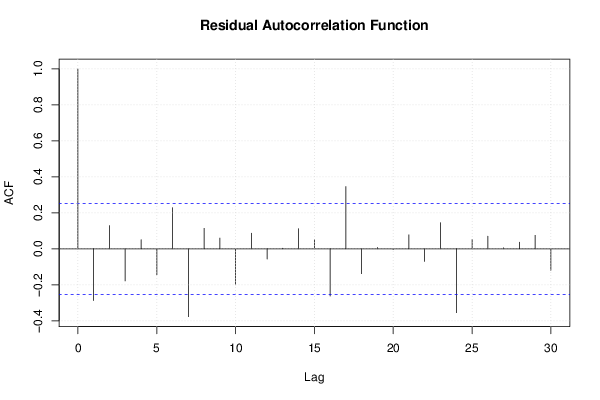
acf(mysum$resid, lag.max=length(mysum$resid)/2, main='Residual Autocorrelation Function')
grid()
dev.off()
bitmap(file='test7.png')
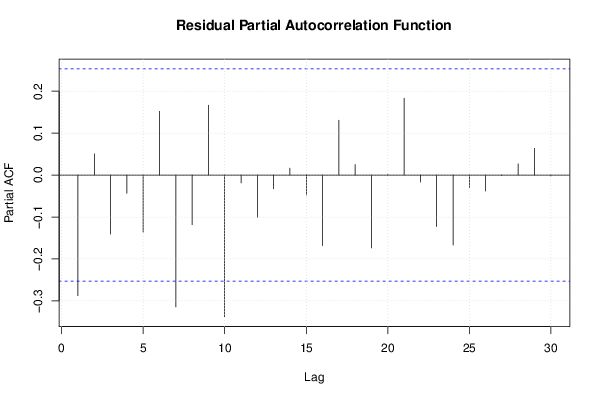
pacf(mysum$resid, lag.max=length(mysum$resid)/2, main='Residual Partial Autocorrelation Function')
grid()
dev.off()
bitmap(file='test8.png')
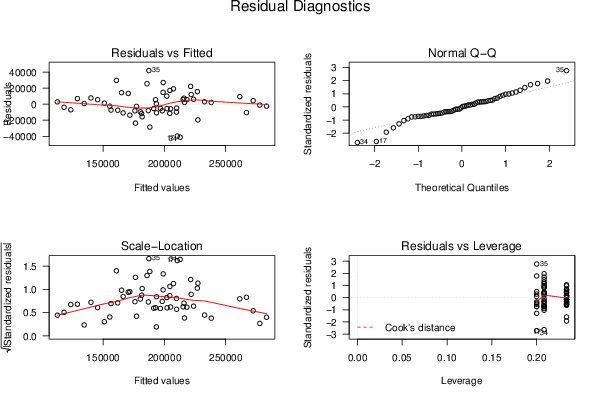
opar <- par(mfrow = c(2,2), oma = c(0, 0, 1.1, 0))
plot(mylm, las = 1, sub='Residual Diagnostics')
par(opar)
dev.off()
if (n > n25) {
bitmap(file='test9.png')
plot(kp3:nmkm3,gqarr[,2], main='Goldfeld-Quandt test',ylab='2-sided p-value',xlab='breakpoint')
grid()
dev.off()
}
load(file='createtable')
a<-table.start()
a<-table.row.start(a)
a<-table.element(a, 'Multiple Linear Regression - Estimated Regression Equation', 1, TRUE)
a<-table.row.end(a)
myeq <- colnames(x)[1]
myeq <- paste(myeq, '[t] = ', sep='')
for (i in 1:k){
if (mysum$coefficients[i,1] > 0) myeq <- paste(myeq, '+', '')
myeq <- paste(myeq, signif(mysum$coefficients[i,1],6), sep=' ')
if (rownames(mysum$coefficients)[i] != '(Intercept)') {
myeq <- paste(myeq, rownames(mysum$coefficients)[i], sep='')
if (rownames(mysum$coefficients)[i] != 't') myeq <- paste(myeq, '[t]', sep='')
}
}
myeq <- paste(myeq, ' + e[t]')
a<-table.row.start(a)
a<-table.element(a, myeq)
a<-table.row.end(a)
a<-table.row.start(a)
a<-table.element(a, mywarning)
a<-table.row.end(a)
a<-table.end(a)
table.save(a,file='mytable1.tab')
a<-table.start()
a<-table.row.start(a)
a<-table.element(a,hyperlink('ols1.htm','Multiple Linear Regression - Ordinary Least Squares',''), 6, TRUE)
a<-table.row.end(a)
a<-table.row.start(a)
a<-table.element(a,'Variable',header=TRUE)
a<-table.element(a,'Parameter',header=TRUE)
a<-table.element(a,'S.D.',header=TRUE)
a<-table.element(a,'T-STAT
H0: parameter = 0',header=TRUE)
a<-table.element(a,'2-tail p-value',header=TRUE)
a<-table.element(a,'1-tail p-value',header=TRUE)
a<-table.row.end(a)
for (i in 1:k){
a<-table.row.start(a)
a<-table.element(a,rownames(mysum$coefficients)[i],header=TRUE)
a<-table.element(a,formatC(signif(mysum$coefficients[i,1],5),format='g',flag='+'))
a<-table.element(a,formatC(signif(mysum$coefficients[i,2],5),format='g',flag=' '))
a<-table.element(a,formatC(signif(mysum$coefficients[i,3],4),format='e',flag='+'))
a<-table.element(a,formatC(signif(mysum$coefficients[i,4],4),format='g',flag=' '))
a<-table.element(a,formatC(signif(mysum$coefficients[i,4]/2,4),format='g',flag=' '))
a<-table.row.end(a)
}
a<-table.end(a)
table.save(a,file='mytable2.tab')
a<-table.start()
a<-table.row.start(a)
a<-table.element(a, 'Multiple Linear Regression - Regression Statistics', 2, TRUE)
a<-table.row.end(a)
a<-table.row.start(a)
a<-table.element(a, 'Multiple R',1,TRUE)
a<-table.element(a,formatC(signif(sqrt(mysum$r.squared),6),format='g',flag=' '))
a<-table.row.end(a)
a<-table.row.start(a)
a<-table.element(a, 'R-squared',1,TRUE)
a<-table.element(a,formatC(signif(mysum$r.squared,6),format='g',flag=' '))
a<-table.row.end(a)
a<-table.row.start(a)
a<-table.element(a, 'Adjusted R-squared',1,TRUE)
a<-table.element(a,formatC(signif(mysum$adj.r.squared,6),format='g',flag=' '))
a<-table.row.end(a)
a<-table.row.start(a)
a<-table.element(a, 'F-TEST (value)',1,TRUE)
a<-table.element(a,formatC(signif(mysum$fstatistic[1],6),format='g',flag=' '))
a<-table.row.end(a)
a<-table.row.start(a)
a<-table.element(a, 'F-TEST (DF numerator)',1,TRUE)
a<-table.element(a, signif(mysum$fstatistic[2],6))
a<-table.row.end(a)
a<-table.row.start(a)
a<-table.element(a, 'F-TEST (DF denominator)',1,TRUE)
a<-table.element(a, signif(mysum$fstatistic[3],6))
a<-table.row.end(a)
a<-table.row.start(a)
a<-table.element(a, 'p-value',1,TRUE)
a<-table.element(a,formatC(signif(1-pf(mysum$fstatistic[1],mysum$fstatistic[2],mysum$fstatistic[3]),6),format='g',flag=' '))
a<-table.row.end(a)
a<-table.row.start(a)
a<-table.element(a, 'Multiple Linear Regression - Residual Statistics', 2, TRUE)
a<-table.row.end(a)
a<-table.row.start(a)
a<-table.element(a, 'Residual Standard Deviation',1,TRUE)
a<-table.element(a,formatC(signif(mysum$sigma,6),format='g',flag=' '))
a<-table.row.end(a)
a<-table.row.start(a)
a<-table.element(a, 'Sum Squared Residuals',1,TRUE)
a<-table.element(a,formatC(signif(sum(myerror*myerror),6),format='g',flag=' '))
a<-table.row.end(a)
a<-table.end(a)
table.save(a,file='mytable3.tab')
if(n < 200) {
a<-table.start()
a<-table.row.start(a)
a<-table.element(a, 'Multiple Linear Regression - Actuals, Interpolation, and Residuals', 4, TRUE)
a<-table.row.end(a)
a<-table.row.start(a)
a<-table.element(a, 'Time or Index', 1, TRUE)
a<-table.element(a, 'Actuals', 1, TRUE)
a<-table.element(a, 'Interpolation
Forecast', 1, TRUE)
a<-table.element(a, 'Residuals
Prediction Error', 1, TRUE)
a<-table.row.end(a)
for (i in 1:n) {
a<-table.row.start(a)
a<-table.element(a,i, 1, TRUE)
a<-table.element(a,formatC(signif(x[i],6),format='g',flag=' '))
a<-table.element(a,formatC(signif(x[i]-mysum$resid[i],6),format='g',flag=' '))
a<-table.element(a,formatC(signif(mysum$resid[i],6),format='g',flag=' '))
a<-table.row.end(a)
}
a<-table.end(a)
table.save(a,file='mytable4.tab')
if (n > n25) {
a<-table.start()
a<-table.row.start(a)
a<-table.element(a,'Goldfeld-Quandt test for Heteroskedasticity',4,TRUE)
a<-table.row.end(a)
a<-table.row.start(a)
a<-table.element(a,'p-values',header=TRUE)
a<-table.element(a,'Alternative Hypothesis',3,header=TRUE)
a<-table.row.end(a)
a<-table.row.start(a)
a<-table.element(a,'breakpoint index',header=TRUE)
a<-table.element(a,'greater',header=TRUE)
a<-table.element(a,'2-sided',header=TRUE)
a<-table.element(a,'less',header=TRUE)
a<-table.row.end(a)
for (mypoint in kp3:nmkm3) {
a<-table.row.start(a)
a<-table.element(a,mypoint,header=TRUE)
a<-table.element(a,formatC(signif(gqarr[mypoint-kp3+1,1],6),format='g',flag=' '))
a<-table.element(a,formatC(signif(gqarr[mypoint-kp3+1,2],6),format='g',flag=' '))
a<-table.element(a,formatC(signif(gqarr[mypoint-kp3+1,3],6),format='g',flag=' '))
a<-table.row.end(a)
}
a<-table.end(a)
table.save(a,file='mytable5.tab')
a<-table.start()
a<-table.row.start(a)
a<-table.element(a,'Meta Analysis of Goldfeld-Quandt test for Heteroskedasticity',4,TRUE)
a<-table.row.end(a)
a<-table.row.start(a)
a<-table.element(a,'Description',header=TRUE)
a<-table.element(a,'# significant tests',header=TRUE)
a<-table.element(a,'% significant tests',header=TRUE)
a<-table.element(a,'OK/NOK',header=TRUE)
a<-table.row.end(a)
a<-table.row.start(a)
a<-table.element(a,'1% type I error level',header=TRUE)
a<-table.element(a,signif(numsignificant1,6))
a<-table.element(a,formatC(signif(numsignificant1/numgqtests,6),format='g',flag=' '))
if (numsignificant1/numgqtests < 0.01) dum <- 'OK' else dum <- 'NOK'
a<-table.element(a,dum)
a<-table.row.end(a)
a<-table.row.start(a)
a<-table.element(a,'5% type I error level',header=TRUE)
a<-table.element(a,signif(numsignificant5,6))
a<-table.element(a,signif(numsignificant5/numgqtests,6))
if (numsignificant5/numgqtests < 0.05) dum <- 'OK' else dum <- 'NOK'
a<-table.element(a,dum)
a<-table.row.end(a)
a<-table.row.start(a)
a<-table.element(a,'10% type I error level',header=TRUE)
a<-table.element(a,signif(numsignificant10,6))
a<-table.element(a,signif(numsignificant10/numgqtests,6))
if (numsignificant10/numgqtests < 0.1) dum <- 'OK' else dum <- 'NOK'
a<-table.element(a,dum)
a<-table.row.end(a)
a<-table.end(a)
table.save(a,file='mytable6.tab')
}
}