Free Statistics

of Irreproducible Research!

Author's title

Author*Unverified author*
R Software Modulerwasp_autocorrelation.wasp
Title produced by software(Partial) Autocorrelation Function
Date of computationThu, 03 Dec 2015 14:41:36 +0000
Cite this page as followsStatistical Computations at FreeStatistics.org, Office for Research Development and Education, URL https://freestatistics.org/blog/index.php?v=date/2015/Dec/03/t1449153723ahzghy8f9dsr8ol.htm/, Retrieved Thu, 16 May 2024 23:29:44 +0000
Statistical Computations at FreeStatistics.org, Office for Research Development and Education, URL https://freestatistics.org/blog/index.php?pk=284980, Retrieved Thu, 16 May 2024 23:29:44 +0000
QR Codes:

Original text written by user:
IsPrivate?No (this computation is public)
User-defined keywords
Estimated Impact52
Family? (F = Feedback message, R = changed R code, M = changed R Module, P = changed Parameters, D = changed Data)
-       [(Partial) Autocorrelation Function] [autocorrelatie] [2015-12-03 14:41:36] [d41d8cd98f00b204e9800998ecf8427e] [Current]
Feedback Forum

Post a new message
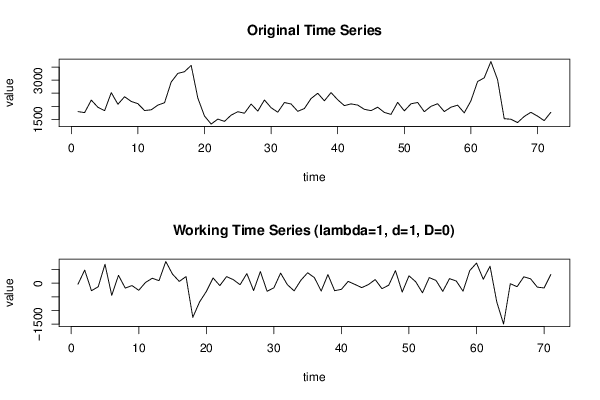
Dataseries X:
1795
1756
2237
1960
1829
2524
2077
2366
2185
2098
1836
1863
2044
2136
2931
3263
3328
3570
2313
1623
1316
1507
1419
1660
1790
1733
2086
1814
2241
1943
1773
2143
2087
1805
1913
2296
2500
2210
2526
2249
2024
2091
2045
1882
1831
1964
1763
1688
2149
1823
2094
2145
1791
1996
2097
1796
1963
2042
1746
2210
2949
3093
3718
3024
1522
1502
1373
1607
1768
1622
1447
1768


Summary of computational transaction
Raw Inputview raw input (R code)
Raw Outputview raw output of R engine
Computing time1 seconds
R Server'Herman Ole Andreas Wold' @ wold.wessa.net

\begin{tabular}{lllllllll}
\hline
Summary of computational transaction \tabularnewline
Raw Input & view raw input (R code)  \tabularnewline
Raw Output & view raw output of R engine  \tabularnewline
Computing time & 1 seconds \tabularnewline
R Server & 'Herman Ole Andreas Wold' @ wold.wessa.net \tabularnewline
\hline
\end{tabular}
%Source: https://freestatistics.org/blog/index.php?pk=284980&T=0

[TABLE]
[ROW][C]Summary of computational transaction[/C][/ROW]
[ROW][C]Raw Input[/C][C]view raw input (R code) [/C][/ROW]
[ROW][C]Raw Output[/C][C]view raw output of R engine [/C][/ROW]
[ROW][C]Computing time[/C][C]1 seconds[/C][/ROW]
[ROW][C]R Server[/C][C]'Herman Ole Andreas Wold' @ wold.wessa.net[/C][/ROW]
[/TABLE]
Source: https://freestatistics.org/blog/index.php?pk=284980&T=0

Globally Unique Identifier (entire table): ba.freestatistics.org/blog/index.php?pk=284980&T=0

As an alternative you can also use a QR Code:  

The GUIDs for individual cells are displayed in the table below:

Summary of computational transaction
Raw Inputview raw input (R code)
Raw Outputview raw output of R engine
Computing time1 seconds
R Server'Herman Ole Andreas Wold' @ wold.wessa.net


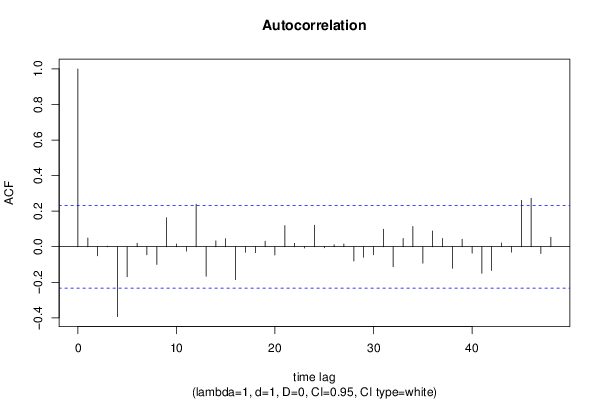
Autocorrelation Function
Time lag kACF(k)T-STATP-value
10.0493050.41550.339532
2-0.050974-0.42950.334426
30.0032070.0270.48926
4-0.393394-3.31480.000723
5-0.168846-1.42270.079598
60.0194650.1640.435094
7-0.045099-0.380.352535
8-0.099411-0.83770.202519
90.1629791.37330.086992
100.0153040.1290.448881
11-0.025033-0.21090.416771
120.2391992.01550.023818
13-0.165763-1.39670.083421
140.032870.2770.391305
150.0456210.38440.350912
16-0.185387-1.56210.061355
17-0.031079-0.26190.397086
18-0.033132-0.27920.390461
190.0304930.25690.398985
20-0.046792-0.39430.34728
210.1185850.99920.160543
220.0189890.160.436667
23-0.007663-0.06460.474349
240.1213541.02250.154997
25-0.005743-0.04840.480771
260.0112150.09450.462489
270.0157230.13250.447487
28-0.080716-0.68010.24932
29-0.059326-0.49990.309349
30-0.045025-0.37940.352767
310.0984850.82980.204703
32-0.112998-0.95210.172128
330.0466340.39290.347768
340.1137620.95860.170512
35-0.092322-0.77790.2196
360.0886110.74660.22887
370.0466460.3930.347731
38-0.120865-1.01840.155967
390.0416380.35080.363371
40-0.036239-0.30540.380496
41-0.1495-1.25970.105949
42-0.134262-1.13130.130865
430.0207560.17490.43083
44-0.030689-0.25860.398349
450.2606152.1960.015681
460.2728132.29880.012233
47-0.038013-0.32030.374839
480.0533630.44960.327167

\begin{tabular}{lllllllll}
\hline
Autocorrelation Function \tabularnewline
Time lag k & ACF(k) & T-STAT & P-value \tabularnewline
1 & 0.049305 & 0.4155 & 0.339532 \tabularnewline
2 & -0.050974 & -0.4295 & 0.334426 \tabularnewline
3 & 0.003207 & 0.027 & 0.48926 \tabularnewline
4 & -0.393394 & -3.3148 & 0.000723 \tabularnewline
5 & -0.168846 & -1.4227 & 0.079598 \tabularnewline
6 & 0.019465 & 0.164 & 0.435094 \tabularnewline
7 & -0.045099 & -0.38 & 0.352535 \tabularnewline
8 & -0.099411 & -0.8377 & 0.202519 \tabularnewline
9 & 0.162979 & 1.3733 & 0.086992 \tabularnewline
10 & 0.015304 & 0.129 & 0.448881 \tabularnewline
11 & -0.025033 & -0.2109 & 0.416771 \tabularnewline
12 & 0.239199 & 2.0155 & 0.023818 \tabularnewline
13 & -0.165763 & -1.3967 & 0.083421 \tabularnewline
14 & 0.03287 & 0.277 & 0.391305 \tabularnewline
15 & 0.045621 & 0.3844 & 0.350912 \tabularnewline
16 & -0.185387 & -1.5621 & 0.061355 \tabularnewline
17 & -0.031079 & -0.2619 & 0.397086 \tabularnewline
18 & -0.033132 & -0.2792 & 0.390461 \tabularnewline
19 & 0.030493 & 0.2569 & 0.398985 \tabularnewline
20 & -0.046792 & -0.3943 & 0.34728 \tabularnewline
21 & 0.118585 & 0.9992 & 0.160543 \tabularnewline
22 & 0.018989 & 0.16 & 0.436667 \tabularnewline
23 & -0.007663 & -0.0646 & 0.474349 \tabularnewline
24 & 0.121354 & 1.0225 & 0.154997 \tabularnewline
25 & -0.005743 & -0.0484 & 0.480771 \tabularnewline
26 & 0.011215 & 0.0945 & 0.462489 \tabularnewline
27 & 0.015723 & 0.1325 & 0.447487 \tabularnewline
28 & -0.080716 & -0.6801 & 0.24932 \tabularnewline
29 & -0.059326 & -0.4999 & 0.309349 \tabularnewline
30 & -0.045025 & -0.3794 & 0.352767 \tabularnewline
31 & 0.098485 & 0.8298 & 0.204703 \tabularnewline
32 & -0.112998 & -0.9521 & 0.172128 \tabularnewline
33 & 0.046634 & 0.3929 & 0.347768 \tabularnewline
34 & 0.113762 & 0.9586 & 0.170512 \tabularnewline
35 & -0.092322 & -0.7779 & 0.2196 \tabularnewline
36 & 0.088611 & 0.7466 & 0.22887 \tabularnewline
37 & 0.046646 & 0.393 & 0.347731 \tabularnewline
38 & -0.120865 & -1.0184 & 0.155967 \tabularnewline
39 & 0.041638 & 0.3508 & 0.363371 \tabularnewline
40 & -0.036239 & -0.3054 & 0.380496 \tabularnewline
41 & -0.1495 & -1.2597 & 0.105949 \tabularnewline
42 & -0.134262 & -1.1313 & 0.130865 \tabularnewline
43 & 0.020756 & 0.1749 & 0.43083 \tabularnewline
44 & -0.030689 & -0.2586 & 0.398349 \tabularnewline
45 & 0.260615 & 2.196 & 0.015681 \tabularnewline
46 & 0.272813 & 2.2988 & 0.012233 \tabularnewline
47 & -0.038013 & -0.3203 & 0.374839 \tabularnewline
48 & 0.053363 & 0.4496 & 0.327167 \tabularnewline
\hline
\end{tabular}
%Source: https://freestatistics.org/blog/index.php?pk=284980&T=1

[TABLE]
[ROW][C]Autocorrelation Function[/C][/ROW]
[ROW][C]Time lag k[/C][C]ACF(k)[/C][C]T-STAT[/C][C]P-value[/C][/ROW]
[ROW][C]1[/C][C]0.049305[/C][C]0.4155[/C][C]0.339532[/C][/ROW]
[ROW][C]2[/C][C]-0.050974[/C][C]-0.4295[/C][C]0.334426[/C][/ROW]
[ROW][C]3[/C][C]0.003207[/C][C]0.027[/C][C]0.48926[/C][/ROW]
[ROW][C]4[/C][C]-0.393394[/C][C]-3.3148[/C][C]0.000723[/C][/ROW]
[ROW][C]5[/C][C]-0.168846[/C][C]-1.4227[/C][C]0.079598[/C][/ROW]
[ROW][C]6[/C][C]0.019465[/C][C]0.164[/C][C]0.435094[/C][/ROW]
[ROW][C]7[/C][C]-0.045099[/C][C]-0.38[/C][C]0.352535[/C][/ROW]
[ROW][C]8[/C][C]-0.099411[/C][C]-0.8377[/C][C]0.202519[/C][/ROW]
[ROW][C]9[/C][C]0.162979[/C][C]1.3733[/C][C]0.086992[/C][/ROW]
[ROW][C]10[/C][C]0.015304[/C][C]0.129[/C][C]0.448881[/C][/ROW]
[ROW][C]11[/C][C]-0.025033[/C][C]-0.2109[/C][C]0.416771[/C][/ROW]
[ROW][C]12[/C][C]0.239199[/C][C]2.0155[/C][C]0.023818[/C][/ROW]
[ROW][C]13[/C][C]-0.165763[/C][C]-1.3967[/C][C]0.083421[/C][/ROW]
[ROW][C]14[/C][C]0.03287[/C][C]0.277[/C][C]0.391305[/C][/ROW]
[ROW][C]15[/C][C]0.045621[/C][C]0.3844[/C][C]0.350912[/C][/ROW]
[ROW][C]16[/C][C]-0.185387[/C][C]-1.5621[/C][C]0.061355[/C][/ROW]
[ROW][C]17[/C][C]-0.031079[/C][C]-0.2619[/C][C]0.397086[/C][/ROW]
[ROW][C]18[/C][C]-0.033132[/C][C]-0.2792[/C][C]0.390461[/C][/ROW]
[ROW][C]19[/C][C]0.030493[/C][C]0.2569[/C][C]0.398985[/C][/ROW]
[ROW][C]20[/C][C]-0.046792[/C][C]-0.3943[/C][C]0.34728[/C][/ROW]
[ROW][C]21[/C][C]0.118585[/C][C]0.9992[/C][C]0.160543[/C][/ROW]
[ROW][C]22[/C][C]0.018989[/C][C]0.16[/C][C]0.436667[/C][/ROW]
[ROW][C]23[/C][C]-0.007663[/C][C]-0.0646[/C][C]0.474349[/C][/ROW]
[ROW][C]24[/C][C]0.121354[/C][C]1.0225[/C][C]0.154997[/C][/ROW]
[ROW][C]25[/C][C]-0.005743[/C][C]-0.0484[/C][C]0.480771[/C][/ROW]
[ROW][C]26[/C][C]0.011215[/C][C]0.0945[/C][C]0.462489[/C][/ROW]
[ROW][C]27[/C][C]0.015723[/C][C]0.1325[/C][C]0.447487[/C][/ROW]
[ROW][C]28[/C][C]-0.080716[/C][C]-0.6801[/C][C]0.24932[/C][/ROW]
[ROW][C]29[/C][C]-0.059326[/C][C]-0.4999[/C][C]0.309349[/C][/ROW]
[ROW][C]30[/C][C]-0.045025[/C][C]-0.3794[/C][C]0.352767[/C][/ROW]
[ROW][C]31[/C][C]0.098485[/C][C]0.8298[/C][C]0.204703[/C][/ROW]
[ROW][C]32[/C][C]-0.112998[/C][C]-0.9521[/C][C]0.172128[/C][/ROW]
[ROW][C]33[/C][C]0.046634[/C][C]0.3929[/C][C]0.347768[/C][/ROW]
[ROW][C]34[/C][C]0.113762[/C][C]0.9586[/C][C]0.170512[/C][/ROW]
[ROW][C]35[/C][C]-0.092322[/C][C]-0.7779[/C][C]0.2196[/C][/ROW]
[ROW][C]36[/C][C]0.088611[/C][C]0.7466[/C][C]0.22887[/C][/ROW]
[ROW][C]37[/C][C]0.046646[/C][C]0.393[/C][C]0.347731[/C][/ROW]
[ROW][C]38[/C][C]-0.120865[/C][C]-1.0184[/C][C]0.155967[/C][/ROW]
[ROW][C]39[/C][C]0.041638[/C][C]0.3508[/C][C]0.363371[/C][/ROW]
[ROW][C]40[/C][C]-0.036239[/C][C]-0.3054[/C][C]0.380496[/C][/ROW]
[ROW][C]41[/C][C]-0.1495[/C][C]-1.2597[/C][C]0.105949[/C][/ROW]
[ROW][C]42[/C][C]-0.134262[/C][C]-1.1313[/C][C]0.130865[/C][/ROW]
[ROW][C]43[/C][C]0.020756[/C][C]0.1749[/C][C]0.43083[/C][/ROW]
[ROW][C]44[/C][C]-0.030689[/C][C]-0.2586[/C][C]0.398349[/C][/ROW]
[ROW][C]45[/C][C]0.260615[/C][C]2.196[/C][C]0.015681[/C][/ROW]
[ROW][C]46[/C][C]0.272813[/C][C]2.2988[/C][C]0.012233[/C][/ROW]
[ROW][C]47[/C][C]-0.038013[/C][C]-0.3203[/C][C]0.374839[/C][/ROW]
[ROW][C]48[/C][C]0.053363[/C][C]0.4496[/C][C]0.327167[/C][/ROW]
[/TABLE]
Source: https://freestatistics.org/blog/index.php?pk=284980&T=1

Globally Unique Identifier (entire table): ba.freestatistics.org/blog/index.php?pk=284980&T=1

As an alternative you can also use a QR Code:  

The GUIDs for individual cells are displayed in the table below:

Autocorrelation Function
Time lag kACF(k)T-STATP-value
10.0493050.41550.339532
2-0.050974-0.42950.334426
30.0032070.0270.48926
4-0.393394-3.31480.000723
5-0.168846-1.42270.079598
60.0194650.1640.435094
7-0.045099-0.380.352535
8-0.099411-0.83770.202519
90.1629791.37330.086992
100.0153040.1290.448881
11-0.025033-0.21090.416771
120.2391992.01550.023818
13-0.165763-1.39670.083421
140.032870.2770.391305
150.0456210.38440.350912
16-0.185387-1.56210.061355
17-0.031079-0.26190.397086
18-0.033132-0.27920.390461
190.0304930.25690.398985
20-0.046792-0.39430.34728
210.1185850.99920.160543
220.0189890.160.436667
23-0.007663-0.06460.474349
240.1213541.02250.154997
25-0.005743-0.04840.480771
260.0112150.09450.462489
270.0157230.13250.447487
28-0.080716-0.68010.24932
29-0.059326-0.49990.309349
30-0.045025-0.37940.352767
310.0984850.82980.204703
32-0.112998-0.95210.172128
330.0466340.39290.347768
340.1137620.95860.170512
35-0.092322-0.77790.2196
360.0886110.74660.22887
370.0466460.3930.347731
38-0.120865-1.01840.155967
390.0416380.35080.363371
40-0.036239-0.30540.380496
41-0.1495-1.25970.105949
42-0.134262-1.13130.130865
430.0207560.17490.43083
44-0.030689-0.25860.398349
450.2606152.1960.015681
460.2728132.29880.012233
47-0.038013-0.32030.374839
480.0533630.44960.327167


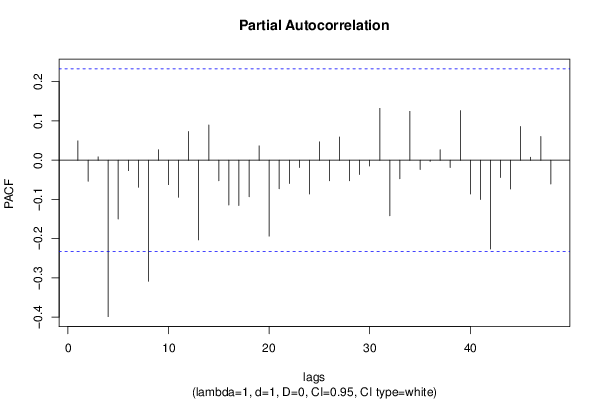
Partial Autocorrelation Function
Time lag kPACF(k)T-STATP-value
10.0493050.41550.339532
2-0.053535-0.45110.326649
30.0085390.0720.471421
4-0.398874-3.3610.000627
5-0.150028-1.26420.105154
6-0.026603-0.22420.411638
7-0.069118-0.58240.281071
8-0.308509-2.59950.005673
90.0264350.22270.412186
10-0.062286-0.52480.300667
11-0.09465-0.79750.213901
120.0732590.61730.269509
13-0.203123-1.71150.045673
140.0898440.7570.225765
15-0.052591-0.44310.329506
16-0.114161-0.96190.169674
17-0.115423-0.97260.167035
18-0.093258-0.78580.217298
190.0364740.30730.379744
20-0.193703-1.63220.053535
21-0.072845-0.61380.270654
22-0.059404-0.50050.309119
23-0.018637-0.1570.437831
24-0.086419-0.72820.23445
250.0467030.39350.347554
26-0.052246-0.44020.330553
270.0589410.49660.310487
28-0.05238-0.44140.330146
29-0.036681-0.30910.379082
30-0.014992-0.12630.449915
310.1322071.1140.13452
32-0.141777-1.19460.118104
33-0.047521-0.40040.345026
340.12441.04820.149048
35-0.023567-0.19860.421579
36-0.00308-0.0260.489685
370.02660.22410.411647
38-0.018797-0.15840.437302
390.1263451.06460.145332
40-0.086428-0.72830.234425
41-0.100278-0.8450.200486
42-0.226357-1.90730.030262
43-0.044063-0.37130.355768
44-0.073599-0.62020.268569
450.0857350.72240.236207
460.0073730.06210.47532
470.0602680.50780.306575
48-0.060951-0.51360.304568

\begin{tabular}{lllllllll}
\hline
Partial Autocorrelation Function \tabularnewline
Time lag k & PACF(k) & T-STAT & P-value \tabularnewline
1 & 0.049305 & 0.4155 & 0.339532 \tabularnewline
2 & -0.053535 & -0.4511 & 0.326649 \tabularnewline
3 & 0.008539 & 0.072 & 0.471421 \tabularnewline
4 & -0.398874 & -3.361 & 0.000627 \tabularnewline
5 & -0.150028 & -1.2642 & 0.105154 \tabularnewline
6 & -0.026603 & -0.2242 & 0.411638 \tabularnewline
7 & -0.069118 & -0.5824 & 0.281071 \tabularnewline
8 & -0.308509 & -2.5995 & 0.005673 \tabularnewline
9 & 0.026435 & 0.2227 & 0.412186 \tabularnewline
10 & -0.062286 & -0.5248 & 0.300667 \tabularnewline
11 & -0.09465 & -0.7975 & 0.213901 \tabularnewline
12 & 0.073259 & 0.6173 & 0.269509 \tabularnewline
13 & -0.203123 & -1.7115 & 0.045673 \tabularnewline
14 & 0.089844 & 0.757 & 0.225765 \tabularnewline
15 & -0.052591 & -0.4431 & 0.329506 \tabularnewline
16 & -0.114161 & -0.9619 & 0.169674 \tabularnewline
17 & -0.115423 & -0.9726 & 0.167035 \tabularnewline
18 & -0.093258 & -0.7858 & 0.217298 \tabularnewline
19 & 0.036474 & 0.3073 & 0.379744 \tabularnewline
20 & -0.193703 & -1.6322 & 0.053535 \tabularnewline
21 & -0.072845 & -0.6138 & 0.270654 \tabularnewline
22 & -0.059404 & -0.5005 & 0.309119 \tabularnewline
23 & -0.018637 & -0.157 & 0.437831 \tabularnewline
24 & -0.086419 & -0.7282 & 0.23445 \tabularnewline
25 & 0.046703 & 0.3935 & 0.347554 \tabularnewline
26 & -0.052246 & -0.4402 & 0.330553 \tabularnewline
27 & 0.058941 & 0.4966 & 0.310487 \tabularnewline
28 & -0.05238 & -0.4414 & 0.330146 \tabularnewline
29 & -0.036681 & -0.3091 & 0.379082 \tabularnewline
30 & -0.014992 & -0.1263 & 0.449915 \tabularnewline
31 & 0.132207 & 1.114 & 0.13452 \tabularnewline
32 & -0.141777 & -1.1946 & 0.118104 \tabularnewline
33 & -0.047521 & -0.4004 & 0.345026 \tabularnewline
34 & 0.1244 & 1.0482 & 0.149048 \tabularnewline
35 & -0.023567 & -0.1986 & 0.421579 \tabularnewline
36 & -0.00308 & -0.026 & 0.489685 \tabularnewline
37 & 0.0266 & 0.2241 & 0.411647 \tabularnewline
38 & -0.018797 & -0.1584 & 0.437302 \tabularnewline
39 & 0.126345 & 1.0646 & 0.145332 \tabularnewline
40 & -0.086428 & -0.7283 & 0.234425 \tabularnewline
41 & -0.100278 & -0.845 & 0.200486 \tabularnewline
42 & -0.226357 & -1.9073 & 0.030262 \tabularnewline
43 & -0.044063 & -0.3713 & 0.355768 \tabularnewline
44 & -0.073599 & -0.6202 & 0.268569 \tabularnewline
45 & 0.085735 & 0.7224 & 0.236207 \tabularnewline
46 & 0.007373 & 0.0621 & 0.47532 \tabularnewline
47 & 0.060268 & 0.5078 & 0.306575 \tabularnewline
48 & -0.060951 & -0.5136 & 0.304568 \tabularnewline
\hline
\end{tabular}
%Source: https://freestatistics.org/blog/index.php?pk=284980&T=2

[TABLE]
[ROW][C]Partial Autocorrelation Function[/C][/ROW]
[ROW][C]Time lag k[/C][C]PACF(k)[/C][C]T-STAT[/C][C]P-value[/C][/ROW]
[ROW][C]1[/C][C]0.049305[/C][C]0.4155[/C][C]0.339532[/C][/ROW]
[ROW][C]2[/C][C]-0.053535[/C][C]-0.4511[/C][C]0.326649[/C][/ROW]
[ROW][C]3[/C][C]0.008539[/C][C]0.072[/C][C]0.471421[/C][/ROW]
[ROW][C]4[/C][C]-0.398874[/C][C]-3.361[/C][C]0.000627[/C][/ROW]
[ROW][C]5[/C][C]-0.150028[/C][C]-1.2642[/C][C]0.105154[/C][/ROW]
[ROW][C]6[/C][C]-0.026603[/C][C]-0.2242[/C][C]0.411638[/C][/ROW]
[ROW][C]7[/C][C]-0.069118[/C][C]-0.5824[/C][C]0.281071[/C][/ROW]
[ROW][C]8[/C][C]-0.308509[/C][C]-2.5995[/C][C]0.005673[/C][/ROW]
[ROW][C]9[/C][C]0.026435[/C][C]0.2227[/C][C]0.412186[/C][/ROW]
[ROW][C]10[/C][C]-0.062286[/C][C]-0.5248[/C][C]0.300667[/C][/ROW]
[ROW][C]11[/C][C]-0.09465[/C][C]-0.7975[/C][C]0.213901[/C][/ROW]
[ROW][C]12[/C][C]0.073259[/C][C]0.6173[/C][C]0.269509[/C][/ROW]
[ROW][C]13[/C][C]-0.203123[/C][C]-1.7115[/C][C]0.045673[/C][/ROW]
[ROW][C]14[/C][C]0.089844[/C][C]0.757[/C][C]0.225765[/C][/ROW]
[ROW][C]15[/C][C]-0.052591[/C][C]-0.4431[/C][C]0.329506[/C][/ROW]
[ROW][C]16[/C][C]-0.114161[/C][C]-0.9619[/C][C]0.169674[/C][/ROW]
[ROW][C]17[/C][C]-0.115423[/C][C]-0.9726[/C][C]0.167035[/C][/ROW]
[ROW][C]18[/C][C]-0.093258[/C][C]-0.7858[/C][C]0.217298[/C][/ROW]
[ROW][C]19[/C][C]0.036474[/C][C]0.3073[/C][C]0.379744[/C][/ROW]
[ROW][C]20[/C][C]-0.193703[/C][C]-1.6322[/C][C]0.053535[/C][/ROW]
[ROW][C]21[/C][C]-0.072845[/C][C]-0.6138[/C][C]0.270654[/C][/ROW]
[ROW][C]22[/C][C]-0.059404[/C][C]-0.5005[/C][C]0.309119[/C][/ROW]
[ROW][C]23[/C][C]-0.018637[/C][C]-0.157[/C][C]0.437831[/C][/ROW]
[ROW][C]24[/C][C]-0.086419[/C][C]-0.7282[/C][C]0.23445[/C][/ROW]
[ROW][C]25[/C][C]0.046703[/C][C]0.3935[/C][C]0.347554[/C][/ROW]
[ROW][C]26[/C][C]-0.052246[/C][C]-0.4402[/C][C]0.330553[/C][/ROW]
[ROW][C]27[/C][C]0.058941[/C][C]0.4966[/C][C]0.310487[/C][/ROW]
[ROW][C]28[/C][C]-0.05238[/C][C]-0.4414[/C][C]0.330146[/C][/ROW]
[ROW][C]29[/C][C]-0.036681[/C][C]-0.3091[/C][C]0.379082[/C][/ROW]
[ROW][C]30[/C][C]-0.014992[/C][C]-0.1263[/C][C]0.449915[/C][/ROW]
[ROW][C]31[/C][C]0.132207[/C][C]1.114[/C][C]0.13452[/C][/ROW]
[ROW][C]32[/C][C]-0.141777[/C][C]-1.1946[/C][C]0.118104[/C][/ROW]
[ROW][C]33[/C][C]-0.047521[/C][C]-0.4004[/C][C]0.345026[/C][/ROW]
[ROW][C]34[/C][C]0.1244[/C][C]1.0482[/C][C]0.149048[/C][/ROW]
[ROW][C]35[/C][C]-0.023567[/C][C]-0.1986[/C][C]0.421579[/C][/ROW]
[ROW][C]36[/C][C]-0.00308[/C][C]-0.026[/C][C]0.489685[/C][/ROW]
[ROW][C]37[/C][C]0.0266[/C][C]0.2241[/C][C]0.411647[/C][/ROW]
[ROW][C]38[/C][C]-0.018797[/C][C]-0.1584[/C][C]0.437302[/C][/ROW]
[ROW][C]39[/C][C]0.126345[/C][C]1.0646[/C][C]0.145332[/C][/ROW]
[ROW][C]40[/C][C]-0.086428[/C][C]-0.7283[/C][C]0.234425[/C][/ROW]
[ROW][C]41[/C][C]-0.100278[/C][C]-0.845[/C][C]0.200486[/C][/ROW]
[ROW][C]42[/C][C]-0.226357[/C][C]-1.9073[/C][C]0.030262[/C][/ROW]
[ROW][C]43[/C][C]-0.044063[/C][C]-0.3713[/C][C]0.355768[/C][/ROW]
[ROW][C]44[/C][C]-0.073599[/C][C]-0.6202[/C][C]0.268569[/C][/ROW]
[ROW][C]45[/C][C]0.085735[/C][C]0.7224[/C][C]0.236207[/C][/ROW]
[ROW][C]46[/C][C]0.007373[/C][C]0.0621[/C][C]0.47532[/C][/ROW]
[ROW][C]47[/C][C]0.060268[/C][C]0.5078[/C][C]0.306575[/C][/ROW]
[ROW][C]48[/C][C]-0.060951[/C][C]-0.5136[/C][C]0.304568[/C][/ROW]
[/TABLE]
Source: https://freestatistics.org/blog/index.php?pk=284980&T=2

Globally Unique Identifier (entire table): ba.freestatistics.org/blog/index.php?pk=284980&T=2

As an alternative you can also use a QR Code:  

The GUIDs for individual cells are displayed in the table below:

Partial Autocorrelation Function
Time lag kPACF(k)T-STATP-value
10.0493050.41550.339532
2-0.053535-0.45110.326649
30.0085390.0720.471421
4-0.398874-3.3610.000627
5-0.150028-1.26420.105154
6-0.026603-0.22420.411638
7-0.069118-0.58240.281071
8-0.308509-2.59950.005673
90.0264350.22270.412186
10-0.062286-0.52480.300667
11-0.09465-0.79750.213901
120.0732590.61730.269509
13-0.203123-1.71150.045673
140.0898440.7570.225765
15-0.052591-0.44310.329506
16-0.114161-0.96190.169674
17-0.115423-0.97260.167035
18-0.093258-0.78580.217298
190.0364740.30730.379744
20-0.193703-1.63220.053535
21-0.072845-0.61380.270654
22-0.059404-0.50050.309119
23-0.018637-0.1570.437831
24-0.086419-0.72820.23445
250.0467030.39350.347554
26-0.052246-0.44020.330553
270.0589410.49660.310487
28-0.05238-0.44140.330146
29-0.036681-0.30910.379082
30-0.014992-0.12630.449915
310.1322071.1140.13452
32-0.141777-1.19460.118104
33-0.047521-0.40040.345026
340.12441.04820.149048
35-0.023567-0.19860.421579
36-0.00308-0.0260.489685
370.02660.22410.411647
38-0.018797-0.15840.437302
390.1263451.06460.145332
40-0.086428-0.72830.234425
41-0.100278-0.8450.200486
42-0.226357-1.90730.030262
43-0.044063-0.37130.355768
44-0.073599-0.62020.268569
450.0857350.72240.236207
460.0073730.06210.47532
470.0602680.50780.306575
48-0.060951-0.51360.304568


Parameters (Session):
par1 = 48 ; par2 = 1 ; par3 = 1 ; par4 = 0 ; par5 = 12 ; par6 = White Noise ; par7 = 0.95 ;
Parameters (R input):
par1 = 48 ; par2 = 1 ; par3 = 1 ; par4 = 0 ; par5 = 12 ; par6 = White Noise ; par7 = 0.95 ; par8 = ;
R code (references can be found in the software module):
if (par1 == 'Default') {
par1 = 10*log10(length(x))
} else {
par1 <- as.numeric(par1)
}
par2 <- as.numeric(par2)
par3 <- as.numeric(par3)
par4 <- as.numeric(par4)
par5 <- as.numeric(par5)
if (par6 == 'White Noise') par6 <- 'white' else par6 <- 'ma'
par7 <- as.numeric(par7)
if (par8 != '') par8 <- as.numeric(par8)
x <- na.omit(x)
ox <- x
if (par8 == '') {
if (par2 == 0) {
x <- log(x)
} else {
x <- (x ^ par2 - 1) / par2
}
} else {
x <- log(x,base=par8)
}
if (par3 > 0) x <- diff(x,lag=1,difference=par3)
if (par4 > 0) x <- diff(x,lag=par5,difference=par4)
bitmap(file='picts.png')
op <- par(mfrow=c(2,1))
plot(ox,type='l',main='Original Time Series',xlab='time',ylab='value')
if (par8=='') {
mytitle <- paste('Working Time Series (lambda=',par2,', d=',par3,', D=',par4,')',sep='')
mysub <- paste('(lambda=',par2,', d=',par3,', D=',par4,', CI=', par7, ', CI type=',par6,')',sep='')
} else {
mytitle <- paste('Working Time Series (base=',par8,', d=',par3,', D=',par4,')',sep='')
mysub <- paste('(base=',par8,', d=',par3,', D=',par4,', CI=', par7, ', CI type=',par6,')',sep='')
}
plot(x,type='l', main=mytitle,xlab='time',ylab='value')
par(op)
dev.off()
bitmap(file='pic1.png')
racf <- acf(x, par1, main='Autocorrelation', xlab='time lag', ylab='ACF', ci.type=par6, ci=par7, sub=mysub)
dev.off()
bitmap(file='pic2.png')
rpacf <- pacf(x,par1,main='Partial Autocorrelation',xlab='lags',ylab='PACF',sub=mysub)
dev.off()
(myacf <- c(racf$acf))
(mypacf <- c(rpacf$acf))
lengthx <- length(x)
sqrtn <- sqrt(lengthx)
load(file='createtable')
a<-table.start()
a<-table.row.start(a)
a<-table.element(a,'Autocorrelation Function',4,TRUE)
a<-table.row.end(a)
a<-table.row.start(a)
a<-table.element(a,'Time lag k',header=TRUE)
a<-table.element(a,hyperlink('basics.htm','ACF(k)','click here for more information about the Autocorrelation Function'),header=TRUE)
a<-table.element(a,'T-STAT',header=TRUE)
a<-table.element(a,'P-value',header=TRUE)
a<-table.row.end(a)
for (i in 2:(par1+1)) {
a<-table.row.start(a)
a<-table.element(a,i-1,header=TRUE)
a<-table.element(a,round(myacf[i],6))
mytstat <- myacf[i]*sqrtn
a<-table.element(a,round(mytstat,4))
a<-table.element(a,round(1-pt(abs(mytstat),lengthx),6))
a<-table.row.end(a)
}
a<-table.end(a)
table.save(a,file='mytable.tab')
a<-table.start()
a<-table.row.start(a)
a<-table.element(a,'Partial Autocorrelation Function',4,TRUE)
a<-table.row.end(a)
a<-table.row.start(a)
a<-table.element(a,'Time lag k',header=TRUE)
a<-table.element(a,hyperlink('basics.htm','PACF(k)','click here for more information about the Partial Autocorrelation Function'),header=TRUE)
a<-table.element(a,'T-STAT',header=TRUE)
a<-table.element(a,'P-value',header=TRUE)
a<-table.row.end(a)
for (i in 1:par1) {
a<-table.row.start(a)
a<-table.element(a,i,header=TRUE)
a<-table.element(a,round(mypacf[i],6))
mytstat <- mypacf[i]*sqrtn
a<-table.element(a,round(mytstat,4))
a<-table.element(a,round(1-pt(abs(mytstat),lengthx),6))
a<-table.row.end(a)
}
a<-table.end(a)
table.save(a,file='mytable1.tab')