Free Statistics

of Irreproducible Research!

Author's title

Author*Unverified author*
R Software Modulerwasp_arimaforecasting.wasp
Title produced by softwareARIMA Forecasting
Date of computationThu, 03 Dec 2015 18:26:34 +0000
Cite this page as followsStatistical Computations at FreeStatistics.org, Office for Research Development and Education, URL https://freestatistics.org/blog/index.php?v=date/2015/Dec/03/t1449167256mxo8mq5g94ukul9.htm/, Retrieved Thu, 16 May 2024 23:07:32 +0000
Statistical Computations at FreeStatistics.org, Office for Research Development and Education, URL https://freestatistics.org/blog/index.php?pk=285012, Retrieved Thu, 16 May 2024 23:07:32 +0000
QR Codes:

Original text written by user:
IsPrivate?No (this computation is public)
User-defined keywordsproyección llegadas turistas residentes en el extranjero
Estimated Impact43
Family? (F = Feedback message, R = changed R code, M = changed R Module, P = changed Parameters, D = changed Data)
-       [ARIMA Forecasting] [proyeccion] [2015-12-03 18:26:34] [d41d8cd98f00b204e9800998ecf8427e] [Current]
Feedback Forum

Post a new message
Dataseries X:
704177
310154
310302
435329
497822
265224
301331
426815
510865
300614
358423
502547
596516
342535
377994
507900
677901
351931
442446
597344
754476
426933
450376
642635
827784
469829
526038
710645
939567
462391
562784
745282
973380
513575
507811
764929
921722
493969
580275
804671
1031509
593149
638170
874457
1177875
689356
752624
934424
1191042
660037
751254
973871
1179078
675609
766401
1053303


Summary of computational transaction
Raw Inputview raw input (R code)
Raw Outputview raw output of R engine
Computing time3 seconds
R Server'Sir Maurice George Kendall' @ kendall.wessa.net

\begin{tabular}{lllllllll}
\hline
Summary of computational transaction \tabularnewline
Raw Input & view raw input (R code)  \tabularnewline
Raw Output & view raw output of R engine  \tabularnewline
Computing time & 3 seconds \tabularnewline
R Server & 'Sir Maurice George Kendall' @ kendall.wessa.net \tabularnewline
\hline
\end{tabular}
%Source: https://freestatistics.org/blog/index.php?pk=285012&T=0

[TABLE]
[ROW][C]Summary of computational transaction[/C][/ROW]
[ROW][C]Raw Input[/C][C]view raw input (R code) [/C][/ROW]
[ROW][C]Raw Output[/C][C]view raw output of R engine [/C][/ROW]
[ROW][C]Computing time[/C][C]3 seconds[/C][/ROW]
[ROW][C]R Server[/C][C]'Sir Maurice George Kendall' @ kendall.wessa.net[/C][/ROW]
[/TABLE]
Source: https://freestatistics.org/blog/index.php?pk=285012&T=0

Globally Unique Identifier (entire table): ba.freestatistics.org/blog/index.php?pk=285012&T=0

As an alternative you can also use a QR Code:  

The GUIDs for individual cells are displayed in the table below:

Summary of computational transaction
Raw Inputview raw input (R code)
Raw Outputview raw output of R engine
Computing time3 seconds
R Server'Sir Maurice George Kendall' @ kendall.wessa.net


Univariate ARIMA Extrapolation Forecast
timeY[t]F[t]95% LB95% UBp-value(H0: Y[t] = F[t])P(F[t]>Y[t-1])P(F[t]>Y[t-s])P(F[t]>Y[32])
28710645-------
29939567-------
30462391-------
31562784-------
32745282-------
33973380981794.5116884047.5631079541.46020.43310.80141
34513575484798.6952366371.0338603226.35670.316900.64460
35507811592541.8609451389.9459733693.77590.11970.86360.66030.017
36764929774676.3015615486.5021933866.10080.45220.99950.64130.6413
379217221012467.5039765720.97091259214.0370.23550.97540.62190.9831
38493969512139.0557222222.3184802055.79290.45110.00280.49610.0575
39580275621118.083288079.6061954156.55980.4050.77290.74760.2325
40804671803191.318433653.20771172729.42840.49690.88150.58040.6206
4110315091041197.5007578793.31971503601.68170.48360.8420.69370.8951
42593149540308.819318998.08561061619.55310.42130.03240.56920.2205
43638170649495.601170163.77531228827.42680.48470.57560.59260.3729
44874457831558.5464201041.8941462075.19880.4470.72610.53330.6057
4511778751069600.868339975.12411799226.61190.38560.69990.54080.8082
46689356568618.01-232069.40991369305.42990.38380.06790.47610.3327
47752624677839.7158-192751.05981548430.49140.43310.48970.53560.4397
48934424859900.9314-73974.62771793776.49050.43790.58910.48780.5951
4911910421097949.328158551.85782137346.79840.43030.62110.44010.747
50660037596950.6387-523685.87281717587.15020.45610.14940.43580.3977
51751254706178.2153-494462.86641906819.29710.47070.530.46980.4746
52973871888239.1401-386094.53322162572.81350.44760.58340.47170.587
5311790781126288.5581-259879.92942512457.04560.47020.58530.46350.705
54675609625287.2074-851052.83872101627.25350.47340.23110.48160.4367
55766401734515.771-830757.05792299788.59980.48410.52940.49160.4946
561053303916576.6469-731622.69722564775.9910.43540.57090.47280.5807

\begin{tabular}{lllllllll}
\hline
Univariate ARIMA Extrapolation Forecast \tabularnewline
time & Y[t] & F[t] & 95% LB & 95% UB & p-value(H0: Y[t] = F[t]) & P(F[t]>Y[t-1]) & P(F[t]>Y[t-s]) & P(F[t]>Y[32]) \tabularnewline
28 & 710645 & - & - & - & - & - & - & - \tabularnewline
29 & 939567 & - & - & - & - & - & - & - \tabularnewline
30 & 462391 & - & - & - & - & - & - & - \tabularnewline
31 & 562784 & - & - & - & - & - & - & - \tabularnewline
32 & 745282 & - & - & - & - & - & - & - \tabularnewline
33 & 973380 & 981794.5116 & 884047.563 & 1079541.4602 & 0.433 & 1 & 0.8014 & 1 \tabularnewline
34 & 513575 & 484798.6952 & 366371.0338 & 603226.3567 & 0.3169 & 0 & 0.6446 & 0 \tabularnewline
35 & 507811 & 592541.8609 & 451389.9459 & 733693.7759 & 0.1197 & 0.8636 & 0.6603 & 0.017 \tabularnewline
36 & 764929 & 774676.3015 & 615486.5021 & 933866.1008 & 0.4522 & 0.9995 & 0.6413 & 0.6413 \tabularnewline
37 & 921722 & 1012467.5039 & 765720.9709 & 1259214.037 & 0.2355 & 0.9754 & 0.6219 & 0.9831 \tabularnewline
38 & 493969 & 512139.0557 & 222222.3184 & 802055.7929 & 0.4511 & 0.0028 & 0.4961 & 0.0575 \tabularnewline
39 & 580275 & 621118.083 & 288079.6061 & 954156.5598 & 0.405 & 0.7729 & 0.7476 & 0.2325 \tabularnewline
40 & 804671 & 803191.318 & 433653.2077 & 1172729.4284 & 0.4969 & 0.8815 & 0.5804 & 0.6206 \tabularnewline
41 & 1031509 & 1041197.5007 & 578793.3197 & 1503601.6817 & 0.4836 & 0.842 & 0.6937 & 0.8951 \tabularnewline
42 & 593149 & 540308.8193 & 18998.0856 & 1061619.5531 & 0.4213 & 0.0324 & 0.5692 & 0.2205 \tabularnewline
43 & 638170 & 649495.6011 & 70163.7753 & 1228827.4268 & 0.4847 & 0.5756 & 0.5926 & 0.3729 \tabularnewline
44 & 874457 & 831558.5464 & 201041.894 & 1462075.1988 & 0.447 & 0.7261 & 0.5333 & 0.6057 \tabularnewline
45 & 1177875 & 1069600.868 & 339975.1241 & 1799226.6119 & 0.3856 & 0.6999 & 0.5408 & 0.8082 \tabularnewline
46 & 689356 & 568618.01 & -232069.4099 & 1369305.4299 & 0.3838 & 0.0679 & 0.4761 & 0.3327 \tabularnewline
47 & 752624 & 677839.7158 & -192751.0598 & 1548430.4914 & 0.4331 & 0.4897 & 0.5356 & 0.4397 \tabularnewline
48 & 934424 & 859900.9314 & -73974.6277 & 1793776.4905 & 0.4379 & 0.5891 & 0.4878 & 0.5951 \tabularnewline
49 & 1191042 & 1097949.3281 & 58551.8578 & 2137346.7984 & 0.4303 & 0.6211 & 0.4401 & 0.747 \tabularnewline
50 & 660037 & 596950.6387 & -523685.8728 & 1717587.1502 & 0.4561 & 0.1494 & 0.4358 & 0.3977 \tabularnewline
51 & 751254 & 706178.2153 & -494462.8664 & 1906819.2971 & 0.4707 & 0.53 & 0.4698 & 0.4746 \tabularnewline
52 & 973871 & 888239.1401 & -386094.5332 & 2162572.8135 & 0.4476 & 0.5834 & 0.4717 & 0.587 \tabularnewline
53 & 1179078 & 1126288.5581 & -259879.9294 & 2512457.0456 & 0.4702 & 0.5853 & 0.4635 & 0.705 \tabularnewline
54 & 675609 & 625287.2074 & -851052.8387 & 2101627.2535 & 0.4734 & 0.2311 & 0.4816 & 0.4367 \tabularnewline
55 & 766401 & 734515.771 & -830757.0579 & 2299788.5998 & 0.4841 & 0.5294 & 0.4916 & 0.4946 \tabularnewline
56 & 1053303 & 916576.6469 & -731622.6972 & 2564775.991 & 0.4354 & 0.5709 & 0.4728 & 0.5807 \tabularnewline
\hline
\end{tabular}
%Source: https://freestatistics.org/blog/index.php?pk=285012&T=1

[TABLE]
[ROW][C]Univariate ARIMA Extrapolation Forecast[/C][/ROW]
[ROW][C]time[/C][C]Y[t][/C][C]F[t][/C][C]95% LB[/C][C]95% UB[/C][C]p-value(H0: Y[t] = F[t])[/C][C]P(F[t]>Y[t-1])[/C][C]P(F[t]>Y[t-s])[/C][C]P(F[t]>Y[32])[/C][/ROW]
[ROW][C]28[/C][C]710645[/C][C]-[/C][C]-[/C][C]-[/C][C]-[/C][C]-[/C][C]-[/C][C]-[/C][/ROW]
[ROW][C]29[/C][C]939567[/C][C]-[/C][C]-[/C][C]-[/C][C]-[/C][C]-[/C][C]-[/C][C]-[/C][/ROW]
[ROW][C]30[/C][C]462391[/C][C]-[/C][C]-[/C][C]-[/C][C]-[/C][C]-[/C][C]-[/C][C]-[/C][/ROW]
[ROW][C]31[/C][C]562784[/C][C]-[/C][C]-[/C][C]-[/C][C]-[/C][C]-[/C][C]-[/C][C]-[/C][/ROW]
[ROW][C]32[/C][C]745282[/C][C]-[/C][C]-[/C][C]-[/C][C]-[/C][C]-[/C][C]-[/C][C]-[/C][/ROW]
[ROW][C]33[/C][C]973380[/C][C]981794.5116[/C][C]884047.563[/C][C]1079541.4602[/C][C]0.433[/C][C]1[/C][C]0.8014[/C][C]1[/C][/ROW]
[ROW][C]34[/C][C]513575[/C][C]484798.6952[/C][C]366371.0338[/C][C]603226.3567[/C][C]0.3169[/C][C]0[/C][C]0.6446[/C][C]0[/C][/ROW]
[ROW][C]35[/C][C]507811[/C][C]592541.8609[/C][C]451389.9459[/C][C]733693.7759[/C][C]0.1197[/C][C]0.8636[/C][C]0.6603[/C][C]0.017[/C][/ROW]
[ROW][C]36[/C][C]764929[/C][C]774676.3015[/C][C]615486.5021[/C][C]933866.1008[/C][C]0.4522[/C][C]0.9995[/C][C]0.6413[/C][C]0.6413[/C][/ROW]
[ROW][C]37[/C][C]921722[/C][C]1012467.5039[/C][C]765720.9709[/C][C]1259214.037[/C][C]0.2355[/C][C]0.9754[/C][C]0.6219[/C][C]0.9831[/C][/ROW]
[ROW][C]38[/C][C]493969[/C][C]512139.0557[/C][C]222222.3184[/C][C]802055.7929[/C][C]0.4511[/C][C]0.0028[/C][C]0.4961[/C][C]0.0575[/C][/ROW]
[ROW][C]39[/C][C]580275[/C][C]621118.083[/C][C]288079.6061[/C][C]954156.5598[/C][C]0.405[/C][C]0.7729[/C][C]0.7476[/C][C]0.2325[/C][/ROW]
[ROW][C]40[/C][C]804671[/C][C]803191.318[/C][C]433653.2077[/C][C]1172729.4284[/C][C]0.4969[/C][C]0.8815[/C][C]0.5804[/C][C]0.6206[/C][/ROW]
[ROW][C]41[/C][C]1031509[/C][C]1041197.5007[/C][C]578793.3197[/C][C]1503601.6817[/C][C]0.4836[/C][C]0.842[/C][C]0.6937[/C][C]0.8951[/C][/ROW]
[ROW][C]42[/C][C]593149[/C][C]540308.8193[/C][C]18998.0856[/C][C]1061619.5531[/C][C]0.4213[/C][C]0.0324[/C][C]0.5692[/C][C]0.2205[/C][/ROW]
[ROW][C]43[/C][C]638170[/C][C]649495.6011[/C][C]70163.7753[/C][C]1228827.4268[/C][C]0.4847[/C][C]0.5756[/C][C]0.5926[/C][C]0.3729[/C][/ROW]
[ROW][C]44[/C][C]874457[/C][C]831558.5464[/C][C]201041.894[/C][C]1462075.1988[/C][C]0.447[/C][C]0.7261[/C][C]0.5333[/C][C]0.6057[/C][/ROW]
[ROW][C]45[/C][C]1177875[/C][C]1069600.868[/C][C]339975.1241[/C][C]1799226.6119[/C][C]0.3856[/C][C]0.6999[/C][C]0.5408[/C][C]0.8082[/C][/ROW]
[ROW][C]46[/C][C]689356[/C][C]568618.01[/C][C]-232069.4099[/C][C]1369305.4299[/C][C]0.3838[/C][C]0.0679[/C][C]0.4761[/C][C]0.3327[/C][/ROW]
[ROW][C]47[/C][C]752624[/C][C]677839.7158[/C][C]-192751.0598[/C][C]1548430.4914[/C][C]0.4331[/C][C]0.4897[/C][C]0.5356[/C][C]0.4397[/C][/ROW]
[ROW][C]48[/C][C]934424[/C][C]859900.9314[/C][C]-73974.6277[/C][C]1793776.4905[/C][C]0.4379[/C][C]0.5891[/C][C]0.4878[/C][C]0.5951[/C][/ROW]
[ROW][C]49[/C][C]1191042[/C][C]1097949.3281[/C][C]58551.8578[/C][C]2137346.7984[/C][C]0.4303[/C][C]0.6211[/C][C]0.4401[/C][C]0.747[/C][/ROW]
[ROW][C]50[/C][C]660037[/C][C]596950.6387[/C][C]-523685.8728[/C][C]1717587.1502[/C][C]0.4561[/C][C]0.1494[/C][C]0.4358[/C][C]0.3977[/C][/ROW]
[ROW][C]51[/C][C]751254[/C][C]706178.2153[/C][C]-494462.8664[/C][C]1906819.2971[/C][C]0.4707[/C][C]0.53[/C][C]0.4698[/C][C]0.4746[/C][/ROW]
[ROW][C]52[/C][C]973871[/C][C]888239.1401[/C][C]-386094.5332[/C][C]2162572.8135[/C][C]0.4476[/C][C]0.5834[/C][C]0.4717[/C][C]0.587[/C][/ROW]
[ROW][C]53[/C][C]1179078[/C][C]1126288.5581[/C][C]-259879.9294[/C][C]2512457.0456[/C][C]0.4702[/C][C]0.5853[/C][C]0.4635[/C][C]0.705[/C][/ROW]
[ROW][C]54[/C][C]675609[/C][C]625287.2074[/C][C]-851052.8387[/C][C]2101627.2535[/C][C]0.4734[/C][C]0.2311[/C][C]0.4816[/C][C]0.4367[/C][/ROW]
[ROW][C]55[/C][C]766401[/C][C]734515.771[/C][C]-830757.0579[/C][C]2299788.5998[/C][C]0.4841[/C][C]0.5294[/C][C]0.4916[/C][C]0.4946[/C][/ROW]
[ROW][C]56[/C][C]1053303[/C][C]916576.6469[/C][C]-731622.6972[/C][C]2564775.991[/C][C]0.4354[/C][C]0.5709[/C][C]0.4728[/C][C]0.5807[/C][/ROW]
[/TABLE]
Source: https://freestatistics.org/blog/index.php?pk=285012&T=1

Globally Unique Identifier (entire table): ba.freestatistics.org/blog/index.php?pk=285012&T=1

As an alternative you can also use a QR Code:  

The GUIDs for individual cells are displayed in the table below:

Univariate ARIMA Extrapolation Forecast
timeY[t]F[t]95% LB95% UBp-value(H0: Y[t] = F[t])P(F[t]>Y[t-1])P(F[t]>Y[t-s])P(F[t]>Y[32])
28710645-------
29939567-------
30462391-------
31562784-------
32745282-------
33973380981794.5116884047.5631079541.46020.43310.80141
34513575484798.6952366371.0338603226.35670.316900.64460
35507811592541.8609451389.9459733693.77590.11970.86360.66030.017
36764929774676.3015615486.5021933866.10080.45220.99950.64130.6413
379217221012467.5039765720.97091259214.0370.23550.97540.62190.9831
38493969512139.0557222222.3184802055.79290.45110.00280.49610.0575
39580275621118.083288079.6061954156.55980.4050.77290.74760.2325
40804671803191.318433653.20771172729.42840.49690.88150.58040.6206
4110315091041197.5007578793.31971503601.68170.48360.8420.69370.8951
42593149540308.819318998.08561061619.55310.42130.03240.56920.2205
43638170649495.601170163.77531228827.42680.48470.57560.59260.3729
44874457831558.5464201041.8941462075.19880.4470.72610.53330.6057
4511778751069600.868339975.12411799226.61190.38560.69990.54080.8082
46689356568618.01-232069.40991369305.42990.38380.06790.47610.3327
47752624677839.7158-192751.05981548430.49140.43310.48970.53560.4397
48934424859900.9314-73974.62771793776.49050.43790.58910.48780.5951
4911910421097949.328158551.85782137346.79840.43030.62110.44010.747
50660037596950.6387-523685.87281717587.15020.45610.14940.43580.3977
51751254706178.2153-494462.86641906819.29710.47070.530.46980.4746
52973871888239.1401-386094.53322162572.81350.44760.58340.47170.587
5311790781126288.5581-259879.92942512457.04560.47020.58530.46350.705
54675609625287.2074-851052.83872101627.25350.47340.23110.48160.4367
55766401734515.771-830757.05792299788.59980.48410.52940.49160.4946
561053303916576.6469-731622.69722564775.9910.43540.57090.47280.5807


Univariate ARIMA Extrapolation Forecast Performance
time% S.E.PEMAPEsMAPESq.EMSERMSEScaledEMASE
330.0508-0.00860.00860.008670804004.782400-0.03340.0334
340.12460.0560.03230.0331828075715.7608449439860.271621199.99670.11430.0739
350.1215-0.16690.07720.07347179318785.53092692732835.35851891.5488-0.33660.1615
360.1048-0.01270.06110.058295009885.97892043302098.013245202.8992-0.03870.1308
370.1243-0.09850.06850.06548234746482.71373281590974.953357285.1724-0.36050.1767
380.2888-0.03680.06330.0605330150923.27692789684299.673952817.4621-0.07220.1593
390.2736-0.07040.06430.06161668157425.95192629466174.856551278.3207-0.16230.1597
400.23470.00180.05650.05412189458.67322301056585.333647969.32960.00590.1405
410.2266-0.00940.05120.049193867045.63632055813303.14545341.0774-0.03850.1292
420.49230.08910.0550.05352792084692.88752129440442.119246145.86050.20990.1372
430.4551-0.01770.05160.0503128269239.41051947515787.327544130.6672-0.0450.1289
440.38690.04910.05140.05031840277322.86581938579248.622444029.29990.17040.1323
450.3480.09190.05450.053811723287651.5122691249125.767851877.25060.43020.1552
460.71840.17510.06310.063714577662229.94493540278633.20959500.24060.47970.1784
470.65530.09940.06560.06645592689163.49423677106001.894760639.14580.29710.1863
480.55410.07980.06650.06745553687757.66873794392361.630561598.63930.29610.1932
490.4830.07820.06710.06838666245562.49534080971961.681463882.48560.36980.2036
500.95780.09560.06870.073979888980.38844075356240.498563838.51690.25060.2062
510.86740.060.06830.06962031826362.7713967802036.407562990.49160.17910.2048
520.7320.08790.06920.07077332815423.36764136052705.755564312.15050.34020.2115
530.62790.04480.06810.06952786725176.77694071799013.899463810.64970.20970.2114
541.20460.07450.06840.06992532282807.94984001821004.538163259.94790.19990.2109
551.08730.04160.06720.06871016667831.48293872031736.144462225.65180.12670.2073
560.91750.12980.06980.071618694095640.12484489617732.143567004.60980.54320.2213

\begin{tabular}{lllllllll}
\hline
Univariate ARIMA Extrapolation Forecast Performance \tabularnewline
time & % S.E. & PE & MAPE & sMAPE & Sq.E & MSE & RMSE & ScaledE & MASE \tabularnewline
33 & 0.0508 & -0.0086 & 0.0086 & 0.0086 & 70804004.7824 & 0 & 0 & -0.0334 & 0.0334 \tabularnewline
34 & 0.1246 & 0.056 & 0.0323 & 0.0331 & 828075715.7608 & 449439860.2716 & 21199.9967 & 0.1143 & 0.0739 \tabularnewline
35 & 0.1215 & -0.1669 & 0.0772 & 0.0734 & 7179318785.5309 & 2692732835.358 & 51891.5488 & -0.3366 & 0.1615 \tabularnewline
36 & 0.1048 & -0.0127 & 0.0611 & 0.0582 & 95009885.9789 & 2043302098.0132 & 45202.8992 & -0.0387 & 0.1308 \tabularnewline
37 & 0.1243 & -0.0985 & 0.0685 & 0.0654 & 8234746482.7137 & 3281590974.9533 & 57285.1724 & -0.3605 & 0.1767 \tabularnewline
38 & 0.2888 & -0.0368 & 0.0633 & 0.0605 & 330150923.2769 & 2789684299.6739 & 52817.4621 & -0.0722 & 0.1593 \tabularnewline
39 & 0.2736 & -0.0704 & 0.0643 & 0.0616 & 1668157425.9519 & 2629466174.8565 & 51278.3207 & -0.1623 & 0.1597 \tabularnewline
40 & 0.2347 & 0.0018 & 0.0565 & 0.0541 & 2189458.6732 & 2301056585.3336 & 47969.3296 & 0.0059 & 0.1405 \tabularnewline
41 & 0.2266 & -0.0094 & 0.0512 & 0.0491 & 93867045.6363 & 2055813303.145 & 45341.0774 & -0.0385 & 0.1292 \tabularnewline
42 & 0.4923 & 0.0891 & 0.055 & 0.0535 & 2792084692.8875 & 2129440442.1192 & 46145.8605 & 0.2099 & 0.1372 \tabularnewline
43 & 0.4551 & -0.0177 & 0.0516 & 0.0503 & 128269239.4105 & 1947515787.3275 & 44130.6672 & -0.045 & 0.1289 \tabularnewline
44 & 0.3869 & 0.0491 & 0.0514 & 0.0503 & 1840277322.8658 & 1938579248.6224 & 44029.2999 & 0.1704 & 0.1323 \tabularnewline
45 & 0.348 & 0.0919 & 0.0545 & 0.0538 & 11723287651.512 & 2691249125.7678 & 51877.2506 & 0.4302 & 0.1552 \tabularnewline
46 & 0.7184 & 0.1751 & 0.0631 & 0.0637 & 14577662229.9449 & 3540278633.209 & 59500.2406 & 0.4797 & 0.1784 \tabularnewline
47 & 0.6553 & 0.0994 & 0.0656 & 0.0664 & 5592689163.4942 & 3677106001.8947 & 60639.1458 & 0.2971 & 0.1863 \tabularnewline
48 & 0.5541 & 0.0798 & 0.0665 & 0.0674 & 5553687757.6687 & 3794392361.6305 & 61598.6393 & 0.2961 & 0.1932 \tabularnewline
49 & 0.483 & 0.0782 & 0.0671 & 0.0683 & 8666245562.4953 & 4080971961.6814 & 63882.4856 & 0.3698 & 0.2036 \tabularnewline
50 & 0.9578 & 0.0956 & 0.0687 & 0.07 & 3979888980.3884 & 4075356240.4985 & 63838.5169 & 0.2506 & 0.2062 \tabularnewline
51 & 0.8674 & 0.06 & 0.0683 & 0.0696 & 2031826362.771 & 3967802036.4075 & 62990.4916 & 0.1791 & 0.2048 \tabularnewline
52 & 0.732 & 0.0879 & 0.0692 & 0.0707 & 7332815423.3676 & 4136052705.7555 & 64312.1505 & 0.3402 & 0.2115 \tabularnewline
53 & 0.6279 & 0.0448 & 0.0681 & 0.0695 & 2786725176.7769 & 4071799013.8994 & 63810.6497 & 0.2097 & 0.2114 \tabularnewline
54 & 1.2046 & 0.0745 & 0.0684 & 0.0699 & 2532282807.9498 & 4001821004.5381 & 63259.9479 & 0.1999 & 0.2109 \tabularnewline
55 & 1.0873 & 0.0416 & 0.0672 & 0.0687 & 1016667831.4829 & 3872031736.1444 & 62225.6518 & 0.1267 & 0.2073 \tabularnewline
56 & 0.9175 & 0.1298 & 0.0698 & 0.0716 & 18694095640.1248 & 4489617732.1435 & 67004.6098 & 0.5432 & 0.2213 \tabularnewline
\hline
\end{tabular}
%Source: https://freestatistics.org/blog/index.php?pk=285012&T=2

[TABLE]
[ROW][C]Univariate ARIMA Extrapolation Forecast Performance[/C][/ROW]
[ROW][C]time[/C][C]% S.E.[/C][C]PE[/C][C]MAPE[/C][C]sMAPE[/C][C]Sq.E[/C][C]MSE[/C][C]RMSE[/C][C]ScaledE[/C][C]MASE[/C][/ROW]
[ROW][C]33[/C][C]0.0508[/C][C]-0.0086[/C][C]0.0086[/C][C]0.0086[/C][C]70804004.7824[/C][C]0[/C][C]0[/C][C]-0.0334[/C][C]0.0334[/C][/ROW]
[ROW][C]34[/C][C]0.1246[/C][C]0.056[/C][C]0.0323[/C][C]0.0331[/C][C]828075715.7608[/C][C]449439860.2716[/C][C]21199.9967[/C][C]0.1143[/C][C]0.0739[/C][/ROW]
[ROW][C]35[/C][C]0.1215[/C][C]-0.1669[/C][C]0.0772[/C][C]0.0734[/C][C]7179318785.5309[/C][C]2692732835.358[/C][C]51891.5488[/C][C]-0.3366[/C][C]0.1615[/C][/ROW]
[ROW][C]36[/C][C]0.1048[/C][C]-0.0127[/C][C]0.0611[/C][C]0.0582[/C][C]95009885.9789[/C][C]2043302098.0132[/C][C]45202.8992[/C][C]-0.0387[/C][C]0.1308[/C][/ROW]
[ROW][C]37[/C][C]0.1243[/C][C]-0.0985[/C][C]0.0685[/C][C]0.0654[/C][C]8234746482.7137[/C][C]3281590974.9533[/C][C]57285.1724[/C][C]-0.3605[/C][C]0.1767[/C][/ROW]
[ROW][C]38[/C][C]0.2888[/C][C]-0.0368[/C][C]0.0633[/C][C]0.0605[/C][C]330150923.2769[/C][C]2789684299.6739[/C][C]52817.4621[/C][C]-0.0722[/C][C]0.1593[/C][/ROW]
[ROW][C]39[/C][C]0.2736[/C][C]-0.0704[/C][C]0.0643[/C][C]0.0616[/C][C]1668157425.9519[/C][C]2629466174.8565[/C][C]51278.3207[/C][C]-0.1623[/C][C]0.1597[/C][/ROW]
[ROW][C]40[/C][C]0.2347[/C][C]0.0018[/C][C]0.0565[/C][C]0.0541[/C][C]2189458.6732[/C][C]2301056585.3336[/C][C]47969.3296[/C][C]0.0059[/C][C]0.1405[/C][/ROW]
[ROW][C]41[/C][C]0.2266[/C][C]-0.0094[/C][C]0.0512[/C][C]0.0491[/C][C]93867045.6363[/C][C]2055813303.145[/C][C]45341.0774[/C][C]-0.0385[/C][C]0.1292[/C][/ROW]
[ROW][C]42[/C][C]0.4923[/C][C]0.0891[/C][C]0.055[/C][C]0.0535[/C][C]2792084692.8875[/C][C]2129440442.1192[/C][C]46145.8605[/C][C]0.2099[/C][C]0.1372[/C][/ROW]
[ROW][C]43[/C][C]0.4551[/C][C]-0.0177[/C][C]0.0516[/C][C]0.0503[/C][C]128269239.4105[/C][C]1947515787.3275[/C][C]44130.6672[/C][C]-0.045[/C][C]0.1289[/C][/ROW]
[ROW][C]44[/C][C]0.3869[/C][C]0.0491[/C][C]0.0514[/C][C]0.0503[/C][C]1840277322.8658[/C][C]1938579248.6224[/C][C]44029.2999[/C][C]0.1704[/C][C]0.1323[/C][/ROW]
[ROW][C]45[/C][C]0.348[/C][C]0.0919[/C][C]0.0545[/C][C]0.0538[/C][C]11723287651.512[/C][C]2691249125.7678[/C][C]51877.2506[/C][C]0.4302[/C][C]0.1552[/C][/ROW]
[ROW][C]46[/C][C]0.7184[/C][C]0.1751[/C][C]0.0631[/C][C]0.0637[/C][C]14577662229.9449[/C][C]3540278633.209[/C][C]59500.2406[/C][C]0.4797[/C][C]0.1784[/C][/ROW]
[ROW][C]47[/C][C]0.6553[/C][C]0.0994[/C][C]0.0656[/C][C]0.0664[/C][C]5592689163.4942[/C][C]3677106001.8947[/C][C]60639.1458[/C][C]0.2971[/C][C]0.1863[/C][/ROW]
[ROW][C]48[/C][C]0.5541[/C][C]0.0798[/C][C]0.0665[/C][C]0.0674[/C][C]5553687757.6687[/C][C]3794392361.6305[/C][C]61598.6393[/C][C]0.2961[/C][C]0.1932[/C][/ROW]
[ROW][C]49[/C][C]0.483[/C][C]0.0782[/C][C]0.0671[/C][C]0.0683[/C][C]8666245562.4953[/C][C]4080971961.6814[/C][C]63882.4856[/C][C]0.3698[/C][C]0.2036[/C][/ROW]
[ROW][C]50[/C][C]0.9578[/C][C]0.0956[/C][C]0.0687[/C][C]0.07[/C][C]3979888980.3884[/C][C]4075356240.4985[/C][C]63838.5169[/C][C]0.2506[/C][C]0.2062[/C][/ROW]
[ROW][C]51[/C][C]0.8674[/C][C]0.06[/C][C]0.0683[/C][C]0.0696[/C][C]2031826362.771[/C][C]3967802036.4075[/C][C]62990.4916[/C][C]0.1791[/C][C]0.2048[/C][/ROW]
[ROW][C]52[/C][C]0.732[/C][C]0.0879[/C][C]0.0692[/C][C]0.0707[/C][C]7332815423.3676[/C][C]4136052705.7555[/C][C]64312.1505[/C][C]0.3402[/C][C]0.2115[/C][/ROW]
[ROW][C]53[/C][C]0.6279[/C][C]0.0448[/C][C]0.0681[/C][C]0.0695[/C][C]2786725176.7769[/C][C]4071799013.8994[/C][C]63810.6497[/C][C]0.2097[/C][C]0.2114[/C][/ROW]
[ROW][C]54[/C][C]1.2046[/C][C]0.0745[/C][C]0.0684[/C][C]0.0699[/C][C]2532282807.9498[/C][C]4001821004.5381[/C][C]63259.9479[/C][C]0.1999[/C][C]0.2109[/C][/ROW]
[ROW][C]55[/C][C]1.0873[/C][C]0.0416[/C][C]0.0672[/C][C]0.0687[/C][C]1016667831.4829[/C][C]3872031736.1444[/C][C]62225.6518[/C][C]0.1267[/C][C]0.2073[/C][/ROW]
[ROW][C]56[/C][C]0.9175[/C][C]0.1298[/C][C]0.0698[/C][C]0.0716[/C][C]18694095640.1248[/C][C]4489617732.1435[/C][C]67004.6098[/C][C]0.5432[/C][C]0.2213[/C][/ROW]
[/TABLE]
Source: https://freestatistics.org/blog/index.php?pk=285012&T=2

Globally Unique Identifier (entire table): ba.freestatistics.org/blog/index.php?pk=285012&T=2

As an alternative you can also use a QR Code:  

The GUIDs for individual cells are displayed in the table below:

Univariate ARIMA Extrapolation Forecast Performance
time% S.E.PEMAPEsMAPESq.EMSERMSEScaledEMASE
330.0508-0.00860.00860.008670804004.782400-0.03340.0334
340.12460.0560.03230.0331828075715.7608449439860.271621199.99670.11430.0739
350.1215-0.16690.07720.07347179318785.53092692732835.35851891.5488-0.33660.1615
360.1048-0.01270.06110.058295009885.97892043302098.013245202.8992-0.03870.1308
370.1243-0.09850.06850.06548234746482.71373281590974.953357285.1724-0.36050.1767
380.2888-0.03680.06330.0605330150923.27692789684299.673952817.4621-0.07220.1593
390.2736-0.07040.06430.06161668157425.95192629466174.856551278.3207-0.16230.1597
400.23470.00180.05650.05412189458.67322301056585.333647969.32960.00590.1405
410.2266-0.00940.05120.049193867045.63632055813303.14545341.0774-0.03850.1292
420.49230.08910.0550.05352792084692.88752129440442.119246145.86050.20990.1372
430.4551-0.01770.05160.0503128269239.41051947515787.327544130.6672-0.0450.1289
440.38690.04910.05140.05031840277322.86581938579248.622444029.29990.17040.1323
450.3480.09190.05450.053811723287651.5122691249125.767851877.25060.43020.1552
460.71840.17510.06310.063714577662229.94493540278633.20959500.24060.47970.1784
470.65530.09940.06560.06645592689163.49423677106001.894760639.14580.29710.1863
480.55410.07980.06650.06745553687757.66873794392361.630561598.63930.29610.1932
490.4830.07820.06710.06838666245562.49534080971961.681463882.48560.36980.2036
500.95780.09560.06870.073979888980.38844075356240.498563838.51690.25060.2062
510.86740.060.06830.06962031826362.7713967802036.407562990.49160.17910.2048
520.7320.08790.06920.07077332815423.36764136052705.755564312.15050.34020.2115
530.62790.04480.06810.06952786725176.77694071799013.899463810.64970.20970.2114
541.20460.07450.06840.06992532282807.94984001821004.538163259.94790.19990.2109
551.08730.04160.06720.06871016667831.48293872031736.144462225.65180.12670.2073
560.91750.12980.06980.071618694095640.12484489617732.143567004.60980.54320.2213


Parameters (Session):
par1 = 24 ; par2 = 1 ; par3 = 1 ; par4 = 1 ; par5 = 4 ; par6 = 3 ; par7 = 1 ; par8 = 1 ; par9 = 1 ; par10 = FALSE ;
Parameters (R input):
par1 = 24 ; par2 = 1 ; par3 = 1 ; par4 = 1 ; par5 = 4 ; par6 = 1 ; par7 = 1 ; par8 = 1 ; par9 = 1 ; par10 = FALSE ;
R code (references can be found in the software module):
par10 <- 'FALSE'
par9 <- '1'
par8 <- '1'
par7 <- '1'
par6 <- '2'
par5 <- '4'
par4 <- '1'
par3 <- '1'
par2 <- '1'
par1 <- '16'
par1 <- as.numeric(par1) #cut off periods
par2 <- as.numeric(par2) #lambda
par3 <- as.numeric(par3) #degree of non-seasonal differencing
par4 <- as.numeric(par4) #degree of seasonal differencing
par5 <- as.numeric(par5) #seasonal period
par6 <- as.numeric(par6) #p
par7 <- as.numeric(par7) #q
par8 <- as.numeric(par8) #P
par9 <- as.numeric(par9) #Q
if (par10 == 'TRUE') par10 <- TRUE
if (par10 == 'FALSE') par10 <- FALSE
if (par2 == 0) x <- log(x)
if (par2 != 0) x <- x^par2
lx <- length(x)
first <- lx - 2*par1
nx <- lx - par1
nx1 <- nx + 1
fx <- lx - nx
if (fx < 1) {
fx <- par5
nx1 <- lx + fx - 1
first <- lx - 2*fx
}
first <- 1
if (fx < 3) fx <- round(lx/10,0)
(arima.out <- arima(x[1:nx], order=c(par6,par3,par7), seasonal=list(order=c(par8,par4,par9), period=par5), include.mean=par10, method='ML'))
(forecast <- predict(arima.out,par1))
(lb <- forecast$pred - 1.96 * forecast$se)
(ub <- forecast$pred + 1.96 * forecast$se)
if (par2 == 0) {
x <- exp(x)
forecast$pred <- exp(forecast$pred)
lb <- exp(lb)
ub <- exp(ub)
}
if (par2 != 0) {
x <- x^(1/par2)
forecast$pred <- forecast$pred^(1/par2)
lb <- lb^(1/par2)
ub <- ub^(1/par2)
}
if (par2 < 0) {
olb <- lb
lb <- ub
ub <- olb
}
(actandfor <- c(x[1:nx], forecast$pred))
(perc.se <- (ub-forecast$pred)/1.96/forecast$pred)
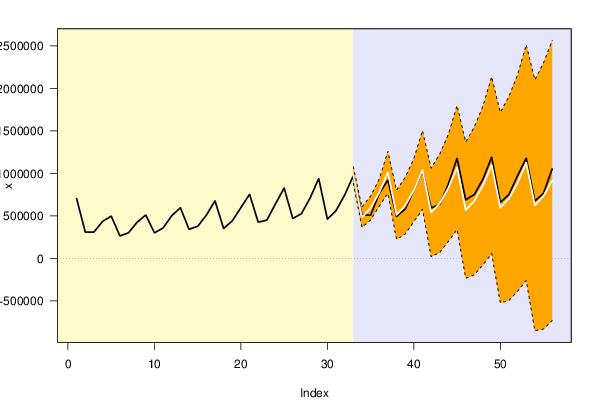
bitmap(file='test1.png')
opar <- par(mar=c(4,4,2,2),las=1)
ylim <- c( min(x[first:nx],lb), max(x[first:nx],ub))
plot(x,ylim=ylim,type='n',xlim=c(first,lx))
usr <- par('usr')
rect(usr[1],usr[3],nx+1,usr[4],border=NA,col='lemonchiffon')
rect(nx1,usr[3],usr[2],usr[4],border=NA,col='lavender')
abline(h= (-3:3)*2 , col ='gray', lty =3)
polygon( c(nx1:lx,lx:nx1), c(lb,rev(ub)), col = 'orange', lty=2,border=NA)
lines(nx1:lx, lb , lty=2)
lines(nx1:lx, ub , lty=2)
lines(x, lwd=2)
lines(nx1:lx, forecast$pred , lwd=2 , col ='white')
box()
par(opar)
dev.off()
prob.dec <- array(NA, dim=fx)
prob.sdec <- array(NA, dim=fx)
prob.ldec <- array(NA, dim=fx)
prob.pval <- array(NA, dim=fx)
perf.pe <- array(0, dim=fx)
perf.spe <- array(0, dim=fx)
perf.scalederr <- array(0, dim=fx)
perf.mase <- array(0, dim=fx)
perf.mase1 <- array(0, dim=fx)
perf.mape <- array(0, dim=fx)
perf.smape <- array(0, dim=fx)
perf.mape1 <- array(0, dim=fx)
perf.smape1 <- array(0,dim=fx)
perf.se <- array(0, dim=fx)
perf.mse <- array(0, dim=fx)
perf.mse1 <- array(0, dim=fx)
perf.rmse <- array(0, dim=fx)
perf.scaleddenom <- 0
for (i in 2:fx) {
perf.scaleddenom = perf.scaleddenom + abs(x[nx+i] - x[nx+i-1])
}
perf.scaleddenom = perf.scaleddenom / (fx-1)
for (i in 1:fx) {
locSD <- (ub[i] - forecast$pred[i]) / 1.96
perf.scalederr[i] = (x[nx+i] - forecast$pred[i]) / perf.scaleddenom
perf.pe[i] = (x[nx+i] - forecast$pred[i]) / x[nx+i]
perf.spe[i] = 2*(x[nx+i] - forecast$pred[i]) / (x[nx+i] + forecast$pred[i])
perf.se[i] = (x[nx+i] - forecast$pred[i])^2
prob.dec[i] = pnorm((x[nx+i-1] - forecast$pred[i]) / locSD)
prob.sdec[i] = pnorm((x[nx+i-par5] - forecast$pred[i]) / locSD)
prob.ldec[i] = pnorm((x[nx] - forecast$pred[i]) / locSD)
prob.pval[i] = pnorm(abs(x[nx+i] - forecast$pred[i]) / locSD)
}
perf.mape[1] = abs(perf.pe[1])
perf.smape[1] = abs(perf.spe[1])
perf.mape1[1] = perf.mape[1]
perf.smape1[1] = perf.smape[1]
perf.mse[1] = perf.se[1]
perf.mase[1] = abs(perf.scalederr[1])
perf.mase1[1] = perf.mase[1]
for (i in 2:fx) {
perf.mape[i] = perf.mape[i-1] + abs(perf.pe[i])
perf.mape1[i] = perf.mape[i] / i
perf.smape[i] = perf.smape[i-1] + abs(perf.spe[i])
perf.smape1[i] = perf.smape[i] / i
perf.mse[i] = perf.mse[i-1] + perf.se[i]
perf.mse1[i] = perf.mse[i] / i
perf.mase[i] = perf.mase[i-1] + abs(perf.scalederr[i])
perf.mase1[i] = perf.mase[i] / i
}
perf.rmse = sqrt(perf.mse1)
bitmap(file='test2.png')
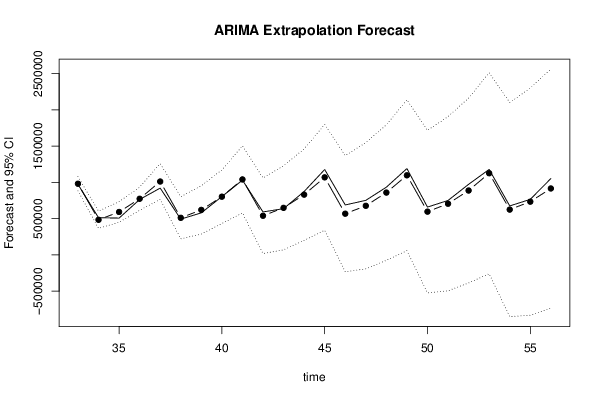
plot(forecast$pred, pch=19, type='b',main='ARIMA Extrapolation Forecast', ylab='Forecast and 95% CI', xlab='time',ylim=c(min(lb),max(ub)))
dum <- forecast$pred
dum[1:par1] <- x[(nx+1):lx]
lines(dum, lty=1)
lines(ub,lty=3)
lines(lb,lty=3)
dev.off()
load(file='createtable')
a<-table.start()
a<-table.row.start(a)
a<-table.element(a,'Univariate ARIMA Extrapolation Forecast',9,TRUE)
a<-table.row.end(a)
a<-table.row.start(a)
a<-table.element(a,'time',1,header=TRUE)
a<-table.element(a,'Y[t]',1,header=TRUE)
a<-table.element(a,'F[t]',1,header=TRUE)
a<-table.element(a,'95% LB',1,header=TRUE)
a<-table.element(a,'95% UB',1,header=TRUE)
a<-table.element(a,'p-value
(H0: Y[t] = F[t])',1,header=TRUE)
a<-table.element(a,'P(F[t]>Y[t-1])',1,header=TRUE)
a<-table.element(a,'P(F[t]>Y[t-s])',1,header=TRUE)
mylab <- paste('P(F[t]>Y[',nx,sep='')
mylab <- paste(mylab,'])',sep='')
a<-table.element(a,mylab,1,header=TRUE)
a<-table.row.end(a)
for (i in (nx-par5):nx) {
a<-table.row.start(a)
a<-table.element(a,i,header=TRUE)
a<-table.element(a,x[i])
a<-table.element(a,'-')
a<-table.row.end(a)
}
for (i in 1:fx) {
a<-table.row.start(a)
a<-table.element(a,nx+i,header=TRUE)
a<-table.element(a,round(x[nx+i],4))
a<-table.element(a,round(forecast$pred[i],4))
a<-table.element(a,round(lb[i],4))
a<-table.element(a,round(ub[i],4))
a<-table.element(a,round((1-prob.pval[i]),4))
a<-table.element(a,round((1-prob.dec[i]),4))
a<-table.element(a,round((1-prob.sdec[i]),4))
a<-table.element(a,round((1-prob.ldec[i]),4))
a<-table.row.end(a)
}
a<-table.end(a)
table.save(a,file='mytable.tab')
a<-table.start()
a<-table.row.start(a)
a<-table.element(a,'Univariate ARIMA Extrapolation Forecast Performance',10,TRUE)
a<-table.row.end(a)
a<-table.row.start(a)
a<-table.element(a,'time',1,header=TRUE)
a<-table.element(a,'% S.E.',1,header=TRUE)
a<-table.element(a,'PE',1,header=TRUE)
a<-table.element(a,'MAPE',1,header=TRUE)
a<-table.element(a,'sMAPE',1,header=TRUE)
a<-table.element(a,'Sq.E',1,header=TRUE)
a<-table.element(a,'MSE',1,header=TRUE)
a<-table.element(a,'RMSE',1,header=TRUE)
a<-table.element(a,'ScaledE',1,header=TRUE)
a<-table.element(a,'MASE',1,header=TRUE)
a<-table.row.end(a)
for (i in 1:fx) {
a<-table.row.start(a)
a<-table.element(a,nx+i,header=TRUE)
a<-table.element(a,round(perc.se[i],4))
a<-table.element(a,round(perf.pe[i],4))
a<-table.element(a,round(perf.mape1[i],4))
a<-table.element(a,round(perf.smape1[i],4))
a<-table.element(a,round(perf.se[i],4))
a<-table.element(a,round(perf.mse1[i],4))
a<-table.element(a,round(perf.rmse[i],4))
a<-table.element(a,round(perf.scalederr[i],4))
a<-table.element(a,round(perf.mase1[i],4))
a<-table.row.end(a)
}
a<-table.end(a)
table.save(a,file='mytable1.tab')