Free Statistics

of Irreproducible Research!

Author's title

Author*The author of this computation has been verified*
R Software Modulerwasp_multipleregression.wasp
Title produced by softwareMultiple Regression
Date of computationFri, 04 Dec 2015 09:43:07 +0000
Cite this page as followsStatistical Computations at FreeStatistics.org, Office for Research Development and Education, URL https://freestatistics.org/blog/index.php?v=date/2015/Dec/04/t1449222241z3wz2unsjurm2i5.htm/, Retrieved Thu, 16 May 2024 19:13:50 +0000
Statistical Computations at FreeStatistics.org, Office for Research Development and Education, URL https://freestatistics.org/blog/index.php?pk=285043, Retrieved Thu, 16 May 2024 19:13:50 +0000
QR Codes:

Original text written by user:
IsPrivate?No (this computation is public)
User-defined keywords
Estimated Impact123
Family? (F = Feedback message, R = changed R code, M = changed R Module, P = changed Parameters, D = changed Data)
-       [Multiple Regression] [Regressie Cons Ge...] [2015-12-04 09:43:07] [e73b7cd66085b2a8dc50e64bc3434afa] [Current]
Feedback Forum

Post a new message
Dataseries X:
-5 -25 50 14 17 -12 -6 19 -29
-1 -19 53 14 20 -9 -2 20 -29
-2 -20 50 16 19 -12 -4 21 -29
-5 -21 50 19 21 -10 -5 20 -27
-4 -19 51 18 17 -10 -2 21 -29
-6 -17 53 19 15 -11 -4 19 -24
-2 -16 49 20 18 -11 -4 22 -29
-2 -10 54 20 19 -10 -5 20 -21
-2 -16 57 24 16 -13 -7 18 -20
-2 -10 58 18 21 -10 -5 16 -26
2 -8 56 15 26 -6 -6 17 -19
1 -7 60 25 23 -9 -4 18 -22
-8 -15 55 23 24 -8 -2 19 -22
-1 -7 54 20 23 -12 -3 18 -15
1 -6 52 20 19 -10 0 20 -16
-1 -6 55 22 25 -11 -4 21 -22
2 2 56 25 21 -13 -3 18 -21
2 -4 54 22 19 -10 -3 19 -11
1 -4 53 26 20 -10 -3 19 -10
-1 -8 59 27 20 -11 -4 19 -6
-2 -10 62 41 17 -11 -5 21 -8
-2 -16 63 29 25 -11 -5 19 -15
-1 -14 64 33 19 -10 -6 19 -16
-8 -30 75 39 13 -13 -10 17 -24
-4 -33 77 27 15 -12 -11 16 -27
-6 -40 79 27 15 -13 -13 16 -33
-3 -38 77 25 13 -15 -12 17 -29
-3 -39 82 19 11 -16 -13 16 -34
-7 -46 83 15 9 -18 -12 15 -37
-9 -50 81 19 2 -17 -15 16 -31
-11 -55 78 23 -2 -18 -14 16 -33
-13 -66 79 23 -4 -20 -16 16 -25
-11 -63 79 7 -2 -22 -16 18 -27
-9 -56 73 1 1 -17 -12 19 -21
-17 -66 72 7 -13 -19 -16 16 -32
-22 -63 67 4 -11 -18 -15 16 -31
-25 -69 67 -8 -14 -26 -17 16 -32
-20 -69 50 -14 -4 -19 -15 18 -30
-24 -72 45 -10 -9 -23 -14 16 -34
-24 -69 39 -11 -5 -21 -15 15 -35
-22 -67 39 -10 -4 -27 -14 15 -37
-19 -64 37 -8 -8 -27 -16 16 -32
-18 -61 30 -8 -1 -21 -11 18 -28
-17 -58 24 -7 -2 -22 -14 16 -26
-11 -47 27 -8 -1 -24 -12 19 -24
-11 -44 19 -4 8 -21 -11 19 -27
-12 -42 19 3 8 -21 -13 18 -26
-10 -34 25 -5 6 -22 -12 17 -27
-15 -38 16 -4 7 -25 -12 19 -27
-15 -41 20 5 2 -21 -10 22 -24
-15 -38 25 3 3 -26 -12 19 -28
-13 -37 34 6 0 -27 -11 19 -23
-8 -22 39 10 5 -22 -10 16 -23
-13 -37 40 16 -1 -22 -12 18 -29
-9 -36 38 11 3 -20 -12 20 -25
-7 -25 42 10 4 -21 -11 17 -24
-4 -15 46 21 8 -16 -12 17 -20
-4 -17 48 18 10 -17 -9 17 -22
-2 -19 51 20 14 -19 -6 20 -24
0 -12 55 18 15 -20 -7 21 -27
-2 -17 52 23 9 -20 -7 19 -25
-3 -21 55 28 8 -20 -10 18 -26
1 -10 58 31 10 -19 -8 20 -24
-2 -19 72 38 5 -20 -11 17 -26
-1 -14 70 27 4 -25 -12 15 -22
1 -8 70 21 8 -25 -11 17 -20
-3 -16 63 31 8 -22 -11 18 -26
-4 -14 66 31 10 -19 -9 20 -22
-9 -30 65 29 8 -20 -9 19 -29
-9 -33 55 24 10 -18 -12 20 -30
-7 -37 57 27 -8 -17 -10 22 -26
-14 -47 60 36 -6 -17 -10 20 -30
-12 -48 63 35 -10 -21 -13 21 -33
-16 -50 65 44 -15 -17 -13 19 -33
-20 -56 61 39 -21 -22 -12 22 -31
-12 -47 65 26 -24 -24 -14 19 -36
-12 -37 63 27 -15 -18 -9 21 -43
-10 -35 59 17 -12 -20 -12 19 -40
-10 -29 56 20 -11 -21 -10 21 -38
-13 -28 54 22 -11 -17 -13 18 -41
-16 -29 56 32 -13 -17 -11 18 -38
-14 -33 54 28 -10 -17 -11 20 -40
-17 -41 58 30 -9 -21 -11 19 -41
-24 -52 59 36 -11 -18 -12 19 -45
-25 -49 60 38 -17 -20 -13 17 -54
-23 -47 57 33 -14 -18 -10 18 -47
-17 -37 54 25 -15 -20 -11 17 -44
-24 -49 52 24 -17 -21 -10 18 -47
-20 -44 50 24 -14 -18 -12 19 -47
-19 -39 51 20 -14 -17 -10 17 -45
-18 -38 47 23 -16 -17 -10 19 -42
-16 -35 51 23 -15 -21 -11 19 -42
-12 -24 46 19 -14 -19 -12 17 -39
-7 -11 44 16 -15 -17 -8 19 -35
-6 -10 39 12 -7 -15 -6 21 -29
-6 -10 43 14 -7 -12 -6 20 -37
-5 -9 46 20 -1 -12 -4 19 -35
-4 -3 43 16 -5 -12 -6 21 -32
-4 -3 34 12 -3 -10 -6 20 -33
-8 -5 36 15 1 -17 -6 18 -37
-9 -8 34 9 -4 -16 -8 18 -36
-6 -6 38 19 -7 -17 -7 16 -34
-7 -9 32 12 -4 -14 -8 18 -38
-10 -13 38 19 -4 -8 -7 19 -33
-11 -20 30 17 -7 -14 -8 18 -41
-11 -22 17 8 3 -14 -7 18 -39
-12 -25 14 3 0 -16 -9 17 -40
-14 -28 18 14 -3 -19 -10 18 -42
-12 -28 18 6 -3 -22 -10 19 -45
-9 -23 13 2 -3 -17 -9 18 -39
-5 -20 9 -1 1 -15 -8 19 -44
-6 -20 12 8 2 -15 -8 19 -44
-6 -20 19 8 -1 -17 -7 20 -43
-3 -14 20 11 4 -14 -7 21 -39
-2 -7 25 15 2 -17 -11 17 -38
-6 -10 26 15 1 -14 -9 20 -43
-6 -14 29 26 1 -14 -11 21 -46
-10 -11 28 23 0 -14 -10 18 -42
-8 -15 30 20 3 -12 -13 19 -45
-4 -10 38 26 1 -17 -13 20 -46


Summary of computational transaction
Raw Inputview raw input (R code)
Raw Outputview raw output of R engine
Computing time6 seconds
R Server'Sir Maurice George Kendall' @ kendall.wessa.net

\begin{tabular}{lllllllll}
\hline
Summary of computational transaction \tabularnewline
Raw Input & view raw input (R code)  \tabularnewline
Raw Output & view raw output of R engine  \tabularnewline
Computing time & 6 seconds \tabularnewline
R Server & 'Sir Maurice George Kendall' @ kendall.wessa.net \tabularnewline
\hline
\end{tabular}
%Source: https://freestatistics.org/blog/index.php?pk=285043&T=0

[TABLE]
[ROW][C]Summary of computational transaction[/C][/ROW]
[ROW][C]Raw Input[/C][C]view raw input (R code) [/C][/ROW]
[ROW][C]Raw Output[/C][C]view raw output of R engine [/C][/ROW]
[ROW][C]Computing time[/C][C]6 seconds[/C][/ROW]
[ROW][C]R Server[/C][C]'Sir Maurice George Kendall' @ kendall.wessa.net[/C][/ROW]
[/TABLE]
Source: https://freestatistics.org/blog/index.php?pk=285043&T=0

Globally Unique Identifier (entire table): ba.freestatistics.org/blog/index.php?pk=285043&T=0

As an alternative you can also use a QR Code:  

The GUIDs for individual cells are displayed in the table below:

Summary of computational transaction
Raw Inputview raw input (R code)
Raw Outputview raw output of R engine
Computing time6 seconds
R Server'Sir Maurice George Kendall' @ kendall.wessa.net


Multiple Linear Regression - Estimated Regression Equation
consumentenvertrouwen[t] = -15.6952 + 0.260066econ_situatie_12m[t] + 0.097562cons_prijzen_12m[t] -0.108688vooruitz_cpi_12m[t] + 0.145136gunstig_bel_aankopen[t] + 0.0105756vooruitz_aankopen[t] -0.507594verloop_fin_12m[t] + 0.570949fin_sit_gezinnen[t] + 0.0504472gunstig_sparen[t] + 0.377007`consumentenvertrouwen(t-1)`[t] -0.0867008`consumentenvertrouwen(t-2)`[t] + 0.0622544`consumentenvertrouwen(t-3)`[t] -0.0573122`consumentenvertrouwen(t-4)`[t] + e[t]

\begin{tabular}{lllllllll}
\hline
Multiple Linear Regression - Estimated Regression Equation \tabularnewline
consumentenvertrouwen[t] =  -15.6952 +  0.260066econ_situatie_12m[t] +  0.097562cons_prijzen_12m[t] -0.108688vooruitz_cpi_12m[t] +  0.145136gunstig_bel_aankopen[t] +  0.0105756vooruitz_aankopen[t] -0.507594verloop_fin_12m[t] +  0.570949fin_sit_gezinnen[t] +  0.0504472gunstig_sparen[t] +  0.377007`consumentenvertrouwen(t-1)`[t] -0.0867008`consumentenvertrouwen(t-2)`[t] +  0.0622544`consumentenvertrouwen(t-3)`[t] -0.0573122`consumentenvertrouwen(t-4)`[t]  + e[t] \tabularnewline
 \tabularnewline
\hline
\end{tabular}
%Source: https://freestatistics.org/blog/index.php?pk=285043&T=1

[TABLE]
[ROW][C]Multiple Linear Regression - Estimated Regression Equation[/C][/ROW]
[ROW][C]consumentenvertrouwen[t] =  -15.6952 +  0.260066econ_situatie_12m[t] +  0.097562cons_prijzen_12m[t] -0.108688vooruitz_cpi_12m[t] +  0.145136gunstig_bel_aankopen[t] +  0.0105756vooruitz_aankopen[t] -0.507594verloop_fin_12m[t] +  0.570949fin_sit_gezinnen[t] +  0.0504472gunstig_sparen[t] +  0.377007`consumentenvertrouwen(t-1)`[t] -0.0867008`consumentenvertrouwen(t-2)`[t] +  0.0622544`consumentenvertrouwen(t-3)`[t] -0.0573122`consumentenvertrouwen(t-4)`[t]  + e[t][/C][/ROW]
[ROW][C][/C][/ROW]
[/TABLE]
Source: https://freestatistics.org/blog/index.php?pk=285043&T=1

Globally Unique Identifier (entire table): ba.freestatistics.org/blog/index.php?pk=285043&T=1

As an alternative you can also use a QR Code:  

The GUIDs for individual cells are displayed in the table below:

Multiple Linear Regression - Estimated Regression Equation
consumentenvertrouwen[t] = -15.6952 + 0.260066econ_situatie_12m[t] + 0.097562cons_prijzen_12m[t] -0.108688vooruitz_cpi_12m[t] + 0.145136gunstig_bel_aankopen[t] + 0.0105756vooruitz_aankopen[t] -0.507594verloop_fin_12m[t] + 0.570949fin_sit_gezinnen[t] + 0.0504472gunstig_sparen[t] + 0.377007`consumentenvertrouwen(t-1)`[t] -0.0867008`consumentenvertrouwen(t-2)`[t] + 0.0622544`consumentenvertrouwen(t-3)`[t] -0.0573122`consumentenvertrouwen(t-4)`[t] + e[t]


Multiple Linear Regression - Ordinary Least Squares
VariableParameterS.D.T-STATH0: parameter = 02-tail p-value1-tail p-value
(Intercept)-15.7 4.213-3.7260e+00 0.0003181 0.0001591
econ_situatie_12m+0.2601 0.02769+9.3930e+00 1.655e-15 8.277e-16
cons_prijzen_12m+0.09756 0.02169+4.4980e+00 1.809e-05 9.043e-06
vooruitz_cpi_12m-0.1087 0.02935-3.7030e+00 0.0003441 0.000172
gunstig_bel_aankopen+0.1451 0.03822+3.7980e+00 0.0002471 0.0001236
vooruitz_aankopen+0.01058 0.07504+1.4090e-01 0.8882 0.4441
verloop_fin_12m-0.5076 0.1359-3.7340e+00 0.0003095 0.0001547
fin_sit_gezinnen+0.5709 0.1598+3.5730e+00 0.0005387 0.0002693
gunstig_sparen+0.05045 0.03702+1.3630e+00 0.1759 0.08796
`consumentenvertrouwen(t-1)`+0.377 0.08056+4.6800e+00 8.772e-06 4.386e-06
`consumentenvertrouwen(t-2)`-0.0867 0.08952-9.6850e-01 0.335 0.1675
`consumentenvertrouwen(t-3)`+0.06225 0.08877+7.0130e-01 0.4847 0.2424
`consumentenvertrouwen(t-4)`-0.05731 0.07207-7.9530e-01 0.4283 0.2141

\begin{tabular}{lllllllll}
\hline
Multiple Linear Regression - Ordinary Least Squares \tabularnewline
Variable & Parameter & S.D. & T-STATH0: parameter = 0 & 2-tail p-value & 1-tail p-value \tabularnewline
(Intercept) & -15.7 &  4.213 & -3.7260e+00 &  0.0003181 &  0.0001591 \tabularnewline
econ_situatie_12m & +0.2601 &  0.02769 & +9.3930e+00 &  1.655e-15 &  8.277e-16 \tabularnewline
cons_prijzen_12m & +0.09756 &  0.02169 & +4.4980e+00 &  1.809e-05 &  9.043e-06 \tabularnewline
vooruitz_cpi_12m & -0.1087 &  0.02935 & -3.7030e+00 &  0.0003441 &  0.000172 \tabularnewline
gunstig_bel_aankopen & +0.1451 &  0.03822 & +3.7980e+00 &  0.0002471 &  0.0001236 \tabularnewline
vooruitz_aankopen & +0.01058 &  0.07504 & +1.4090e-01 &  0.8882 &  0.4441 \tabularnewline
verloop_fin_12m & -0.5076 &  0.1359 & -3.7340e+00 &  0.0003095 &  0.0001547 \tabularnewline
fin_sit_gezinnen & +0.5709 &  0.1598 & +3.5730e+00 &  0.0005387 &  0.0002693 \tabularnewline
gunstig_sparen & +0.05045 &  0.03702 & +1.3630e+00 &  0.1759 &  0.08796 \tabularnewline
`consumentenvertrouwen(t-1)` & +0.377 &  0.08056 & +4.6800e+00 &  8.772e-06 &  4.386e-06 \tabularnewline
`consumentenvertrouwen(t-2)` & -0.0867 &  0.08952 & -9.6850e-01 &  0.335 &  0.1675 \tabularnewline
`consumentenvertrouwen(t-3)` & +0.06225 &  0.08877 & +7.0130e-01 &  0.4847 &  0.2424 \tabularnewline
`consumentenvertrouwen(t-4)` & -0.05731 &  0.07207 & -7.9530e-01 &  0.4283 &  0.2141 \tabularnewline
\hline
\end{tabular}
%Source: https://freestatistics.org/blog/index.php?pk=285043&T=2

[TABLE]
[ROW][C]Multiple Linear Regression - Ordinary Least Squares[/C][/ROW]
[ROW][C]Variable[/C][C]Parameter[/C][C]S.D.[/C][C]T-STATH0: parameter = 0[/C][C]2-tail p-value[/C][C]1-tail p-value[/C][/ROW]
[ROW][C](Intercept)[/C][C]-15.7[/C][C] 4.213[/C][C]-3.7260e+00[/C][C] 0.0003181[/C][C] 0.0001591[/C][/ROW]
[ROW][C]econ_situatie_12m[/C][C]+0.2601[/C][C] 0.02769[/C][C]+9.3930e+00[/C][C] 1.655e-15[/C][C] 8.277e-16[/C][/ROW]
[ROW][C]cons_prijzen_12m[/C][C]+0.09756[/C][C] 0.02169[/C][C]+4.4980e+00[/C][C] 1.809e-05[/C][C] 9.043e-06[/C][/ROW]
[ROW][C]vooruitz_cpi_12m[/C][C]-0.1087[/C][C] 0.02935[/C][C]-3.7030e+00[/C][C] 0.0003441[/C][C] 0.000172[/C][/ROW]
[ROW][C]gunstig_bel_aankopen[/C][C]+0.1451[/C][C] 0.03822[/C][C]+3.7980e+00[/C][C] 0.0002471[/C][C] 0.0001236[/C][/ROW]
[ROW][C]vooruitz_aankopen[/C][C]+0.01058[/C][C] 0.07504[/C][C]+1.4090e-01[/C][C] 0.8882[/C][C] 0.4441[/C][/ROW]
[ROW][C]verloop_fin_12m[/C][C]-0.5076[/C][C] 0.1359[/C][C]-3.7340e+00[/C][C] 0.0003095[/C][C] 0.0001547[/C][/ROW]
[ROW][C]fin_sit_gezinnen[/C][C]+0.5709[/C][C] 0.1598[/C][C]+3.5730e+00[/C][C] 0.0005387[/C][C] 0.0002693[/C][/ROW]
[ROW][C]gunstig_sparen[/C][C]+0.05045[/C][C] 0.03702[/C][C]+1.3630e+00[/C][C] 0.1759[/C][C] 0.08796[/C][/ROW]
[ROW][C]`consumentenvertrouwen(t-1)`[/C][C]+0.377[/C][C] 0.08056[/C][C]+4.6800e+00[/C][C] 8.772e-06[/C][C] 4.386e-06[/C][/ROW]
[ROW][C]`consumentenvertrouwen(t-2)`[/C][C]-0.0867[/C][C] 0.08952[/C][C]-9.6850e-01[/C][C] 0.335[/C][C] 0.1675[/C][/ROW]
[ROW][C]`consumentenvertrouwen(t-3)`[/C][C]+0.06225[/C][C] 0.08877[/C][C]+7.0130e-01[/C][C] 0.4847[/C][C] 0.2424[/C][/ROW]
[ROW][C]`consumentenvertrouwen(t-4)`[/C][C]-0.05731[/C][C] 0.07207[/C][C]-7.9530e-01[/C][C] 0.4283[/C][C] 0.2141[/C][/ROW]
[/TABLE]
Source: https://freestatistics.org/blog/index.php?pk=285043&T=2

Globally Unique Identifier (entire table): ba.freestatistics.org/blog/index.php?pk=285043&T=2

As an alternative you can also use a QR Code:  

The GUIDs for individual cells are displayed in the table below:

Multiple Linear Regression - Ordinary Least Squares
VariableParameterS.D.T-STATH0: parameter = 02-tail p-value1-tail p-value
(Intercept)-15.7 4.213-3.7260e+00 0.0003181 0.0001591
econ_situatie_12m+0.2601 0.02769+9.3930e+00 1.655e-15 8.277e-16
cons_prijzen_12m+0.09756 0.02169+4.4980e+00 1.809e-05 9.043e-06
vooruitz_cpi_12m-0.1087 0.02935-3.7030e+00 0.0003441 0.000172
gunstig_bel_aankopen+0.1451 0.03822+3.7980e+00 0.0002471 0.0001236
vooruitz_aankopen+0.01058 0.07504+1.4090e-01 0.8882 0.4441
verloop_fin_12m-0.5076 0.1359-3.7340e+00 0.0003095 0.0001547
fin_sit_gezinnen+0.5709 0.1598+3.5730e+00 0.0005387 0.0002693
gunstig_sparen+0.05045 0.03702+1.3630e+00 0.1759 0.08796
`consumentenvertrouwen(t-1)`+0.377 0.08056+4.6800e+00 8.772e-06 4.386e-06
`consumentenvertrouwen(t-2)`-0.0867 0.08952-9.6850e-01 0.335 0.1675
`consumentenvertrouwen(t-3)`+0.06225 0.08877+7.0130e-01 0.4847 0.2424
`consumentenvertrouwen(t-4)`-0.05731 0.07207-7.9530e-01 0.4283 0.2141


Multiple Linear Regression - Regression Statistics
Multiple R 0.9531
R-squared 0.9085
Adjusted R-squared 0.8978
F-TEST (value) 85.17
F-TEST (DF numerator)12
F-TEST (DF denominator)103
p-value 0
Multiple Linear Regression - Residual Statistics
Residual Standard Deviation 2.247
Sum Squared Residuals 520.1

\begin{tabular}{lllllllll}
\hline
Multiple Linear Regression - Regression Statistics \tabularnewline
Multiple R &  0.9531 \tabularnewline
R-squared &  0.9085 \tabularnewline
Adjusted R-squared &  0.8978 \tabularnewline
F-TEST (value) &  85.17 \tabularnewline
F-TEST (DF numerator) & 12 \tabularnewline
F-TEST (DF denominator) & 103 \tabularnewline
p-value &  0 \tabularnewline
Multiple Linear Regression - Residual Statistics \tabularnewline
Residual Standard Deviation &  2.247 \tabularnewline
Sum Squared Residuals &  520.1 \tabularnewline
\hline
\end{tabular}
%Source: https://freestatistics.org/blog/index.php?pk=285043&T=3

[TABLE]
[ROW][C]Multiple Linear Regression - Regression Statistics[/C][/ROW]
[ROW][C]Multiple R[/C][C] 0.9531[/C][/ROW]
[ROW][C]R-squared[/C][C] 0.9085[/C][/ROW]
[ROW][C]Adjusted R-squared[/C][C] 0.8978[/C][/ROW]
[ROW][C]F-TEST (value)[/C][C] 85.17[/C][/ROW]
[ROW][C]F-TEST (DF numerator)[/C][C]12[/C][/ROW]
[ROW][C]F-TEST (DF denominator)[/C][C]103[/C][/ROW]
[ROW][C]p-value[/C][C] 0[/C][/ROW]
[ROW][C]Multiple Linear Regression - Residual Statistics[/C][/ROW]
[ROW][C]Residual Standard Deviation[/C][C] 2.247[/C][/ROW]
[ROW][C]Sum Squared Residuals[/C][C] 520.1[/C][/ROW]
[/TABLE]
Source: https://freestatistics.org/blog/index.php?pk=285043&T=3

Globally Unique Identifier (entire table): ba.freestatistics.org/blog/index.php?pk=285043&T=3

As an alternative you can also use a QR Code:  

The GUIDs for individual cells are displayed in the table below:

Multiple Linear Regression - Regression Statistics
Multiple R 0.9531
R-squared 0.9085
Adjusted R-squared 0.8978
F-TEST (value) 85.17
F-TEST (DF numerator)12
F-TEST (DF denominator)103
p-value 0
Multiple Linear Regression - Residual Statistics
Residual Standard Deviation 2.247
Sum Squared Residuals 520.1


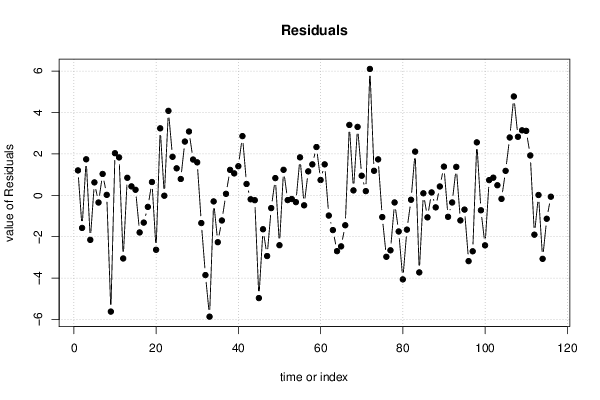
Multiple Linear Regression - Actuals, Interpolation, and Residuals
Time or IndexActualsInterpolationForecastResidualsPrediction Error
1-4-5.201 1.201
2-6-4.424-1.576
3-2-3.737 1.737
4-2 0.1519-2.152
5-2-2.623 0.6226
6-2-1.651-0.3488
7 2 0.9702 1.03
8 1 0.979 0.02101
9-8-2.384-5.616
10-1-3.03 2.03
11 1-0.8282 1.828
12-1 2.05-3.05
13 2 1.155 0.8454
14 2 1.57 0.4302
15 1 0.7338 0.2662
16-1 0.7934-1.793
17-2-0.6817-1.318
18-2-1.44-0.5599
19-1-1.641 0.6407
20-8-5.369-2.631
21-4-7.232 3.232
22-6-5.978-0.02169
23-3-7.076 4.076
24-3-4.858 1.858
25-7-8.301 1.301
26-9-9.787 0.7871
27-11-13.59 2.594
28-13-16.08 3.079
29-11-12.73 1.726
30-9-10.59 1.589
31-17-15.66-1.341
32-22-18.15-3.852
33-25-19.14-5.859
34-20-19.7-0.2959
35-24-21.73-2.266
36-24-22.78-1.216
37-22-22.07 0.06948
38-19-20.23 1.226
39-18-19.06 1.056
40-17-18.4 1.403
41-11-13.86 2.856
42-11-11.55 0.5459
43-12-11.81-0.1928
44-10-9.762-0.2376
45-15-10.04-4.963
46-15-13.36-1.639
47-15-12.07-2.933
48-13-12.38-0.6178
49-8-8.829 0.8294
50-13-10.59-2.41
51-9-10.23 1.23
52-7-6.768-0.2324
53-4-3.82-0.1799
54-4-3.67-0.3302
55-2-3.831 1.831
56 0 0.4851-0.4851
57-2-3.155 1.155
58-3-4.492 1.492
59 1-1.33 2.33
60-2-2.737 0.7373
61-1-2.492 1.492
62 1 1.979-0.9792
63-3-1.32-1.68
64-4-1.304-2.696
65-9-6.533-2.467
66-9-7.553-1.447
67-7-10.4 3.397
68-14-14.24 0.2362
69-12-15.3 3.301
70-16-16.94 0.9442
71-20-20.2 0.2008
72-12-18.1 6.099
73-12-13.18 1.183
74-10-11.73 1.733
75-10-8.948-1.052
76-13-10.03-2.969
77-16-13.34-2.657
78-14-13.65-0.3468
79-17-15.25-1.748
80-24-19.94-4.061
81-25-23.34-1.658
82-23-22.78-0.2155
83-17-19.11 2.108
84-24-20.28-3.723
85-20-20.1 0.09589
86-19-17.93-1.065
87-18-18.14 0.1378
88-16-15.42-0.5836
89-12-12.43 0.4251
90-7-8.384 1.384
91-6-4.96-1.04
92-6-5.652-0.3477
93-5-6.371 1.371
94-4-2.788-1.212
95-4-3.308-0.6919
96-8-4.821-3.179
97-9-6.296-2.704
98-6-8.555 2.555
99-7-6.276-0.7237
100-10-7.583-2.417
101-11-11.73 0.7327
102-11-11.85 0.8494
103-12-12.48 0.4844
104-14-13.83-0.1733
105-12-13.18 1.179
106-9-11.79 2.79
107-5-9.771 4.771
108-6-8.824 2.824
109-6-9.135 3.135
110-3-6.11 3.11
111-2-3.922 1.922
112-6-4.098-1.902
113-6-6.014 0.01423
114-10-6.932-3.068
115-8-6.867-1.133
116-4-3.931-0.06943

\begin{tabular}{lllllllll}
\hline
Multiple Linear Regression - Actuals, Interpolation, and Residuals \tabularnewline
Time or Index & Actuals & InterpolationForecast & ResidualsPrediction Error \tabularnewline
1 & -4 & -5.201 &  1.201 \tabularnewline
2 & -6 & -4.424 & -1.576 \tabularnewline
3 & -2 & -3.737 &  1.737 \tabularnewline
4 & -2 &  0.1519 & -2.152 \tabularnewline
5 & -2 & -2.623 &  0.6226 \tabularnewline
6 & -2 & -1.651 & -0.3488 \tabularnewline
7 &  2 &  0.9702 &  1.03 \tabularnewline
8 &  1 &  0.979 &  0.02101 \tabularnewline
9 & -8 & -2.384 & -5.616 \tabularnewline
10 & -1 & -3.03 &  2.03 \tabularnewline
11 &  1 & -0.8282 &  1.828 \tabularnewline
12 & -1 &  2.05 & -3.05 \tabularnewline
13 &  2 &  1.155 &  0.8454 \tabularnewline
14 &  2 &  1.57 &  0.4302 \tabularnewline
15 &  1 &  0.7338 &  0.2662 \tabularnewline
16 & -1 &  0.7934 & -1.793 \tabularnewline
17 & -2 & -0.6817 & -1.318 \tabularnewline
18 & -2 & -1.44 & -0.5599 \tabularnewline
19 & -1 & -1.641 &  0.6407 \tabularnewline
20 & -8 & -5.369 & -2.631 \tabularnewline
21 & -4 & -7.232 &  3.232 \tabularnewline
22 & -6 & -5.978 & -0.02169 \tabularnewline
23 & -3 & -7.076 &  4.076 \tabularnewline
24 & -3 & -4.858 &  1.858 \tabularnewline
25 & -7 & -8.301 &  1.301 \tabularnewline
26 & -9 & -9.787 &  0.7871 \tabularnewline
27 & -11 & -13.59 &  2.594 \tabularnewline
28 & -13 & -16.08 &  3.079 \tabularnewline
29 & -11 & -12.73 &  1.726 \tabularnewline
30 & -9 & -10.59 &  1.589 \tabularnewline
31 & -17 & -15.66 & -1.341 \tabularnewline
32 & -22 & -18.15 & -3.852 \tabularnewline
33 & -25 & -19.14 & -5.859 \tabularnewline
34 & -20 & -19.7 & -0.2959 \tabularnewline
35 & -24 & -21.73 & -2.266 \tabularnewline
36 & -24 & -22.78 & -1.216 \tabularnewline
37 & -22 & -22.07 &  0.06948 \tabularnewline
38 & -19 & -20.23 &  1.226 \tabularnewline
39 & -18 & -19.06 &  1.056 \tabularnewline
40 & -17 & -18.4 &  1.403 \tabularnewline
41 & -11 & -13.86 &  2.856 \tabularnewline
42 & -11 & -11.55 &  0.5459 \tabularnewline
43 & -12 & -11.81 & -0.1928 \tabularnewline
44 & -10 & -9.762 & -0.2376 \tabularnewline
45 & -15 & -10.04 & -4.963 \tabularnewline
46 & -15 & -13.36 & -1.639 \tabularnewline
47 & -15 & -12.07 & -2.933 \tabularnewline
48 & -13 & -12.38 & -0.6178 \tabularnewline
49 & -8 & -8.829 &  0.8294 \tabularnewline
50 & -13 & -10.59 & -2.41 \tabularnewline
51 & -9 & -10.23 &  1.23 \tabularnewline
52 & -7 & -6.768 & -0.2324 \tabularnewline
53 & -4 & -3.82 & -0.1799 \tabularnewline
54 & -4 & -3.67 & -0.3302 \tabularnewline
55 & -2 & -3.831 &  1.831 \tabularnewline
56 &  0 &  0.4851 & -0.4851 \tabularnewline
57 & -2 & -3.155 &  1.155 \tabularnewline
58 & -3 & -4.492 &  1.492 \tabularnewline
59 &  1 & -1.33 &  2.33 \tabularnewline
60 & -2 & -2.737 &  0.7373 \tabularnewline
61 & -1 & -2.492 &  1.492 \tabularnewline
62 &  1 &  1.979 & -0.9792 \tabularnewline
63 & -3 & -1.32 & -1.68 \tabularnewline
64 & -4 & -1.304 & -2.696 \tabularnewline
65 & -9 & -6.533 & -2.467 \tabularnewline
66 & -9 & -7.553 & -1.447 \tabularnewline
67 & -7 & -10.4 &  3.397 \tabularnewline
68 & -14 & -14.24 &  0.2362 \tabularnewline
69 & -12 & -15.3 &  3.301 \tabularnewline
70 & -16 & -16.94 &  0.9442 \tabularnewline
71 & -20 & -20.2 &  0.2008 \tabularnewline
72 & -12 & -18.1 &  6.099 \tabularnewline
73 & -12 & -13.18 &  1.183 \tabularnewline
74 & -10 & -11.73 &  1.733 \tabularnewline
75 & -10 & -8.948 & -1.052 \tabularnewline
76 & -13 & -10.03 & -2.969 \tabularnewline
77 & -16 & -13.34 & -2.657 \tabularnewline
78 & -14 & -13.65 & -0.3468 \tabularnewline
79 & -17 & -15.25 & -1.748 \tabularnewline
80 & -24 & -19.94 & -4.061 \tabularnewline
81 & -25 & -23.34 & -1.658 \tabularnewline
82 & -23 & -22.78 & -0.2155 \tabularnewline
83 & -17 & -19.11 &  2.108 \tabularnewline
84 & -24 & -20.28 & -3.723 \tabularnewline
85 & -20 & -20.1 &  0.09589 \tabularnewline
86 & -19 & -17.93 & -1.065 \tabularnewline
87 & -18 & -18.14 &  0.1378 \tabularnewline
88 & -16 & -15.42 & -0.5836 \tabularnewline
89 & -12 & -12.43 &  0.4251 \tabularnewline
90 & -7 & -8.384 &  1.384 \tabularnewline
91 & -6 & -4.96 & -1.04 \tabularnewline
92 & -6 & -5.652 & -0.3477 \tabularnewline
93 & -5 & -6.371 &  1.371 \tabularnewline
94 & -4 & -2.788 & -1.212 \tabularnewline
95 & -4 & -3.308 & -0.6919 \tabularnewline
96 & -8 & -4.821 & -3.179 \tabularnewline
97 & -9 & -6.296 & -2.704 \tabularnewline
98 & -6 & -8.555 &  2.555 \tabularnewline
99 & -7 & -6.276 & -0.7237 \tabularnewline
100 & -10 & -7.583 & -2.417 \tabularnewline
101 & -11 & -11.73 &  0.7327 \tabularnewline
102 & -11 & -11.85 &  0.8494 \tabularnewline
103 & -12 & -12.48 &  0.4844 \tabularnewline
104 & -14 & -13.83 & -0.1733 \tabularnewline
105 & -12 & -13.18 &  1.179 \tabularnewline
106 & -9 & -11.79 &  2.79 \tabularnewline
107 & -5 & -9.771 &  4.771 \tabularnewline
108 & -6 & -8.824 &  2.824 \tabularnewline
109 & -6 & -9.135 &  3.135 \tabularnewline
110 & -3 & -6.11 &  3.11 \tabularnewline
111 & -2 & -3.922 &  1.922 \tabularnewline
112 & -6 & -4.098 & -1.902 \tabularnewline
113 & -6 & -6.014 &  0.01423 \tabularnewline
114 & -10 & -6.932 & -3.068 \tabularnewline
115 & -8 & -6.867 & -1.133 \tabularnewline
116 & -4 & -3.931 & -0.06943 \tabularnewline
\hline
\end{tabular}
%Source: https://freestatistics.org/blog/index.php?pk=285043&T=4

[TABLE]
[ROW][C]Multiple Linear Regression - Actuals, Interpolation, and Residuals[/C][/ROW]
[ROW][C]Time or Index[/C][C]Actuals[/C][C]InterpolationForecast[/C][C]ResidualsPrediction Error[/C][/ROW]
[ROW][C]1[/C][C]-4[/C][C]-5.201[/C][C] 1.201[/C][/ROW]
[ROW][C]2[/C][C]-6[/C][C]-4.424[/C][C]-1.576[/C][/ROW]
[ROW][C]3[/C][C]-2[/C][C]-3.737[/C][C] 1.737[/C][/ROW]
[ROW][C]4[/C][C]-2[/C][C] 0.1519[/C][C]-2.152[/C][/ROW]
[ROW][C]5[/C][C]-2[/C][C]-2.623[/C][C] 0.6226[/C][/ROW]
[ROW][C]6[/C][C]-2[/C][C]-1.651[/C][C]-0.3488[/C][/ROW]
[ROW][C]7[/C][C] 2[/C][C] 0.9702[/C][C] 1.03[/C][/ROW]
[ROW][C]8[/C][C] 1[/C][C] 0.979[/C][C] 0.02101[/C][/ROW]
[ROW][C]9[/C][C]-8[/C][C]-2.384[/C][C]-5.616[/C][/ROW]
[ROW][C]10[/C][C]-1[/C][C]-3.03[/C][C] 2.03[/C][/ROW]
[ROW][C]11[/C][C] 1[/C][C]-0.8282[/C][C] 1.828[/C][/ROW]
[ROW][C]12[/C][C]-1[/C][C] 2.05[/C][C]-3.05[/C][/ROW]
[ROW][C]13[/C][C] 2[/C][C] 1.155[/C][C] 0.8454[/C][/ROW]
[ROW][C]14[/C][C] 2[/C][C] 1.57[/C][C] 0.4302[/C][/ROW]
[ROW][C]15[/C][C] 1[/C][C] 0.7338[/C][C] 0.2662[/C][/ROW]
[ROW][C]16[/C][C]-1[/C][C] 0.7934[/C][C]-1.793[/C][/ROW]
[ROW][C]17[/C][C]-2[/C][C]-0.6817[/C][C]-1.318[/C][/ROW]
[ROW][C]18[/C][C]-2[/C][C]-1.44[/C][C]-0.5599[/C][/ROW]
[ROW][C]19[/C][C]-1[/C][C]-1.641[/C][C] 0.6407[/C][/ROW]
[ROW][C]20[/C][C]-8[/C][C]-5.369[/C][C]-2.631[/C][/ROW]
[ROW][C]21[/C][C]-4[/C][C]-7.232[/C][C] 3.232[/C][/ROW]
[ROW][C]22[/C][C]-6[/C][C]-5.978[/C][C]-0.02169[/C][/ROW]
[ROW][C]23[/C][C]-3[/C][C]-7.076[/C][C] 4.076[/C][/ROW]
[ROW][C]24[/C][C]-3[/C][C]-4.858[/C][C] 1.858[/C][/ROW]
[ROW][C]25[/C][C]-7[/C][C]-8.301[/C][C] 1.301[/C][/ROW]
[ROW][C]26[/C][C]-9[/C][C]-9.787[/C][C] 0.7871[/C][/ROW]
[ROW][C]27[/C][C]-11[/C][C]-13.59[/C][C] 2.594[/C][/ROW]
[ROW][C]28[/C][C]-13[/C][C]-16.08[/C][C] 3.079[/C][/ROW]
[ROW][C]29[/C][C]-11[/C][C]-12.73[/C][C] 1.726[/C][/ROW]
[ROW][C]30[/C][C]-9[/C][C]-10.59[/C][C] 1.589[/C][/ROW]
[ROW][C]31[/C][C]-17[/C][C]-15.66[/C][C]-1.341[/C][/ROW]
[ROW][C]32[/C][C]-22[/C][C]-18.15[/C][C]-3.852[/C][/ROW]
[ROW][C]33[/C][C]-25[/C][C]-19.14[/C][C]-5.859[/C][/ROW]
[ROW][C]34[/C][C]-20[/C][C]-19.7[/C][C]-0.2959[/C][/ROW]
[ROW][C]35[/C][C]-24[/C][C]-21.73[/C][C]-2.266[/C][/ROW]
[ROW][C]36[/C][C]-24[/C][C]-22.78[/C][C]-1.216[/C][/ROW]
[ROW][C]37[/C][C]-22[/C][C]-22.07[/C][C] 0.06948[/C][/ROW]
[ROW][C]38[/C][C]-19[/C][C]-20.23[/C][C] 1.226[/C][/ROW]
[ROW][C]39[/C][C]-18[/C][C]-19.06[/C][C] 1.056[/C][/ROW]
[ROW][C]40[/C][C]-17[/C][C]-18.4[/C][C] 1.403[/C][/ROW]
[ROW][C]41[/C][C]-11[/C][C]-13.86[/C][C] 2.856[/C][/ROW]
[ROW][C]42[/C][C]-11[/C][C]-11.55[/C][C] 0.5459[/C][/ROW]
[ROW][C]43[/C][C]-12[/C][C]-11.81[/C][C]-0.1928[/C][/ROW]
[ROW][C]44[/C][C]-10[/C][C]-9.762[/C][C]-0.2376[/C][/ROW]
[ROW][C]45[/C][C]-15[/C][C]-10.04[/C][C]-4.963[/C][/ROW]
[ROW][C]46[/C][C]-15[/C][C]-13.36[/C][C]-1.639[/C][/ROW]
[ROW][C]47[/C][C]-15[/C][C]-12.07[/C][C]-2.933[/C][/ROW]
[ROW][C]48[/C][C]-13[/C][C]-12.38[/C][C]-0.6178[/C][/ROW]
[ROW][C]49[/C][C]-8[/C][C]-8.829[/C][C] 0.8294[/C][/ROW]
[ROW][C]50[/C][C]-13[/C][C]-10.59[/C][C]-2.41[/C][/ROW]
[ROW][C]51[/C][C]-9[/C][C]-10.23[/C][C] 1.23[/C][/ROW]
[ROW][C]52[/C][C]-7[/C][C]-6.768[/C][C]-0.2324[/C][/ROW]
[ROW][C]53[/C][C]-4[/C][C]-3.82[/C][C]-0.1799[/C][/ROW]
[ROW][C]54[/C][C]-4[/C][C]-3.67[/C][C]-0.3302[/C][/ROW]
[ROW][C]55[/C][C]-2[/C][C]-3.831[/C][C] 1.831[/C][/ROW]
[ROW][C]56[/C][C] 0[/C][C] 0.4851[/C][C]-0.4851[/C][/ROW]
[ROW][C]57[/C][C]-2[/C][C]-3.155[/C][C] 1.155[/C][/ROW]
[ROW][C]58[/C][C]-3[/C][C]-4.492[/C][C] 1.492[/C][/ROW]
[ROW][C]59[/C][C] 1[/C][C]-1.33[/C][C] 2.33[/C][/ROW]
[ROW][C]60[/C][C]-2[/C][C]-2.737[/C][C] 0.7373[/C][/ROW]
[ROW][C]61[/C][C]-1[/C][C]-2.492[/C][C] 1.492[/C][/ROW]
[ROW][C]62[/C][C] 1[/C][C] 1.979[/C][C]-0.9792[/C][/ROW]
[ROW][C]63[/C][C]-3[/C][C]-1.32[/C][C]-1.68[/C][/ROW]
[ROW][C]64[/C][C]-4[/C][C]-1.304[/C][C]-2.696[/C][/ROW]
[ROW][C]65[/C][C]-9[/C][C]-6.533[/C][C]-2.467[/C][/ROW]
[ROW][C]66[/C][C]-9[/C][C]-7.553[/C][C]-1.447[/C][/ROW]
[ROW][C]67[/C][C]-7[/C][C]-10.4[/C][C] 3.397[/C][/ROW]
[ROW][C]68[/C][C]-14[/C][C]-14.24[/C][C] 0.2362[/C][/ROW]
[ROW][C]69[/C][C]-12[/C][C]-15.3[/C][C] 3.301[/C][/ROW]
[ROW][C]70[/C][C]-16[/C][C]-16.94[/C][C] 0.9442[/C][/ROW]
[ROW][C]71[/C][C]-20[/C][C]-20.2[/C][C] 0.2008[/C][/ROW]
[ROW][C]72[/C][C]-12[/C][C]-18.1[/C][C] 6.099[/C][/ROW]
[ROW][C]73[/C][C]-12[/C][C]-13.18[/C][C] 1.183[/C][/ROW]
[ROW][C]74[/C][C]-10[/C][C]-11.73[/C][C] 1.733[/C][/ROW]
[ROW][C]75[/C][C]-10[/C][C]-8.948[/C][C]-1.052[/C][/ROW]
[ROW][C]76[/C][C]-13[/C][C]-10.03[/C][C]-2.969[/C][/ROW]
[ROW][C]77[/C][C]-16[/C][C]-13.34[/C][C]-2.657[/C][/ROW]
[ROW][C]78[/C][C]-14[/C][C]-13.65[/C][C]-0.3468[/C][/ROW]
[ROW][C]79[/C][C]-17[/C][C]-15.25[/C][C]-1.748[/C][/ROW]
[ROW][C]80[/C][C]-24[/C][C]-19.94[/C][C]-4.061[/C][/ROW]
[ROW][C]81[/C][C]-25[/C][C]-23.34[/C][C]-1.658[/C][/ROW]
[ROW][C]82[/C][C]-23[/C][C]-22.78[/C][C]-0.2155[/C][/ROW]
[ROW][C]83[/C][C]-17[/C][C]-19.11[/C][C] 2.108[/C][/ROW]
[ROW][C]84[/C][C]-24[/C][C]-20.28[/C][C]-3.723[/C][/ROW]
[ROW][C]85[/C][C]-20[/C][C]-20.1[/C][C] 0.09589[/C][/ROW]
[ROW][C]86[/C][C]-19[/C][C]-17.93[/C][C]-1.065[/C][/ROW]
[ROW][C]87[/C][C]-18[/C][C]-18.14[/C][C] 0.1378[/C][/ROW]
[ROW][C]88[/C][C]-16[/C][C]-15.42[/C][C]-0.5836[/C][/ROW]
[ROW][C]89[/C][C]-12[/C][C]-12.43[/C][C] 0.4251[/C][/ROW]
[ROW][C]90[/C][C]-7[/C][C]-8.384[/C][C] 1.384[/C][/ROW]
[ROW][C]91[/C][C]-6[/C][C]-4.96[/C][C]-1.04[/C][/ROW]
[ROW][C]92[/C][C]-6[/C][C]-5.652[/C][C]-0.3477[/C][/ROW]
[ROW][C]93[/C][C]-5[/C][C]-6.371[/C][C] 1.371[/C][/ROW]
[ROW][C]94[/C][C]-4[/C][C]-2.788[/C][C]-1.212[/C][/ROW]
[ROW][C]95[/C][C]-4[/C][C]-3.308[/C][C]-0.6919[/C][/ROW]
[ROW][C]96[/C][C]-8[/C][C]-4.821[/C][C]-3.179[/C][/ROW]
[ROW][C]97[/C][C]-9[/C][C]-6.296[/C][C]-2.704[/C][/ROW]
[ROW][C]98[/C][C]-6[/C][C]-8.555[/C][C] 2.555[/C][/ROW]
[ROW][C]99[/C][C]-7[/C][C]-6.276[/C][C]-0.7237[/C][/ROW]
[ROW][C]100[/C][C]-10[/C][C]-7.583[/C][C]-2.417[/C][/ROW]
[ROW][C]101[/C][C]-11[/C][C]-11.73[/C][C] 0.7327[/C][/ROW]
[ROW][C]102[/C][C]-11[/C][C]-11.85[/C][C] 0.8494[/C][/ROW]
[ROW][C]103[/C][C]-12[/C][C]-12.48[/C][C] 0.4844[/C][/ROW]
[ROW][C]104[/C][C]-14[/C][C]-13.83[/C][C]-0.1733[/C][/ROW]
[ROW][C]105[/C][C]-12[/C][C]-13.18[/C][C] 1.179[/C][/ROW]
[ROW][C]106[/C][C]-9[/C][C]-11.79[/C][C] 2.79[/C][/ROW]
[ROW][C]107[/C][C]-5[/C][C]-9.771[/C][C] 4.771[/C][/ROW]
[ROW][C]108[/C][C]-6[/C][C]-8.824[/C][C] 2.824[/C][/ROW]
[ROW][C]109[/C][C]-6[/C][C]-9.135[/C][C] 3.135[/C][/ROW]
[ROW][C]110[/C][C]-3[/C][C]-6.11[/C][C] 3.11[/C][/ROW]
[ROW][C]111[/C][C]-2[/C][C]-3.922[/C][C] 1.922[/C][/ROW]
[ROW][C]112[/C][C]-6[/C][C]-4.098[/C][C]-1.902[/C][/ROW]
[ROW][C]113[/C][C]-6[/C][C]-6.014[/C][C] 0.01423[/C][/ROW]
[ROW][C]114[/C][C]-10[/C][C]-6.932[/C][C]-3.068[/C][/ROW]
[ROW][C]115[/C][C]-8[/C][C]-6.867[/C][C]-1.133[/C][/ROW]
[ROW][C]116[/C][C]-4[/C][C]-3.931[/C][C]-0.06943[/C][/ROW]
[/TABLE]
Source: https://freestatistics.org/blog/index.php?pk=285043&T=4

Globally Unique Identifier (entire table): ba.freestatistics.org/blog/index.php?pk=285043&T=4

As an alternative you can also use a QR Code:  

The GUIDs for individual cells are displayed in the table below:

Multiple Linear Regression - Actuals, Interpolation, and Residuals
Time or IndexActualsInterpolationForecastResidualsPrediction Error
1-4-5.201 1.201
2-6-4.424-1.576
3-2-3.737 1.737
4-2 0.1519-2.152
5-2-2.623 0.6226
6-2-1.651-0.3488
7 2 0.9702 1.03
8 1 0.979 0.02101
9-8-2.384-5.616
10-1-3.03 2.03
11 1-0.8282 1.828
12-1 2.05-3.05
13 2 1.155 0.8454
14 2 1.57 0.4302
15 1 0.7338 0.2662
16-1 0.7934-1.793
17-2-0.6817-1.318
18-2-1.44-0.5599
19-1-1.641 0.6407
20-8-5.369-2.631
21-4-7.232 3.232
22-6-5.978-0.02169
23-3-7.076 4.076
24-3-4.858 1.858
25-7-8.301 1.301
26-9-9.787 0.7871
27-11-13.59 2.594
28-13-16.08 3.079
29-11-12.73 1.726
30-9-10.59 1.589
31-17-15.66-1.341
32-22-18.15-3.852
33-25-19.14-5.859
34-20-19.7-0.2959
35-24-21.73-2.266
36-24-22.78-1.216
37-22-22.07 0.06948
38-19-20.23 1.226
39-18-19.06 1.056
40-17-18.4 1.403
41-11-13.86 2.856
42-11-11.55 0.5459
43-12-11.81-0.1928
44-10-9.762-0.2376
45-15-10.04-4.963
46-15-13.36-1.639
47-15-12.07-2.933
48-13-12.38-0.6178
49-8-8.829 0.8294
50-13-10.59-2.41
51-9-10.23 1.23
52-7-6.768-0.2324
53-4-3.82-0.1799
54-4-3.67-0.3302
55-2-3.831 1.831
56 0 0.4851-0.4851
57-2-3.155 1.155
58-3-4.492 1.492
59 1-1.33 2.33
60-2-2.737 0.7373
61-1-2.492 1.492
62 1 1.979-0.9792
63-3-1.32-1.68
64-4-1.304-2.696
65-9-6.533-2.467
66-9-7.553-1.447
67-7-10.4 3.397
68-14-14.24 0.2362
69-12-15.3 3.301
70-16-16.94 0.9442
71-20-20.2 0.2008
72-12-18.1 6.099
73-12-13.18 1.183
74-10-11.73 1.733
75-10-8.948-1.052
76-13-10.03-2.969
77-16-13.34-2.657
78-14-13.65-0.3468
79-17-15.25-1.748
80-24-19.94-4.061
81-25-23.34-1.658
82-23-22.78-0.2155
83-17-19.11 2.108
84-24-20.28-3.723
85-20-20.1 0.09589
86-19-17.93-1.065
87-18-18.14 0.1378
88-16-15.42-0.5836
89-12-12.43 0.4251
90-7-8.384 1.384
91-6-4.96-1.04
92-6-5.652-0.3477
93-5-6.371 1.371
94-4-2.788-1.212
95-4-3.308-0.6919
96-8-4.821-3.179
97-9-6.296-2.704
98-6-8.555 2.555
99-7-6.276-0.7237
100-10-7.583-2.417
101-11-11.73 0.7327
102-11-11.85 0.8494
103-12-12.48 0.4844
104-14-13.83-0.1733
105-12-13.18 1.179
106-9-11.79 2.79
107-5-9.771 4.771
108-6-8.824 2.824
109-6-9.135 3.135
110-3-6.11 3.11
111-2-3.922 1.922
112-6-4.098-1.902
113-6-6.014 0.01423
114-10-6.932-3.068
115-8-6.867-1.133
116-4-3.931-0.06943


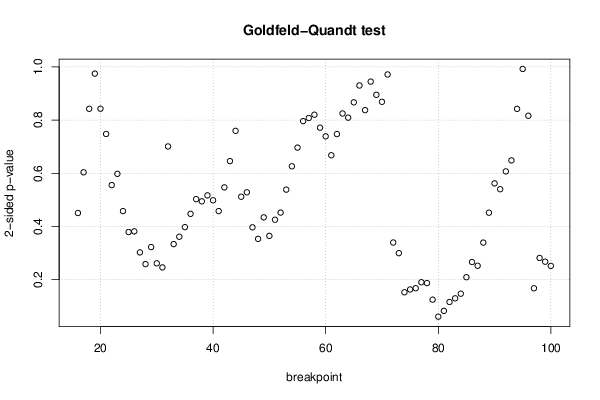
Goldfeld-Quandt test for Heteroskedasticity
p-valuesAlternative Hypothesis
breakpoint indexgreater2-sidedless
16 0.7747 0.4507 0.2253
17 0.6981 0.6038 0.3019
18 0.5787 0.8426 0.4213
19 0.5126 0.9748 0.4874
20 0.4215 0.8429 0.5785
21 0.3739 0.7478 0.6261
22 0.2778 0.5556 0.7222
23 0.299 0.5981 0.701
24 0.229 0.4579 0.771
25 0.1896 0.3792 0.8104
26 0.1909 0.3817 0.8091
27 0.1513 0.3026 0.8487
28 0.1292 0.2585 0.8708
29 0.1613 0.3226 0.8387
30 0.1307 0.2615 0.8693
31 0.1231 0.2461 0.8769
32 0.3505 0.7011 0.6495
33 0.8332 0.3337 0.1668
34 0.8193 0.3614 0.1807
35 0.8012 0.3976 0.1988
36 0.7762 0.4476 0.2238
37 0.7486 0.5027 0.2514
38 0.7527 0.4946 0.2473
39 0.7415 0.517 0.2585
40 0.7507 0.4986 0.2493
41 0.7711 0.4579 0.2289
42 0.7265 0.5471 0.2735
43 0.6771 0.6459 0.3229
44 0.6202 0.7597 0.3798
45 0.7441 0.5118 0.2559
46 0.7357 0.5286 0.2643
47 0.8016 0.3968 0.1984
48 0.8233 0.3534 0.1767
49 0.7828 0.4344 0.2172
50 0.8177 0.3647 0.1823
51 0.7873 0.4254 0.2127
52 0.7739 0.4523 0.2261
53 0.7307 0.5386 0.2693
54 0.6868 0.6264 0.3132
55 0.6517 0.6967 0.3483
56 0.6019 0.7962 0.3981
57 0.5961 0.8079 0.4039
58 0.5898 0.8204 0.4102
59 0.6142 0.7715 0.3858
60 0.6305 0.739 0.3695
61 0.6661 0.6679 0.3339
62 0.6263 0.7475 0.3737
63 0.5876 0.8249 0.4124
64 0.5954 0.8092 0.4046
65 0.5665 0.8669 0.4335
66 0.5349 0.9302 0.4651
67 0.5812 0.8377 0.4188
68 0.5276 0.9449 0.4724
69 0.5524 0.8952 0.4476
70 0.5656 0.8688 0.4344
71 0.5141 0.9717 0.4859
72 0.8301 0.3397 0.1699
73 0.8502 0.2996 0.1498
74 0.9237 0.1526 0.07631
75 0.9185 0.163 0.08151
76 0.9161 0.1678 0.08392
77 0.9048 0.1903 0.09517
78 0.9064 0.1872 0.09358
79 0.9376 0.1248 0.06242
80 0.9696 0.06088 0.03044
81 0.9587 0.08264 0.04132
82 0.942 0.1161 0.05803
83 0.9351 0.1298 0.06489
84 0.9264 0.1472 0.07359
85 0.8954 0.2092 0.1046
86 0.8668 0.2664 0.1332
87 0.8739 0.2522 0.1261
88 0.8303 0.3394 0.1697
89 0.7741 0.4518 0.2259
90 0.719 0.5621 0.281
91 0.7299 0.5401 0.2701
92 0.6964 0.6072 0.3036
93 0.6757 0.6485 0.3243
94 0.5788 0.8423 0.4212
95 0.4962 0.9924 0.5038
96 0.5918 0.8164 0.4082
97 0.9162 0.1676 0.0838
98 0.8592 0.2816 0.1408
99 0.8663 0.2674 0.1337
100 0.8742 0.2516 0.1258

\begin{tabular}{lllllllll}
\hline
Goldfeld-Quandt test for Heteroskedasticity \tabularnewline
p-values & Alternative Hypothesis \tabularnewline
breakpoint index & greater & 2-sided & less \tabularnewline
16 &  0.7747 &  0.4507 &  0.2253 \tabularnewline
17 &  0.6981 &  0.6038 &  0.3019 \tabularnewline
18 &  0.5787 &  0.8426 &  0.4213 \tabularnewline
19 &  0.5126 &  0.9748 &  0.4874 \tabularnewline
20 &  0.4215 &  0.8429 &  0.5785 \tabularnewline
21 &  0.3739 &  0.7478 &  0.6261 \tabularnewline
22 &  0.2778 &  0.5556 &  0.7222 \tabularnewline
23 &  0.299 &  0.5981 &  0.701 \tabularnewline
24 &  0.229 &  0.4579 &  0.771 \tabularnewline
25 &  0.1896 &  0.3792 &  0.8104 \tabularnewline
26 &  0.1909 &  0.3817 &  0.8091 \tabularnewline
27 &  0.1513 &  0.3026 &  0.8487 \tabularnewline
28 &  0.1292 &  0.2585 &  0.8708 \tabularnewline
29 &  0.1613 &  0.3226 &  0.8387 \tabularnewline
30 &  0.1307 &  0.2615 &  0.8693 \tabularnewline
31 &  0.1231 &  0.2461 &  0.8769 \tabularnewline
32 &  0.3505 &  0.7011 &  0.6495 \tabularnewline
33 &  0.8332 &  0.3337 &  0.1668 \tabularnewline
34 &  0.8193 &  0.3614 &  0.1807 \tabularnewline
35 &  0.8012 &  0.3976 &  0.1988 \tabularnewline
36 &  0.7762 &  0.4476 &  0.2238 \tabularnewline
37 &  0.7486 &  0.5027 &  0.2514 \tabularnewline
38 &  0.7527 &  0.4946 &  0.2473 \tabularnewline
39 &  0.7415 &  0.517 &  0.2585 \tabularnewline
40 &  0.7507 &  0.4986 &  0.2493 \tabularnewline
41 &  0.7711 &  0.4579 &  0.2289 \tabularnewline
42 &  0.7265 &  0.5471 &  0.2735 \tabularnewline
43 &  0.6771 &  0.6459 &  0.3229 \tabularnewline
44 &  0.6202 &  0.7597 &  0.3798 \tabularnewline
45 &  0.7441 &  0.5118 &  0.2559 \tabularnewline
46 &  0.7357 &  0.5286 &  0.2643 \tabularnewline
47 &  0.8016 &  0.3968 &  0.1984 \tabularnewline
48 &  0.8233 &  0.3534 &  0.1767 \tabularnewline
49 &  0.7828 &  0.4344 &  0.2172 \tabularnewline
50 &  0.8177 &  0.3647 &  0.1823 \tabularnewline
51 &  0.7873 &  0.4254 &  0.2127 \tabularnewline
52 &  0.7739 &  0.4523 &  0.2261 \tabularnewline
53 &  0.7307 &  0.5386 &  0.2693 \tabularnewline
54 &  0.6868 &  0.6264 &  0.3132 \tabularnewline
55 &  0.6517 &  0.6967 &  0.3483 \tabularnewline
56 &  0.6019 &  0.7962 &  0.3981 \tabularnewline
57 &  0.5961 &  0.8079 &  0.4039 \tabularnewline
58 &  0.5898 &  0.8204 &  0.4102 \tabularnewline
59 &  0.6142 &  0.7715 &  0.3858 \tabularnewline
60 &  0.6305 &  0.739 &  0.3695 \tabularnewline
61 &  0.6661 &  0.6679 &  0.3339 \tabularnewline
62 &  0.6263 &  0.7475 &  0.3737 \tabularnewline
63 &  0.5876 &  0.8249 &  0.4124 \tabularnewline
64 &  0.5954 &  0.8092 &  0.4046 \tabularnewline
65 &  0.5665 &  0.8669 &  0.4335 \tabularnewline
66 &  0.5349 &  0.9302 &  0.4651 \tabularnewline
67 &  0.5812 &  0.8377 &  0.4188 \tabularnewline
68 &  0.5276 &  0.9449 &  0.4724 \tabularnewline
69 &  0.5524 &  0.8952 &  0.4476 \tabularnewline
70 &  0.5656 &  0.8688 &  0.4344 \tabularnewline
71 &  0.5141 &  0.9717 &  0.4859 \tabularnewline
72 &  0.8301 &  0.3397 &  0.1699 \tabularnewline
73 &  0.8502 &  0.2996 &  0.1498 \tabularnewline
74 &  0.9237 &  0.1526 &  0.07631 \tabularnewline
75 &  0.9185 &  0.163 &  0.08151 \tabularnewline
76 &  0.9161 &  0.1678 &  0.08392 \tabularnewline
77 &  0.9048 &  0.1903 &  0.09517 \tabularnewline
78 &  0.9064 &  0.1872 &  0.09358 \tabularnewline
79 &  0.9376 &  0.1248 &  0.06242 \tabularnewline
80 &  0.9696 &  0.06088 &  0.03044 \tabularnewline
81 &  0.9587 &  0.08264 &  0.04132 \tabularnewline
82 &  0.942 &  0.1161 &  0.05803 \tabularnewline
83 &  0.9351 &  0.1298 &  0.06489 \tabularnewline
84 &  0.9264 &  0.1472 &  0.07359 \tabularnewline
85 &  0.8954 &  0.2092 &  0.1046 \tabularnewline
86 &  0.8668 &  0.2664 &  0.1332 \tabularnewline
87 &  0.8739 &  0.2522 &  0.1261 \tabularnewline
88 &  0.8303 &  0.3394 &  0.1697 \tabularnewline
89 &  0.7741 &  0.4518 &  0.2259 \tabularnewline
90 &  0.719 &  0.5621 &  0.281 \tabularnewline
91 &  0.7299 &  0.5401 &  0.2701 \tabularnewline
92 &  0.6964 &  0.6072 &  0.3036 \tabularnewline
93 &  0.6757 &  0.6485 &  0.3243 \tabularnewline
94 &  0.5788 &  0.8423 &  0.4212 \tabularnewline
95 &  0.4962 &  0.9924 &  0.5038 \tabularnewline
96 &  0.5918 &  0.8164 &  0.4082 \tabularnewline
97 &  0.9162 &  0.1676 &  0.0838 \tabularnewline
98 &  0.8592 &  0.2816 &  0.1408 \tabularnewline
99 &  0.8663 &  0.2674 &  0.1337 \tabularnewline
100 &  0.8742 &  0.2516 &  0.1258 \tabularnewline
\hline
\end{tabular}
%Source: https://freestatistics.org/blog/index.php?pk=285043&T=5

[TABLE]
[ROW][C]Goldfeld-Quandt test for Heteroskedasticity[/C][/ROW]
[ROW][C]p-values[/C][C]Alternative Hypothesis[/C][/ROW]
[ROW][C]breakpoint index[/C][C]greater[/C][C]2-sided[/C][C]less[/C][/ROW]
[ROW][C]16[/C][C] 0.7747[/C][C] 0.4507[/C][C] 0.2253[/C][/ROW]
[ROW][C]17[/C][C] 0.6981[/C][C] 0.6038[/C][C] 0.3019[/C][/ROW]
[ROW][C]18[/C][C] 0.5787[/C][C] 0.8426[/C][C] 0.4213[/C][/ROW]
[ROW][C]19[/C][C] 0.5126[/C][C] 0.9748[/C][C] 0.4874[/C][/ROW]
[ROW][C]20[/C][C] 0.4215[/C][C] 0.8429[/C][C] 0.5785[/C][/ROW]
[ROW][C]21[/C][C] 0.3739[/C][C] 0.7478[/C][C] 0.6261[/C][/ROW]
[ROW][C]22[/C][C] 0.2778[/C][C] 0.5556[/C][C] 0.7222[/C][/ROW]
[ROW][C]23[/C][C] 0.299[/C][C] 0.5981[/C][C] 0.701[/C][/ROW]
[ROW][C]24[/C][C] 0.229[/C][C] 0.4579[/C][C] 0.771[/C][/ROW]
[ROW][C]25[/C][C] 0.1896[/C][C] 0.3792[/C][C] 0.8104[/C][/ROW]
[ROW][C]26[/C][C] 0.1909[/C][C] 0.3817[/C][C] 0.8091[/C][/ROW]
[ROW][C]27[/C][C] 0.1513[/C][C] 0.3026[/C][C] 0.8487[/C][/ROW]
[ROW][C]28[/C][C] 0.1292[/C][C] 0.2585[/C][C] 0.8708[/C][/ROW]
[ROW][C]29[/C][C] 0.1613[/C][C] 0.3226[/C][C] 0.8387[/C][/ROW]
[ROW][C]30[/C][C] 0.1307[/C][C] 0.2615[/C][C] 0.8693[/C][/ROW]
[ROW][C]31[/C][C] 0.1231[/C][C] 0.2461[/C][C] 0.8769[/C][/ROW]
[ROW][C]32[/C][C] 0.3505[/C][C] 0.7011[/C][C] 0.6495[/C][/ROW]
[ROW][C]33[/C][C] 0.8332[/C][C] 0.3337[/C][C] 0.1668[/C][/ROW]
[ROW][C]34[/C][C] 0.8193[/C][C] 0.3614[/C][C] 0.1807[/C][/ROW]
[ROW][C]35[/C][C] 0.8012[/C][C] 0.3976[/C][C] 0.1988[/C][/ROW]
[ROW][C]36[/C][C] 0.7762[/C][C] 0.4476[/C][C] 0.2238[/C][/ROW]
[ROW][C]37[/C][C] 0.7486[/C][C] 0.5027[/C][C] 0.2514[/C][/ROW]
[ROW][C]38[/C][C] 0.7527[/C][C] 0.4946[/C][C] 0.2473[/C][/ROW]
[ROW][C]39[/C][C] 0.7415[/C][C] 0.517[/C][C] 0.2585[/C][/ROW]
[ROW][C]40[/C][C] 0.7507[/C][C] 0.4986[/C][C] 0.2493[/C][/ROW]
[ROW][C]41[/C][C] 0.7711[/C][C] 0.4579[/C][C] 0.2289[/C][/ROW]
[ROW][C]42[/C][C] 0.7265[/C][C] 0.5471[/C][C] 0.2735[/C][/ROW]
[ROW][C]43[/C][C] 0.6771[/C][C] 0.6459[/C][C] 0.3229[/C][/ROW]
[ROW][C]44[/C][C] 0.6202[/C][C] 0.7597[/C][C] 0.3798[/C][/ROW]
[ROW][C]45[/C][C] 0.7441[/C][C] 0.5118[/C][C] 0.2559[/C][/ROW]
[ROW][C]46[/C][C] 0.7357[/C][C] 0.5286[/C][C] 0.2643[/C][/ROW]
[ROW][C]47[/C][C] 0.8016[/C][C] 0.3968[/C][C] 0.1984[/C][/ROW]
[ROW][C]48[/C][C] 0.8233[/C][C] 0.3534[/C][C] 0.1767[/C][/ROW]
[ROW][C]49[/C][C] 0.7828[/C][C] 0.4344[/C][C] 0.2172[/C][/ROW]
[ROW][C]50[/C][C] 0.8177[/C][C] 0.3647[/C][C] 0.1823[/C][/ROW]
[ROW][C]51[/C][C] 0.7873[/C][C] 0.4254[/C][C] 0.2127[/C][/ROW]
[ROW][C]52[/C][C] 0.7739[/C][C] 0.4523[/C][C] 0.2261[/C][/ROW]
[ROW][C]53[/C][C] 0.7307[/C][C] 0.5386[/C][C] 0.2693[/C][/ROW]
[ROW][C]54[/C][C] 0.6868[/C][C] 0.6264[/C][C] 0.3132[/C][/ROW]
[ROW][C]55[/C][C] 0.6517[/C][C] 0.6967[/C][C] 0.3483[/C][/ROW]
[ROW][C]56[/C][C] 0.6019[/C][C] 0.7962[/C][C] 0.3981[/C][/ROW]
[ROW][C]57[/C][C] 0.5961[/C][C] 0.8079[/C][C] 0.4039[/C][/ROW]
[ROW][C]58[/C][C] 0.5898[/C][C] 0.8204[/C][C] 0.4102[/C][/ROW]
[ROW][C]59[/C][C] 0.6142[/C][C] 0.7715[/C][C] 0.3858[/C][/ROW]
[ROW][C]60[/C][C] 0.6305[/C][C] 0.739[/C][C] 0.3695[/C][/ROW]
[ROW][C]61[/C][C] 0.6661[/C][C] 0.6679[/C][C] 0.3339[/C][/ROW]
[ROW][C]62[/C][C] 0.6263[/C][C] 0.7475[/C][C] 0.3737[/C][/ROW]
[ROW][C]63[/C][C] 0.5876[/C][C] 0.8249[/C][C] 0.4124[/C][/ROW]
[ROW][C]64[/C][C] 0.5954[/C][C] 0.8092[/C][C] 0.4046[/C][/ROW]
[ROW][C]65[/C][C] 0.5665[/C][C] 0.8669[/C][C] 0.4335[/C][/ROW]
[ROW][C]66[/C][C] 0.5349[/C][C] 0.9302[/C][C] 0.4651[/C][/ROW]
[ROW][C]67[/C][C] 0.5812[/C][C] 0.8377[/C][C] 0.4188[/C][/ROW]
[ROW][C]68[/C][C] 0.5276[/C][C] 0.9449[/C][C] 0.4724[/C][/ROW]
[ROW][C]69[/C][C] 0.5524[/C][C] 0.8952[/C][C] 0.4476[/C][/ROW]
[ROW][C]70[/C][C] 0.5656[/C][C] 0.8688[/C][C] 0.4344[/C][/ROW]
[ROW][C]71[/C][C] 0.5141[/C][C] 0.9717[/C][C] 0.4859[/C][/ROW]
[ROW][C]72[/C][C] 0.8301[/C][C] 0.3397[/C][C] 0.1699[/C][/ROW]
[ROW][C]73[/C][C] 0.8502[/C][C] 0.2996[/C][C] 0.1498[/C][/ROW]
[ROW][C]74[/C][C] 0.9237[/C][C] 0.1526[/C][C] 0.07631[/C][/ROW]
[ROW][C]75[/C][C] 0.9185[/C][C] 0.163[/C][C] 0.08151[/C][/ROW]
[ROW][C]76[/C][C] 0.9161[/C][C] 0.1678[/C][C] 0.08392[/C][/ROW]
[ROW][C]77[/C][C] 0.9048[/C][C] 0.1903[/C][C] 0.09517[/C][/ROW]
[ROW][C]78[/C][C] 0.9064[/C][C] 0.1872[/C][C] 0.09358[/C][/ROW]
[ROW][C]79[/C][C] 0.9376[/C][C] 0.1248[/C][C] 0.06242[/C][/ROW]
[ROW][C]80[/C][C] 0.9696[/C][C] 0.06088[/C][C] 0.03044[/C][/ROW]
[ROW][C]81[/C][C] 0.9587[/C][C] 0.08264[/C][C] 0.04132[/C][/ROW]
[ROW][C]82[/C][C] 0.942[/C][C] 0.1161[/C][C] 0.05803[/C][/ROW]
[ROW][C]83[/C][C] 0.9351[/C][C] 0.1298[/C][C] 0.06489[/C][/ROW]
[ROW][C]84[/C][C] 0.9264[/C][C] 0.1472[/C][C] 0.07359[/C][/ROW]
[ROW][C]85[/C][C] 0.8954[/C][C] 0.2092[/C][C] 0.1046[/C][/ROW]
[ROW][C]86[/C][C] 0.8668[/C][C] 0.2664[/C][C] 0.1332[/C][/ROW]
[ROW][C]87[/C][C] 0.8739[/C][C] 0.2522[/C][C] 0.1261[/C][/ROW]
[ROW][C]88[/C][C] 0.8303[/C][C] 0.3394[/C][C] 0.1697[/C][/ROW]
[ROW][C]89[/C][C] 0.7741[/C][C] 0.4518[/C][C] 0.2259[/C][/ROW]
[ROW][C]90[/C][C] 0.719[/C][C] 0.5621[/C][C] 0.281[/C][/ROW]
[ROW][C]91[/C][C] 0.7299[/C][C] 0.5401[/C][C] 0.2701[/C][/ROW]
[ROW][C]92[/C][C] 0.6964[/C][C] 0.6072[/C][C] 0.3036[/C][/ROW]
[ROW][C]93[/C][C] 0.6757[/C][C] 0.6485[/C][C] 0.3243[/C][/ROW]
[ROW][C]94[/C][C] 0.5788[/C][C] 0.8423[/C][C] 0.4212[/C][/ROW]
[ROW][C]95[/C][C] 0.4962[/C][C] 0.9924[/C][C] 0.5038[/C][/ROW]
[ROW][C]96[/C][C] 0.5918[/C][C] 0.8164[/C][C] 0.4082[/C][/ROW]
[ROW][C]97[/C][C] 0.9162[/C][C] 0.1676[/C][C] 0.0838[/C][/ROW]
[ROW][C]98[/C][C] 0.8592[/C][C] 0.2816[/C][C] 0.1408[/C][/ROW]
[ROW][C]99[/C][C] 0.8663[/C][C] 0.2674[/C][C] 0.1337[/C][/ROW]
[ROW][C]100[/C][C] 0.8742[/C][C] 0.2516[/C][C] 0.1258[/C][/ROW]
[/TABLE]
Source: https://freestatistics.org/blog/index.php?pk=285043&T=5

Globally Unique Identifier (entire table): ba.freestatistics.org/blog/index.php?pk=285043&T=5

As an alternative you can also use a QR Code:  

The GUIDs for individual cells are displayed in the table below:

Goldfeld-Quandt test for Heteroskedasticity
p-valuesAlternative Hypothesis
breakpoint indexgreater2-sidedless
16 0.7747 0.4507 0.2253
17 0.6981 0.6038 0.3019
18 0.5787 0.8426 0.4213
19 0.5126 0.9748 0.4874
20 0.4215 0.8429 0.5785
21 0.3739 0.7478 0.6261
22 0.2778 0.5556 0.7222
23 0.299 0.5981 0.701
24 0.229 0.4579 0.771
25 0.1896 0.3792 0.8104
26 0.1909 0.3817 0.8091
27 0.1513 0.3026 0.8487
28 0.1292 0.2585 0.8708
29 0.1613 0.3226 0.8387
30 0.1307 0.2615 0.8693
31 0.1231 0.2461 0.8769
32 0.3505 0.7011 0.6495
33 0.8332 0.3337 0.1668
34 0.8193 0.3614 0.1807
35 0.8012 0.3976 0.1988
36 0.7762 0.4476 0.2238
37 0.7486 0.5027 0.2514
38 0.7527 0.4946 0.2473
39 0.7415 0.517 0.2585
40 0.7507 0.4986 0.2493
41 0.7711 0.4579 0.2289
42 0.7265 0.5471 0.2735
43 0.6771 0.6459 0.3229
44 0.6202 0.7597 0.3798
45 0.7441 0.5118 0.2559
46 0.7357 0.5286 0.2643
47 0.8016 0.3968 0.1984
48 0.8233 0.3534 0.1767
49 0.7828 0.4344 0.2172
50 0.8177 0.3647 0.1823
51 0.7873 0.4254 0.2127
52 0.7739 0.4523 0.2261
53 0.7307 0.5386 0.2693
54 0.6868 0.6264 0.3132
55 0.6517 0.6967 0.3483
56 0.6019 0.7962 0.3981
57 0.5961 0.8079 0.4039
58 0.5898 0.8204 0.4102
59 0.6142 0.7715 0.3858
60 0.6305 0.739 0.3695
61 0.6661 0.6679 0.3339
62 0.6263 0.7475 0.3737
63 0.5876 0.8249 0.4124
64 0.5954 0.8092 0.4046
65 0.5665 0.8669 0.4335
66 0.5349 0.9302 0.4651
67 0.5812 0.8377 0.4188
68 0.5276 0.9449 0.4724
69 0.5524 0.8952 0.4476
70 0.5656 0.8688 0.4344
71 0.5141 0.9717 0.4859
72 0.8301 0.3397 0.1699
73 0.8502 0.2996 0.1498
74 0.9237 0.1526 0.07631
75 0.9185 0.163 0.08151
76 0.9161 0.1678 0.08392
77 0.9048 0.1903 0.09517
78 0.9064 0.1872 0.09358
79 0.9376 0.1248 0.06242
80 0.9696 0.06088 0.03044
81 0.9587 0.08264 0.04132
82 0.942 0.1161 0.05803
83 0.9351 0.1298 0.06489
84 0.9264 0.1472 0.07359
85 0.8954 0.2092 0.1046
86 0.8668 0.2664 0.1332
87 0.8739 0.2522 0.1261
88 0.8303 0.3394 0.1697
89 0.7741 0.4518 0.2259
90 0.719 0.5621 0.281
91 0.7299 0.5401 0.2701
92 0.6964 0.6072 0.3036
93 0.6757 0.6485 0.3243
94 0.5788 0.8423 0.4212
95 0.4962 0.9924 0.5038
96 0.5918 0.8164 0.4082
97 0.9162 0.1676 0.0838
98 0.8592 0.2816 0.1408
99 0.8663 0.2674 0.1337
100 0.8742 0.2516 0.1258


Meta Analysis of Goldfeld-Quandt test for Heteroskedasticity
Description# significant tests% significant testsOK/NOK
1% type I error level0 0OK
5% type I error level00OK
10% type I error level20.0235294OK

\begin{tabular}{lllllllll}
\hline
Meta Analysis of Goldfeld-Quandt test for Heteroskedasticity \tabularnewline
Description & # significant tests & % significant tests & OK/NOK \tabularnewline
1% type I error level & 0 &  0 & OK \tabularnewline
5% type I error level & 0 & 0 & OK \tabularnewline
10% type I error level & 2 & 0.0235294 & OK \tabularnewline
\hline
\end{tabular}
%Source: https://freestatistics.org/blog/index.php?pk=285043&T=6

[TABLE]
[ROW][C]Meta Analysis of Goldfeld-Quandt test for Heteroskedasticity[/C][/ROW]
[ROW][C]Description[/C][C]# significant tests[/C][C]% significant tests[/C][C]OK/NOK[/C][/ROW]
[ROW][C]1% type I error level[/C][C]0[/C][C] 0[/C][C]OK[/C][/ROW]
[ROW][C]5% type I error level[/C][C]0[/C][C]0[/C][C]OK[/C][/ROW]
[ROW][C]10% type I error level[/C][C]2[/C][C]0.0235294[/C][C]OK[/C][/ROW]
[/TABLE]
Source: https://freestatistics.org/blog/index.php?pk=285043&T=6

Globally Unique Identifier (entire table): ba.freestatistics.org/blog/index.php?pk=285043&T=6

As an alternative you can also use a QR Code:  

The GUIDs for individual cells are displayed in the table below:

Meta Analysis of Goldfeld-Quandt test for Heteroskedasticity
Description# significant tests% significant testsOK/NOK
1% type I error level0 0OK
5% type I error level00OK
10% type I error level20.0235294OK


Parameters (Session):
par1 = 1 ; par2 = Do not include Seasonal Dummies ; par3 = No Linear Trend ; par4 = 0 ; par5 = 0 ;
Parameters (R input):
par1 = 1 ; par2 = Do not include Seasonal Dummies ; par3 = No Linear Trend ; par4 = 4 ; par5 = 0 ;
R code (references can be found in the software module):
par5 <- '0'
par4 <- '0'
par3 <- 'No Linear Trend'
par2 <- 'Do not include Seasonal Dummies'
par1 <- '1'
library(lattice)
library(lmtest)
n25 <- 25 #minimum number of obs. for Goldfeld-Quandt test
mywarning <- ''
par1 <- as.numeric(par1)
if(is.na(par1)) {
par1 <- 1
mywarning = 'Warning: you did not specify the column number of the endogenous series! The first column was selected by default.'
}
if (par4=='') par4 <- 0
par4 <- as.numeric(par4)
if (par5=='') par5 <- 0
par5 <- as.numeric(par5)
x <- na.omit(t(y))
k <- length(x[1,])
n <- length(x[,1])
x1 <- cbind(x[,par1], x[,1:k!=par1])
mycolnames <- c(colnames(x)[par1], colnames(x)[1:k!=par1])
colnames(x1) <- mycolnames #colnames(x)[par1]
x <- x1
if (par3 == 'First Differences'){
x2 <- array(0, dim=c(n-1,k), dimnames=list(1:(n-1), paste('(1-B)',colnames(x),sep='')))
for (i in 1:n-1) {
for (j in 1:k) {
x2[i,j] <- x[i+1,j] - x[i,j]
}
}
x <- x2
}
if(par4 > 0) {
x2 <- array(0, dim=c(n-par4,par4), dimnames=list(1:(n-par4), paste(colnames(x)[par1],'(t-',1:par4,')',sep='')))
for (i in 1:(n-par4)) {
for (j in 1:par4) {
x2[i,j] <- x[i+par4-j,par1]
}
}
x <- cbind(x[(par4+1):n,], x2)
n <- n - par4
}
if (par2 == 'Include Monthly Dummies'){
x2 <- array(0, dim=c(n,11), dimnames=list(1:n, paste('M', seq(1:11), sep ='')))
for (i in 1:11){
x2[seq(i,n,12),i] <- 1
}
x <- cbind(x, x2)
}
if (par2 == 'Include Quarterly Dummies'){
x2 <- array(0, dim=c(n,3), dimnames=list(1:n, paste('Q', seq(1:3), sep ='')))
for (i in 1:3){
x2[seq(i,n,4),i] <- 1
}
x <- cbind(x, x2)
}
k <- length(x[1+par4,])
if (par3 == 'Linear Trend'){
x <- cbind(x, c(1:n))
colnames(x)[k+1] <- 't'
}
x
k <- length(x[1+par4,])
df <- as.data.frame(x)
(mylm <- lm(df))
(mysum <- summary(mylm))
if (n > n25) {
kp3 <- k + 3
nmkm3 <- n - k - 3
gqarr <- array(NA, dim=c(nmkm3-kp3+1,3))
numgqtests <- 0
numsignificant1 <- 0
numsignificant5 <- 0
numsignificant10 <- 0
for (mypoint in kp3:nmkm3) {
j <- 0
numgqtests <- numgqtests + 1
for (myalt in c('greater', 'two.sided', 'less')) {
j <- j + 1
gqarr[mypoint-kp3+1,j] <- gqtest(mylm, point=mypoint, alternative=myalt)$p.value
}
if (gqarr[mypoint-kp3+1,2] < 0.01) numsignificant1 <- numsignificant1 + 1
if (gqarr[mypoint-kp3+1,2] < 0.05) numsignificant5 <- numsignificant5 + 1
if (gqarr[mypoint-kp3+1,2] < 0.10) numsignificant10 <- numsignificant10 + 1
}
gqarr
}
bitmap(file='test0.png')
plot(x[,1], type='l', main='Actuals and Interpolation', ylab='value of Actuals and Interpolation (dots)', xlab='time or index')
points(x[,1]-mysum$resid)
grid()
dev.off()
bitmap(file='test1.png')
plot(mysum$resid, type='b', pch=19, main='Residuals', ylab='value of Residuals', xlab='time or index')
grid()
dev.off()
bitmap(file='test2.png')
hist(mysum$resid, main='Residual Histogram', xlab='values of Residuals')
grid()
dev.off()
bitmap(file='test3.png')
densityplot(~mysum$resid,col='black',main='Residual Density Plot', xlab='values of Residuals')
dev.off()
bitmap(file='test4.png')
qqnorm(mysum$resid, main='Residual Normal Q-Q Plot')
qqline(mysum$resid)
grid()
dev.off()
(myerror <- as.ts(mysum$resid))
bitmap(file='test5.png')
dum <- cbind(lag(myerror,k=1),myerror)
dum
dum1 <- dum[2:length(myerror),]
dum1
z <- as.data.frame(dum1)
z
plot(z,main=paste('Residual Lag plot, lowess, and regression line'), ylab='values of Residuals', xlab='lagged values of Residuals')
lines(lowess(z))
abline(lm(z))
grid()
dev.off()
bitmap(file='test6.png')
acf(mysum$resid, lag.max=length(mysum$resid)/2, main='Residual Autocorrelation Function')
grid()
dev.off()
bitmap(file='test7.png')
pacf(mysum$resid, lag.max=length(mysum$resid)/2, main='Residual Partial Autocorrelation Function')
grid()
dev.off()
bitmap(file='test8.png')
opar <- par(mfrow = c(2,2), oma = c(0, 0, 1.1, 0))
plot(mylm, las = 1, sub='Residual Diagnostics')
par(opar)
dev.off()
if (n > n25) {
bitmap(file='test9.png')
plot(kp3:nmkm3,gqarr[,2], main='Goldfeld-Quandt test',ylab='2-sided p-value',xlab='breakpoint')
grid()
dev.off()
}
load(file='createtable')
a<-table.start()
a<-table.row.start(a)
a<-table.element(a, 'Multiple Linear Regression - Estimated Regression Equation', 1, TRUE)
a<-table.row.end(a)
myeq <- colnames(x)[1]
myeq <- paste(myeq, '[t] = ', sep='')
for (i in 1:k){
if (mysum$coefficients[i,1] > 0) myeq <- paste(myeq, '+', '')
myeq <- paste(myeq, signif(mysum$coefficients[i,1],6), sep=' ')
if (rownames(mysum$coefficients)[i] != '(Intercept)') {
myeq <- paste(myeq, rownames(mysum$coefficients)[i], sep='')
if (rownames(mysum$coefficients)[i] != 't') myeq <- paste(myeq, '[t]', sep='')
}
}
myeq <- paste(myeq, ' + e[t]')
a<-table.row.start(a)
a<-table.element(a, myeq)
a<-table.row.end(a)
a<-table.row.start(a)
a<-table.element(a, mywarning)
a<-table.row.end(a)
a<-table.end(a)
table.save(a,file='mytable1.tab')
a<-table.start()
a<-table.row.start(a)
a<-table.element(a,hyperlink('ols1.htm','Multiple Linear Regression - Ordinary Least Squares',''), 6, TRUE)
a<-table.row.end(a)
a<-table.row.start(a)
a<-table.element(a,'Variable',header=TRUE)
a<-table.element(a,'Parameter',header=TRUE)
a<-table.element(a,'S.D.',header=TRUE)
a<-table.element(a,'T-STAT
H0: parameter = 0',header=TRUE)
a<-table.element(a,'2-tail p-value',header=TRUE)
a<-table.element(a,'1-tail p-value',header=TRUE)
a<-table.row.end(a)
for (i in 1:k){
a<-table.row.start(a)
a<-table.element(a,rownames(mysum$coefficients)[i],header=TRUE)
a<-table.element(a,formatC(signif(mysum$coefficients[i,1],5),format='g',flag='+'))
a<-table.element(a,formatC(signif(mysum$coefficients[i,2],5),format='g',flag=' '))
a<-table.element(a,formatC(signif(mysum$coefficients[i,3],4),format='e',flag='+'))
a<-table.element(a,formatC(signif(mysum$coefficients[i,4],4),format='g',flag=' '))
a<-table.element(a,formatC(signif(mysum$coefficients[i,4]/2,4),format='g',flag=' '))
a<-table.row.end(a)
}
a<-table.end(a)
table.save(a,file='mytable2.tab')
a<-table.start()
a<-table.row.start(a)
a<-table.element(a, 'Multiple Linear Regression - Regression Statistics', 2, TRUE)
a<-table.row.end(a)
a<-table.row.start(a)
a<-table.element(a, 'Multiple R',1,TRUE)
a<-table.element(a,formatC(signif(sqrt(mysum$r.squared),6),format='g',flag=' '))
a<-table.row.end(a)
a<-table.row.start(a)
a<-table.element(a, 'R-squared',1,TRUE)
a<-table.element(a,formatC(signif(mysum$r.squared,6),format='g',flag=' '))
a<-table.row.end(a)
a<-table.row.start(a)
a<-table.element(a, 'Adjusted R-squared',1,TRUE)
a<-table.element(a,formatC(signif(mysum$adj.r.squared,6),format='g',flag=' '))
a<-table.row.end(a)
a<-table.row.start(a)
a<-table.element(a, 'F-TEST (value)',1,TRUE)
a<-table.element(a,formatC(signif(mysum$fstatistic[1],6),format='g',flag=' '))
a<-table.row.end(a)
a<-table.row.start(a)
a<-table.element(a, 'F-TEST (DF numerator)',1,TRUE)
a<-table.element(a, signif(mysum$fstatistic[2],6))
a<-table.row.end(a)
a<-table.row.start(a)
a<-table.element(a, 'F-TEST (DF denominator)',1,TRUE)
a<-table.element(a, signif(mysum$fstatistic[3],6))
a<-table.row.end(a)
a<-table.row.start(a)
a<-table.element(a, 'p-value',1,TRUE)
a<-table.element(a,formatC(signif(1-pf(mysum$fstatistic[1],mysum$fstatistic[2],mysum$fstatistic[3]),6),format='g',flag=' '))
a<-table.row.end(a)
a<-table.row.start(a)
a<-table.element(a, 'Multiple Linear Regression - Residual Statistics', 2, TRUE)
a<-table.row.end(a)
a<-table.row.start(a)
a<-table.element(a, 'Residual Standard Deviation',1,TRUE)
a<-table.element(a,formatC(signif(mysum$sigma,6),format='g',flag=' '))
a<-table.row.end(a)
a<-table.row.start(a)
a<-table.element(a, 'Sum Squared Residuals',1,TRUE)
a<-table.element(a,formatC(signif(sum(myerror*myerror),6),format='g',flag=' '))
a<-table.row.end(a)
a<-table.end(a)
table.save(a,file='mytable3.tab')
if(n < 200) {
a<-table.start()
a<-table.row.start(a)
a<-table.element(a, 'Multiple Linear Regression - Actuals, Interpolation, and Residuals', 4, TRUE)
a<-table.row.end(a)
a<-table.row.start(a)
a<-table.element(a, 'Time or Index', 1, TRUE)
a<-table.element(a, 'Actuals', 1, TRUE)
a<-table.element(a, 'Interpolation
Forecast', 1, TRUE)
a<-table.element(a, 'Residuals
Prediction Error', 1, TRUE)
a<-table.row.end(a)
for (i in 1:n) {
a<-table.row.start(a)
a<-table.element(a,i, 1, TRUE)
a<-table.element(a,formatC(signif(x[i],6),format='g',flag=' '))
a<-table.element(a,formatC(signif(x[i]-mysum$resid[i],6),format='g',flag=' '))
a<-table.element(a,formatC(signif(mysum$resid[i],6),format='g',flag=' '))
a<-table.row.end(a)
}
a<-table.end(a)
table.save(a,file='mytable4.tab')
if (n > n25) {
a<-table.start()
a<-table.row.start(a)
a<-table.element(a,'Goldfeld-Quandt test for Heteroskedasticity',4,TRUE)
a<-table.row.end(a)
a<-table.row.start(a)
a<-table.element(a,'p-values',header=TRUE)
a<-table.element(a,'Alternative Hypothesis',3,header=TRUE)
a<-table.row.end(a)
a<-table.row.start(a)
a<-table.element(a,'breakpoint index',header=TRUE)
a<-table.element(a,'greater',header=TRUE)
a<-table.element(a,'2-sided',header=TRUE)
a<-table.element(a,'less',header=TRUE)
a<-table.row.end(a)
for (mypoint in kp3:nmkm3) {
a<-table.row.start(a)
a<-table.element(a,mypoint,header=TRUE)
a<-table.element(a,formatC(signif(gqarr[mypoint-kp3+1,1],6),format='g',flag=' '))
a<-table.element(a,formatC(signif(gqarr[mypoint-kp3+1,2],6),format='g',flag=' '))
a<-table.element(a,formatC(signif(gqarr[mypoint-kp3+1,3],6),format='g',flag=' '))
a<-table.row.end(a)
}
a<-table.end(a)
table.save(a,file='mytable5.tab')
a<-table.start()
a<-table.row.start(a)
a<-table.element(a,'Meta Analysis of Goldfeld-Quandt test for Heteroskedasticity',4,TRUE)
a<-table.row.end(a)
a<-table.row.start(a)
a<-table.element(a,'Description',header=TRUE)
a<-table.element(a,'# significant tests',header=TRUE)
a<-table.element(a,'% significant tests',header=TRUE)
a<-table.element(a,'OK/NOK',header=TRUE)
a<-table.row.end(a)
a<-table.row.start(a)
a<-table.element(a,'1% type I error level',header=TRUE)
a<-table.element(a,signif(numsignificant1,6))
a<-table.element(a,formatC(signif(numsignificant1/numgqtests,6),format='g',flag=' '))
if (numsignificant1/numgqtests < 0.01) dum <- 'OK' else dum <- 'NOK'
a<-table.element(a,dum)
a<-table.row.end(a)
a<-table.row.start(a)
a<-table.element(a,'5% type I error level',header=TRUE)
a<-table.element(a,signif(numsignificant5,6))
a<-table.element(a,signif(numsignificant5/numgqtests,6))
if (numsignificant5/numgqtests < 0.05) dum <- 'OK' else dum <- 'NOK'
a<-table.element(a,dum)
a<-table.row.end(a)
a<-table.row.start(a)
a<-table.element(a,'10% type I error level',header=TRUE)
a<-table.element(a,signif(numsignificant10,6))
a<-table.element(a,signif(numsignificant10/numgqtests,6))
if (numsignificant10/numgqtests < 0.1) dum <- 'OK' else dum <- 'NOK'
a<-table.element(a,dum)
a<-table.row.end(a)
a<-table.end(a)
table.save(a,file='mytable6.tab')
}
}