Free Statistics
of Irreproducible Research!
Description of Statistical Computation | |||||||||||||||||||||||||||||||||||||||
|---|---|---|---|---|---|---|---|---|---|---|---|---|---|---|---|---|---|---|---|---|---|---|---|---|---|---|---|---|---|---|---|---|---|---|---|---|---|---|---|
| Author's title | |||||||||||||||||||||||||||||||||||||||
| Author | *The author of this computation has been verified* | ||||||||||||||||||||||||||||||||||||||
| R Software Module | rwasp_fitdistrnorm.wasp | ||||||||||||||||||||||||||||||||||||||
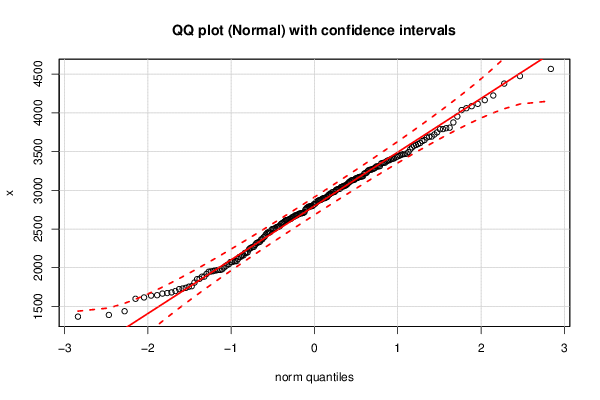
| Title produced by software | ML Fitting and QQ Plot- Normal Distribution | ||||||||||||||||||||||||||||||||||||||
| Date of computation | Fri, 04 Dec 2015 10:43:20 +0000 | ||||||||||||||||||||||||||||||||||||||
| Cite this page as follows | Statistical Computations at FreeStatistics.org, Office for Research Development and Education, URL https://freestatistics.org/blog/index.php?v=date/2015/Dec/04/t1449225887b8dtym0p8mu5ewn.htm/, Retrieved Thu, 16 May 2024 07:13:38 +0000 | ||||||||||||||||||||||||||||||||||||||
| Statistical Computations at FreeStatistics.org, Office for Research Development and Education, URL https://freestatistics.org/blog/index.php?pk=285061, Retrieved Thu, 16 May 2024 07:13:38 +0000 | |||||||||||||||||||||||||||||||||||||||
| QR Codes: | |||||||||||||||||||||||||||||||||||||||
|
| |||||||||||||||||||||||||||||||||||||||
| Original text written by user: | |||||||||||||||||||||||||||||||||||||||
| IsPrivate? | No (this computation is public) | ||||||||||||||||||||||||||||||||||||||
| User-defined keywords | |||||||||||||||||||||||||||||||||||||||
| Estimated Impact | 108 | ||||||||||||||||||||||||||||||||||||||
Tree of Dependent Computations | |||||||||||||||||||||||||||||||||||||||
| Family? (F = Feedback message, R = changed R code, M = changed R Module, P = changed Parameters, D = changed Data) | |||||||||||||||||||||||||||||||||||||||
| - [ML Fitting and QQ Plot- Normal Distribution] [normaal verdeling...] [2015-12-04 10:43:20] [9ba20d7febfaa932a022ff7864ec748a] [Current] | |||||||||||||||||||||||||||||||||||||||
| Feedback Forum | |||||||||||||||||||||||||||||||||||||||
Post a new message | |||||||||||||||||||||||||||||||||||||||
Dataset | |||||||||||||||||||||||||||||||||||||||
| Dataseries X: | |||||||||||||||||||||||||||||||||||||||
1673 1724 1755 1857 1884 1952 1920 1964 2020 2036 2073 1955 1972 1980 2084 2112 2160 2161 2198 2270 2295 2336 2194 2236 2267 2325 2367 2426 2483 2535 2631 2657 2676 2499 2572 2616 2653 2718 2766 2839 2868 2977 3015 3042 2709 2785 2820 2861 2935 3004 3112 3176 3288 3352 3358 2875 2976 3044 3017 3106 3261 3356 3408 3493 3576 3636 2899 2963 3065 3077 3178 3310 3400 3466 3585 3692 3721 3127 3214 3130 3133 3222 3346 3450 3597 3694 3791 3808 3266 3410 3473 3375 3462 3681 3789 3876 4036 4086 4116 3529 3649 3748 3802 3953 4060 4164 4224 4378 4475 4567 1368 1390 1438 1599 1616 1666 1645 1681 1731 1761 1808 1640 1699 1740 1852 1885 1948 1967 2002 2073 2085 2139 1972 2045 2083 2142 2191 2261 2317 2365 2459 2506 2534 2252 2329 2391 2458 2524 2589 2673 2706 2824 2883 2914 2401 2510 2561 2631 2699 2796 2900 2973 3090 3157 3184 2444 2499 2578 2614 2704 2852 2946 3010 3135 3225 3306 2457 2527 2623 2675 2776 2898 2985 3052 3170 3265 3308 2601 2684 2648 2702 2792 2914 3021 3159 3278 3385 3424 2615 2749 2804 2791 2872 3062 3172 3247 3389 3433 3469 2693 2795 2891 2954 3053 3149 3274 3312 3443 3555 3611 | |||||||||||||||||||||||||||||||||||||||
Tables (Output of Computation) | |||||||||||||||||||||||||||||||||||||||
| |||||||||||||||||||||||||||||||||||||||
Figures (Output of Computation) | |||||||||||||||||||||||||||||||||||||||
Input Parameters & R Code | |||||||||||||||||||||||||||||||||||||||
| Parameters (Session): | |||||||||||||||||||||||||||||||||||||||
| par1 = 8 ; par2 = 16 ; | |||||||||||||||||||||||||||||||||||||||
| Parameters (R input): | |||||||||||||||||||||||||||||||||||||||
| par1 = 8 ; par2 = 16 ; | |||||||||||||||||||||||||||||||||||||||
| R code (references can be found in the software module): | |||||||||||||||||||||||||||||||||||||||
par2 <- '0' | |||||||||||||||||||||||||||||||||||||||