Free Statistics

of Irreproducible Research!

Author's title

Author*The author of this computation has been verified*
R Software Modulerwasp_structuraltimeseries.wasp
Title produced by softwareStructural Time Series Models
Date of computationFri, 04 Dec 2015 13:08:54 +0000
Cite this page as followsStatistical Computations at FreeStatistics.org, Office for Research Development and Education, URL https://freestatistics.org/blog/index.php?v=date/2015/Dec/04/t1449234687njbhbmo020cy1lh.htm/, Retrieved Thu, 16 May 2024 14:27:17 +0000
Statistical Computations at FreeStatistics.org, Office for Research Development and Education, URL https://freestatistics.org/blog/index.php?pk=285131, Retrieved Thu, 16 May 2024 14:27:17 +0000
QR Codes:

Original text written by user:
IsPrivate?No (this computation is public)
User-defined keywords
Estimated Impact68
Family? (F = Feedback message, R = changed R code, M = changed R Module, P = changed Parameters, D = changed Data)
-       [Structural Time Series Models] [Structural Time S...] [2015-12-04 13:08:54] [ff3d2f95d547acf4e713c6c38557a786] [Current]
Feedback Forum

Post a new message
Dataseries X:
2327
2445
2490
2570
2721
2772
2830
2894
2999
3091
3177
3271
3345
3386


Summary of computational transaction
Raw Inputview raw input (R code)
Raw Outputview raw output of R engine
Computing time3 seconds
R Server'Gwilym Jenkins' @ jenkins.wessa.net

\begin{tabular}{lllllllll}
\hline
Summary of computational transaction \tabularnewline
Raw Input & view raw input (R code)  \tabularnewline
Raw Output & view raw output of R engine  \tabularnewline
Computing time & 3 seconds \tabularnewline
R Server & 'Gwilym Jenkins' @ jenkins.wessa.net \tabularnewline
\hline
\end{tabular}
%Source: https://freestatistics.org/blog/index.php?pk=285131&T=0

[TABLE]
[ROW][C]Summary of computational transaction[/C][/ROW]
[ROW][C]Raw Input[/C][C]view raw input (R code) [/C][/ROW]
[ROW][C]Raw Output[/C][C]view raw output of R engine [/C][/ROW]
[ROW][C]Computing time[/C][C]3 seconds[/C][/ROW]
[ROW][C]R Server[/C][C]'Gwilym Jenkins' @ jenkins.wessa.net[/C][/ROW]
[/TABLE]
Source: https://freestatistics.org/blog/index.php?pk=285131&T=0

Globally Unique Identifier (entire table): ba.freestatistics.org/blog/index.php?pk=285131&T=0

As an alternative you can also use a QR Code:  

The GUIDs for individual cells are displayed in the table below:

Summary of computational transaction
Raw Inputview raw input (R code)
Raw Outputview raw output of R engine
Computing time3 seconds
R Server'Gwilym Jenkins' @ jenkins.wessa.net


Structural Time Series Model
tObservedLevelSlopeSeasonalStand. Residuals
123272327000
224452440.4718655585735.44863629384444.528134441434581.89937937414394
324902485.5930624759241.62110688009664.406937524081190.187008013091643
425702565.7706534709466.00422353967224.229346529056580.762930491342296
527212716.91465339893119.8804162355174.085346601069571.69299553848404
627722767.8719041107776.23271359304974.12809588922993-1.37236651058982
728302825.8677585458264.67960220457374.13224145418215-0.363279763117886
828942889.8677019361464.24897643352634.13229806385637-0.0135408760082348
929992994.8689455295890.07059346329644.131054470420770.811952800381838
1030913086.8689671004591.29314905427834.131032899546750.0384428914670595
1131773172.8689454203187.93918048405614.13105457969406-0.105464531764262
1232713266.868954514991.77957831173254.131045485094820.120760153700317
1333453383.7366032644107.290297258971-38.73660326439550.55583913142215
1433863384.5848885993848.65812638672961.41511140061884-1.70242292641797

\begin{tabular}{lllllllll}
\hline
Structural Time Series Model \tabularnewline
t & Observed & Level & Slope & Seasonal & Stand. Residuals \tabularnewline
1 & 2327 & 2327 & 0 & 0 & 0 \tabularnewline
2 & 2445 & 2440.47186555857 & 35.4486362938444 & 4.52813444143458 & 1.89937937414394 \tabularnewline
3 & 2490 & 2485.59306247592 & 41.6211068800966 & 4.40693752408119 & 0.187008013091643 \tabularnewline
4 & 2570 & 2565.77065347094 & 66.0042235396722 & 4.22934652905658 & 0.762930491342296 \tabularnewline
5 & 2721 & 2716.91465339893 & 119.880416235517 & 4.08534660106957 & 1.69299553848404 \tabularnewline
6 & 2772 & 2767.87190411077 & 76.2327135930497 & 4.12809588922993 & -1.37236651058982 \tabularnewline
7 & 2830 & 2825.86775854582 & 64.6796022045737 & 4.13224145418215 & -0.363279763117886 \tabularnewline
8 & 2894 & 2889.86770193614 & 64.2489764335263 & 4.13229806385637 & -0.0135408760082348 \tabularnewline
9 & 2999 & 2994.86894552958 & 90.0705934632964 & 4.13105447042077 & 0.811952800381838 \tabularnewline
10 & 3091 & 3086.86896710045 & 91.2931490542783 & 4.13103289954675 & 0.0384428914670595 \tabularnewline
11 & 3177 & 3172.86894542031 & 87.9391804840561 & 4.13105457969406 & -0.105464531764262 \tabularnewline
12 & 3271 & 3266.8689545149 & 91.7795783117325 & 4.13104548509482 & 0.120760153700317 \tabularnewline
13 & 3345 & 3383.7366032644 & 107.290297258971 & -38.7366032643955 & 0.55583913142215 \tabularnewline
14 & 3386 & 3384.58488859938 & 48.6581263867296 & 1.41511140061884 & -1.70242292641797 \tabularnewline
\hline
\end{tabular}
%Source: https://freestatistics.org/blog/index.php?pk=285131&T=1

[TABLE]
[ROW][C]Structural Time Series Model[/C][/ROW]
[ROW][C]t[/C][C]Observed[/C][C]Level[/C][C]Slope[/C][C]Seasonal[/C][C]Stand. Residuals[/C][/ROW]
[ROW][C]1[/C][C]2327[/C][C]2327[/C][C]0[/C][C]0[/C][C]0[/C][/ROW]
[ROW][C]2[/C][C]2445[/C][C]2440.47186555857[/C][C]35.4486362938444[/C][C]4.52813444143458[/C][C]1.89937937414394[/C][/ROW]
[ROW][C]3[/C][C]2490[/C][C]2485.59306247592[/C][C]41.6211068800966[/C][C]4.40693752408119[/C][C]0.187008013091643[/C][/ROW]
[ROW][C]4[/C][C]2570[/C][C]2565.77065347094[/C][C]66.0042235396722[/C][C]4.22934652905658[/C][C]0.762930491342296[/C][/ROW]
[ROW][C]5[/C][C]2721[/C][C]2716.91465339893[/C][C]119.880416235517[/C][C]4.08534660106957[/C][C]1.69299553848404[/C][/ROW]
[ROW][C]6[/C][C]2772[/C][C]2767.87190411077[/C][C]76.2327135930497[/C][C]4.12809588922993[/C][C]-1.37236651058982[/C][/ROW]
[ROW][C]7[/C][C]2830[/C][C]2825.86775854582[/C][C]64.6796022045737[/C][C]4.13224145418215[/C][C]-0.363279763117886[/C][/ROW]
[ROW][C]8[/C][C]2894[/C][C]2889.86770193614[/C][C]64.2489764335263[/C][C]4.13229806385637[/C][C]-0.0135408760082348[/C][/ROW]
[ROW][C]9[/C][C]2999[/C][C]2994.86894552958[/C][C]90.0705934632964[/C][C]4.13105447042077[/C][C]0.811952800381838[/C][/ROW]
[ROW][C]10[/C][C]3091[/C][C]3086.86896710045[/C][C]91.2931490542783[/C][C]4.13103289954675[/C][C]0.0384428914670595[/C][/ROW]
[ROW][C]11[/C][C]3177[/C][C]3172.86894542031[/C][C]87.9391804840561[/C][C]4.13105457969406[/C][C]-0.105464531764262[/C][/ROW]
[ROW][C]12[/C][C]3271[/C][C]3266.8689545149[/C][C]91.7795783117325[/C][C]4.13104548509482[/C][C]0.120760153700317[/C][/ROW]
[ROW][C]13[/C][C]3345[/C][C]3383.7366032644[/C][C]107.290297258971[/C][C]-38.7366032643955[/C][C]0.55583913142215[/C][/ROW]
[ROW][C]14[/C][C]3386[/C][C]3384.58488859938[/C][C]48.6581263867296[/C][C]1.41511140061884[/C][C]-1.70242292641797[/C][/ROW]
[/TABLE]
Source: https://freestatistics.org/blog/index.php?pk=285131&T=1

Globally Unique Identifier (entire table): ba.freestatistics.org/blog/index.php?pk=285131&T=1

As an alternative you can also use a QR Code:  

The GUIDs for individual cells are displayed in the table below:

Structural Time Series Model
tObservedLevelSlopeSeasonalStand. Residuals
123272327000
224452440.4718655585735.44863629384444.528134441434581.89937937414394
324902485.5930624759241.62110688009664.406937524081190.187008013091643
425702565.7706534709466.00422353967224.229346529056580.762930491342296
527212716.91465339893119.8804162355174.085346601069571.69299553848404
627722767.8719041107776.23271359304974.12809588922993-1.37236651058982
728302825.8677585458264.67960220457374.13224145418215-0.363279763117886
828942889.8677019361464.24897643352634.13229806385637-0.0135408760082348
929992994.8689455295890.07059346329644.131054470420770.811952800381838
1030913086.8689671004591.29314905427834.131032899546750.0384428914670595
1131773172.8689454203187.93918048405614.13105457969406-0.105464531764262
1232713266.868954514991.77957831173254.131045485094820.120760153700317
1333453383.7366032644107.290297258971-38.73660326439550.55583913142215
1433863384.5848885993848.65812638672961.41511140061884-1.70242292641797


Parameters (Session):
par1 = 12 ;
Parameters (R input):
par1 = 12 ;
R code (references can be found in the software module):
par1 <- as.numeric(par1)
nx <- length(x)
x <- ts(x,frequency=par1)
m <- StructTS(x,type='BSM')
m$coef
m$fitted
m$resid
mylevel <- as.numeric(m$fitted[,'level'])
myslope <- as.numeric(m$fitted[,'slope'])
myseas <- as.numeric(m$fitted[,'sea'])
myresid <- as.numeric(m$resid)
myfit <- mylevel+myseas
mylagmax <- nx/2
bitmap(file='test2.png')
op <- par(mfrow = c(2,2))
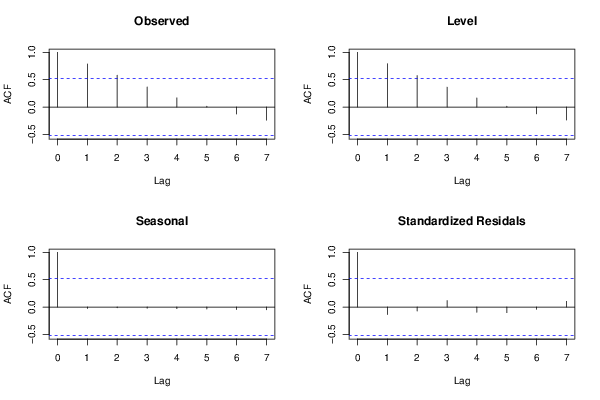
acf(as.numeric(x),lag.max = mylagmax,main='Observed')
acf(mylevel,na.action=na.pass,lag.max = mylagmax,main='Level')
acf(myseas,na.action=na.pass,lag.max = mylagmax,main='Seasonal')
acf(myresid,na.action=na.pass,lag.max = mylagmax,main='Standardized Residals')
par(op)
dev.off()
bitmap(file='test3.png')
op <- par(mfrow = c(2,2))
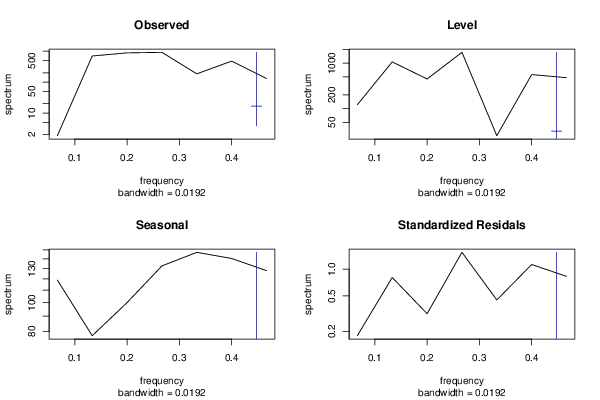
spectrum(as.numeric(x),main='Observed')
spectrum(mylevel,main='Level')
spectrum(myseas,main='Seasonal')
spectrum(myresid,main='Standardized Residals')
par(op)
dev.off()
bitmap(file='test4.png')
op <- par(mfrow = c(2,2))
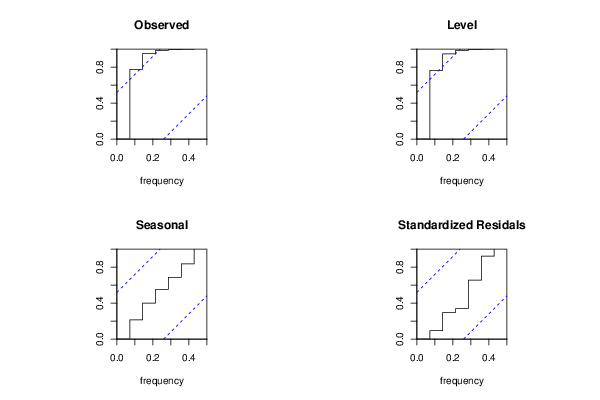
cpgram(as.numeric(x),main='Observed')
cpgram(mylevel,main='Level')
cpgram(myseas,main='Seasonal')
cpgram(myresid,main='Standardized Residals')
par(op)
dev.off()
bitmap(file='test1.png')
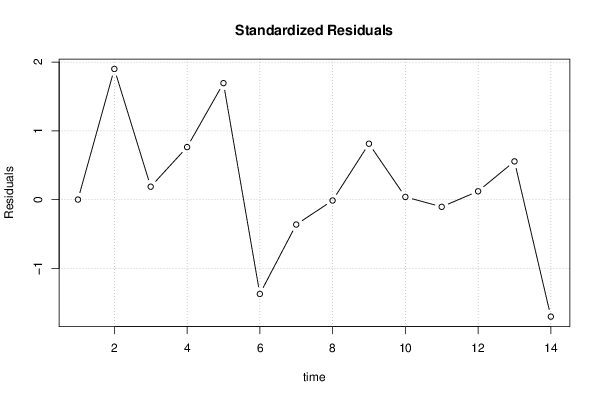
plot(as.numeric(m$resid),main='Standardized Residuals',ylab='Residuals',xlab='time',type='b')
grid()
dev.off()
bitmap(file='test5.png')
op <- par(mfrow = c(2,2))
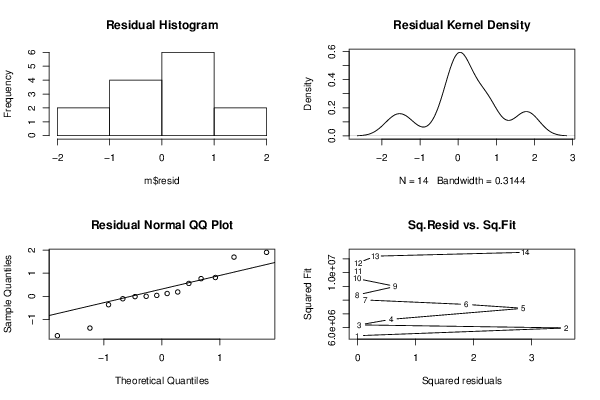
hist(m$resid,main='Residual Histogram')
plot(density(m$resid),main='Residual Kernel Density')
qqnorm(m$resid,main='Residual Normal QQ Plot')
qqline(m$resid)
plot(m$resid^2, myfit^2,main='Sq.Resid vs. Sq.Fit',xlab='Squared residuals',ylab='Squared Fit')
par(op)
dev.off()
load(file='createtable')
a<-table.start()
a<-table.row.start(a)
a<-table.element(a,'Structural Time Series Model',6,TRUE)
a<-table.row.end(a)
a<-table.row.start(a)
a<-table.element(a,'t',header=TRUE)
a<-table.element(a,'Observed',header=TRUE)
a<-table.element(a,'Level',header=TRUE)
a<-table.element(a,'Slope',header=TRUE)
a<-table.element(a,'Seasonal',header=TRUE)
a<-table.element(a,'Stand. Residuals',header=TRUE)
a<-table.row.end(a)
for (i in 1:nx) {
a<-table.row.start(a)
a<-table.element(a,i,header=TRUE)
a<-table.element(a,x[i])
a<-table.element(a,mylevel[i])
a<-table.element(a,myslope[i])
a<-table.element(a,myseas[i])
a<-table.element(a,myresid[i])
a<-table.row.end(a)
}
a<-table.end(a)
table.save(a,file='mytable.tab')