Free Statistics

of Irreproducible Research!

Author's title

Author*The author of this computation has been verified*
R Software Modulerwasp_multipleregression.wasp
Title produced by softwareMultiple Regression
Date of computationFri, 04 Dec 2015 13:41:12 +0000
Cite this page as followsStatistical Computations at FreeStatistics.org, Office for Research Development and Education, URL https://freestatistics.org/blog/index.php?v=date/2015/Dec/04/t1449236533y9c4q33fh77h8wc.htm/, Retrieved Thu, 16 May 2024 08:21:07 +0000
Statistical Computations at FreeStatistics.org, Office for Research Development and Education, URL https://freestatistics.org/blog/index.php?pk=285139, Retrieved Thu, 16 May 2024 08:21:07 +0000
QR Codes:

Original text written by user:
IsPrivate?No (this computation is public)
User-defined keywords
Estimated Impact107
Family? (F = Feedback message, R = changed R code, M = changed R Module, P = changed Parameters, D = changed Data)
-     [Bayesian Two Sample Test] [Bayesian test wer...] [2015-11-28 12:46:31] [2ba32e9656c7c3fdddad3ba3f1588288]
-   PD  [Bayesian Two Sample Test] [Bayesian test wer...] [2015-12-01 13:54:44] [2ba32e9656c7c3fdddad3ba3f1588288]
- RM        [Multiple Regression] [Multiple regression] [2015-12-04 13:41:12] [2ea4f5baf6c33ea976d37beb530b55ab] [Current]
- RM D        [] [Multiple regression] [-0001-11-30 00:00:00] [74be16979710d4c4e7c6647856088456]
- RM D        [] [Multiple regressi...] [-0001-11-30 00:00:00] [74be16979710d4c4e7c6647856088456]
Feedback Forum

Post a new message
Dataseries X:
21.6 20.7
21.6 20.7
21.6 20.7
19.4 18
19.4 18
19.4 18
15.9 16.9
15.9 16.9
15.9 16.9
21.8 24.4
21.8 24.4
21.8 24.4
17.6 15.5
17.6 15.5
17.6 15.5
19 18.4
19 18.4
19 18.4
16.3 16.2
16.3 16.2
16.3 16.2
22.5 20.6
22.5 20.6
22.5 20.6
23.8 19.8
23.8 19.8
23.8 19.8
24.6 21.6
24.6 21.6
24.6 21.6
22.7 22.3
22.7 22.3
22.7 22.3
25.2 23.7
25.2 23.7
25.2 23.7
26.4 22.1
26.4 22.1
26.4 22.1
26 26.6
26 26.6
26 26.6
23.2 23.5
23.2 23.5
23.2 23.5
22.7 19.6
22.7 19.6
22.7 19.6
24 20
24 20
24 20
20.7 20.1
20.7 20.1
20.7 20.1
23.8 16
23.8 16
23.8 16
27.1 18.9
27.1 18.9
27.1 18.9


Summary of computational transaction
Raw Inputview raw input (R code)
Raw Outputview raw output of R engine
Computing time5 seconds
R Server'Gwilym Jenkins' @ jenkins.wessa.net

\begin{tabular}{lllllllll}
\hline
Summary of computational transaction \tabularnewline
Raw Input & view raw input (R code)  \tabularnewline
Raw Output & view raw output of R engine  \tabularnewline
Computing time & 5 seconds \tabularnewline
R Server & 'Gwilym Jenkins' @ jenkins.wessa.net \tabularnewline
\hline
\end{tabular}
%Source: https://freestatistics.org/blog/index.php?pk=285139&T=0

[TABLE]
[ROW][C]Summary of computational transaction[/C][/ROW]
[ROW][C]Raw Input[/C][C]view raw input (R code) [/C][/ROW]
[ROW][C]Raw Output[/C][C]view raw output of R engine [/C][/ROW]
[ROW][C]Computing time[/C][C]5 seconds[/C][/ROW]
[ROW][C]R Server[/C][C]'Gwilym Jenkins' @ jenkins.wessa.net[/C][/ROW]
[/TABLE]
Source: https://freestatistics.org/blog/index.php?pk=285139&T=0

Globally Unique Identifier (entire table): ba.freestatistics.org/blog/index.php?pk=285139&T=0

As an alternative you can also use a QR Code:  

The GUIDs for individual cells are displayed in the table below:

Summary of computational transaction
Raw Inputview raw input (R code)
Raw Outputview raw output of R engine
Computing time5 seconds
R Server'Gwilym Jenkins' @ jenkins.wessa.net


Multiple Linear Regression - Estimated Regression Equation
M-25[t] = + 2.55901 + 0.21416`V-25`[t] + 0.749754`M-25(t-1)`[t] -3.57098e-16`M-25(t-2)`[t] -0.350986`M-25(t-3)`[t] + 0.211146`M-25(t-4)`[t] + 0.488921M1[t] + 0.44374M2[t] -1.00142M3[t] + 0.279268M4[t] + 0.234087M5[t] + 2.59453M6[t] + 0.269597M7[t] + 0.224417M8[t] + 1.71288M9[t] + 0.998382M10[t] + 0.953202M11[t] + 0.0451808t + e[t]
Warning: you did not specify the column number of the endogenous series! The first column was selected by default.

\begin{tabular}{lllllllll}
\hline
Multiple Linear Regression - Estimated Regression Equation \tabularnewline
M-25[t] =  +  2.55901 +  0.21416`V-25`[t] +  0.749754`M-25(t-1)`[t] -3.57098e-16`M-25(t-2)`[t] -0.350986`M-25(t-3)`[t] +  0.211146`M-25(t-4)`[t] +  0.488921M1[t] +  0.44374M2[t] -1.00142M3[t] +  0.279268M4[t] +  0.234087M5[t] +  2.59453M6[t] +  0.269597M7[t] +  0.224417M8[t] +  1.71288M9[t] +  0.998382M10[t] +  0.953202M11[t] +  0.0451808t  + e[t] \tabularnewline
Warning: you did not specify the column number of the endogenous series! The first column was selected by default. \tabularnewline
\hline
\end{tabular}
%Source: https://freestatistics.org/blog/index.php?pk=285139&T=1

[TABLE]
[ROW][C]Multiple Linear Regression - Estimated Regression Equation[/C][/ROW]
[ROW][C]M-25[t] =  +  2.55901 +  0.21416`V-25`[t] +  0.749754`M-25(t-1)`[t] -3.57098e-16`M-25(t-2)`[t] -0.350986`M-25(t-3)`[t] +  0.211146`M-25(t-4)`[t] +  0.488921M1[t] +  0.44374M2[t] -1.00142M3[t] +  0.279268M4[t] +  0.234087M5[t] +  2.59453M6[t] +  0.269597M7[t] +  0.224417M8[t] +  1.71288M9[t] +  0.998382M10[t] +  0.953202M11[t] +  0.0451808t  + e[t][/C][/ROW]
[ROW][C]Warning: you did not specify the column number of the endogenous series! The first column was selected by default.[/C][/ROW]
[/TABLE]
Source: https://freestatistics.org/blog/index.php?pk=285139&T=1

Globally Unique Identifier (entire table): ba.freestatistics.org/blog/index.php?pk=285139&T=1

As an alternative you can also use a QR Code:  

The GUIDs for individual cells are displayed in the table below:

Multiple Linear Regression - Estimated Regression Equation
M-25[t] = + 2.55901 + 0.21416`V-25`[t] + 0.749754`M-25(t-1)`[t] -3.57098e-16`M-25(t-2)`[t] -0.350986`M-25(t-3)`[t] + 0.211146`M-25(t-4)`[t] + 0.488921M1[t] + 0.44374M2[t] -1.00142M3[t] + 0.279268M4[t] + 0.234087M5[t] + 2.59453M6[t] + 0.269597M7[t] + 0.224417M8[t] + 1.71288M9[t] + 0.998382M10[t] + 0.953202M11[t] + 0.0451808t + e[t]
Warning: you did not specify the column number of the endogenous series! The first column was selected by default.


Multiple Linear Regression - Ordinary Least Squares
VariableParameterS.D.T-STATH0: parameter = 02-tail p-value1-tail p-value
(Intercept)+2.559 2.028+1.2620e+00 0.2146 0.1073
`V-25`+0.2142 0.08882+2.4110e+00 0.02084 0.01042
`M-25(t-1)`+0.7498 0.1571+4.7720e+00 2.696e-05 1.348e-05
`M-25(t-2)`-3.571e-16 0.1867-1.9130e-15 1 0.5
`M-25(t-3)`-0.351 0.1878-1.8690e+00 0.06935 0.03467
`M-25(t-4)`+0.2112 0.1479+1.4270e+00 0.1617 0.08084
M1+0.4889 0.8784+5.5660e-01 0.5811 0.2905
M2+0.4437 0.8778+5.0550e-01 0.6161 0.3081
M3-1.001 0.8988-1.1140e+00 0.2722 0.1361
M4+0.2793 0.9106+3.0670e-01 0.7608 0.3804
M5+0.2341 0.9122+2.5660e-01 0.7989 0.3994
M6+2.595 0.9235+2.8090e+00 0.007799 0.0039
M7+0.2696 0.989+2.7260e-01 0.7866 0.3933
M8+0.2244 0.9901+2.2670e-01 0.8219 0.411
M9+1.713 1.047+1.6360e+00 0.1102 0.05508
M10+0.9984 0.9454+1.0560e+00 0.2976 0.1488
M11+0.9532 0.9428+1.0110e+00 0.3184 0.1592
t+0.04518 0.01853+2.4390e+00 0.01953 0.009763

\begin{tabular}{lllllllll}
\hline
Multiple Linear Regression - Ordinary Least Squares \tabularnewline
Variable & Parameter & S.D. & T-STATH0: parameter = 0 & 2-tail p-value & 1-tail p-value \tabularnewline
(Intercept) & +2.559 &  2.028 & +1.2620e+00 &  0.2146 &  0.1073 \tabularnewline
`V-25` & +0.2142 &  0.08882 & +2.4110e+00 &  0.02084 &  0.01042 \tabularnewline
`M-25(t-1)` & +0.7498 &  0.1571 & +4.7720e+00 &  2.696e-05 &  1.348e-05 \tabularnewline
`M-25(t-2)` & -3.571e-16 &  0.1867 & -1.9130e-15 &  1 &  0.5 \tabularnewline
`M-25(t-3)` & -0.351 &  0.1878 & -1.8690e+00 &  0.06935 &  0.03467 \tabularnewline
`M-25(t-4)` & +0.2112 &  0.1479 & +1.4270e+00 &  0.1617 &  0.08084 \tabularnewline
M1 & +0.4889 &  0.8784 & +5.5660e-01 &  0.5811 &  0.2905 \tabularnewline
M2 & +0.4437 &  0.8778 & +5.0550e-01 &  0.6161 &  0.3081 \tabularnewline
M3 & -1.001 &  0.8988 & -1.1140e+00 &  0.2722 &  0.1361 \tabularnewline
M4 & +0.2793 &  0.9106 & +3.0670e-01 &  0.7608 &  0.3804 \tabularnewline
M5 & +0.2341 &  0.9122 & +2.5660e-01 &  0.7989 &  0.3994 \tabularnewline
M6 & +2.595 &  0.9235 & +2.8090e+00 &  0.007799 &  0.0039 \tabularnewline
M7 & +0.2696 &  0.989 & +2.7260e-01 &  0.7866 &  0.3933 \tabularnewline
M8 & +0.2244 &  0.9901 & +2.2670e-01 &  0.8219 &  0.411 \tabularnewline
M9 & +1.713 &  1.047 & +1.6360e+00 &  0.1102 &  0.05508 \tabularnewline
M10 & +0.9984 &  0.9454 & +1.0560e+00 &  0.2976 &  0.1488 \tabularnewline
M11 & +0.9532 &  0.9428 & +1.0110e+00 &  0.3184 &  0.1592 \tabularnewline
t & +0.04518 &  0.01853 & +2.4390e+00 &  0.01953 &  0.009763 \tabularnewline
\hline
\end{tabular}
%Source: https://freestatistics.org/blog/index.php?pk=285139&T=2

[TABLE]
[ROW][C]Multiple Linear Regression - Ordinary Least Squares[/C][/ROW]
[ROW][C]Variable[/C][C]Parameter[/C][C]S.D.[/C][C]T-STATH0: parameter = 0[/C][C]2-tail p-value[/C][C]1-tail p-value[/C][/ROW]
[ROW][C](Intercept)[/C][C]+2.559[/C][C] 2.028[/C][C]+1.2620e+00[/C][C] 0.2146[/C][C] 0.1073[/C][/ROW]
[ROW][C]`V-25`[/C][C]+0.2142[/C][C] 0.08882[/C][C]+2.4110e+00[/C][C] 0.02084[/C][C] 0.01042[/C][/ROW]
[ROW][C]`M-25(t-1)`[/C][C]+0.7498[/C][C] 0.1571[/C][C]+4.7720e+00[/C][C] 2.696e-05[/C][C] 1.348e-05[/C][/ROW]
[ROW][C]`M-25(t-2)`[/C][C]-3.571e-16[/C][C] 0.1867[/C][C]-1.9130e-15[/C][C] 1[/C][C] 0.5[/C][/ROW]
[ROW][C]`M-25(t-3)`[/C][C]-0.351[/C][C] 0.1878[/C][C]-1.8690e+00[/C][C] 0.06935[/C][C] 0.03467[/C][/ROW]
[ROW][C]`M-25(t-4)`[/C][C]+0.2112[/C][C] 0.1479[/C][C]+1.4270e+00[/C][C] 0.1617[/C][C] 0.08084[/C][/ROW]
[ROW][C]M1[/C][C]+0.4889[/C][C] 0.8784[/C][C]+5.5660e-01[/C][C] 0.5811[/C][C] 0.2905[/C][/ROW]
[ROW][C]M2[/C][C]+0.4437[/C][C] 0.8778[/C][C]+5.0550e-01[/C][C] 0.6161[/C][C] 0.3081[/C][/ROW]
[ROW][C]M3[/C][C]-1.001[/C][C] 0.8988[/C][C]-1.1140e+00[/C][C] 0.2722[/C][C] 0.1361[/C][/ROW]
[ROW][C]M4[/C][C]+0.2793[/C][C] 0.9106[/C][C]+3.0670e-01[/C][C] 0.7608[/C][C] 0.3804[/C][/ROW]
[ROW][C]M5[/C][C]+0.2341[/C][C] 0.9122[/C][C]+2.5660e-01[/C][C] 0.7989[/C][C] 0.3994[/C][/ROW]
[ROW][C]M6[/C][C]+2.595[/C][C] 0.9235[/C][C]+2.8090e+00[/C][C] 0.007799[/C][C] 0.0039[/C][/ROW]
[ROW][C]M7[/C][C]+0.2696[/C][C] 0.989[/C][C]+2.7260e-01[/C][C] 0.7866[/C][C] 0.3933[/C][/ROW]
[ROW][C]M8[/C][C]+0.2244[/C][C] 0.9901[/C][C]+2.2670e-01[/C][C] 0.8219[/C][C] 0.411[/C][/ROW]
[ROW][C]M9[/C][C]+1.713[/C][C] 1.047[/C][C]+1.6360e+00[/C][C] 0.1102[/C][C] 0.05508[/C][/ROW]
[ROW][C]M10[/C][C]+0.9984[/C][C] 0.9454[/C][C]+1.0560e+00[/C][C] 0.2976[/C][C] 0.1488[/C][/ROW]
[ROW][C]M11[/C][C]+0.9532[/C][C] 0.9428[/C][C]+1.0110e+00[/C][C] 0.3184[/C][C] 0.1592[/C][/ROW]
[ROW][C]t[/C][C]+0.04518[/C][C] 0.01853[/C][C]+2.4390e+00[/C][C] 0.01953[/C][C] 0.009763[/C][/ROW]
[/TABLE]
Source: https://freestatistics.org/blog/index.php?pk=285139&T=2

Globally Unique Identifier (entire table): ba.freestatistics.org/blog/index.php?pk=285139&T=2

As an alternative you can also use a QR Code:  

The GUIDs for individual cells are displayed in the table below:

Multiple Linear Regression - Ordinary Least Squares
VariableParameterS.D.T-STATH0: parameter = 02-tail p-value1-tail p-value
(Intercept)+2.559 2.028+1.2620e+00 0.2146 0.1073
`V-25`+0.2142 0.08882+2.4110e+00 0.02084 0.01042
`M-25(t-1)`+0.7498 0.1571+4.7720e+00 2.696e-05 1.348e-05
`M-25(t-2)`-3.571e-16 0.1867-1.9130e-15 1 0.5
`M-25(t-3)`-0.351 0.1878-1.8690e+00 0.06935 0.03467
`M-25(t-4)`+0.2112 0.1479+1.4270e+00 0.1617 0.08084
M1+0.4889 0.8784+5.5660e-01 0.5811 0.2905
M2+0.4437 0.8778+5.0550e-01 0.6161 0.3081
M3-1.001 0.8988-1.1140e+00 0.2722 0.1361
M4+0.2793 0.9106+3.0670e-01 0.7608 0.3804
M5+0.2341 0.9122+2.5660e-01 0.7989 0.3994
M6+2.595 0.9235+2.8090e+00 0.007799 0.0039
M7+0.2696 0.989+2.7260e-01 0.7866 0.3933
M8+0.2244 0.9901+2.2670e-01 0.8219 0.411
M9+1.713 1.047+1.6360e+00 0.1102 0.05508
M10+0.9984 0.9454+1.0560e+00 0.2976 0.1488
M11+0.9532 0.9428+1.0110e+00 0.3184 0.1592
t+0.04518 0.01853+2.4390e+00 0.01953 0.009763


Multiple Linear Regression - Regression Statistics
Multiple R 0.9434
R-squared 0.89
Adjusted R-squared 0.8409
F-TEST (value) 18.09
F-TEST (DF numerator)17
F-TEST (DF denominator)38
p-value 3.245e-13
Multiple Linear Regression - Residual Statistics
Residual Standard Deviation 1.298
Sum Squared Residuals 64.05

\begin{tabular}{lllllllll}
\hline
Multiple Linear Regression - Regression Statistics \tabularnewline
Multiple R &  0.9434 \tabularnewline
R-squared &  0.89 \tabularnewline
Adjusted R-squared &  0.8409 \tabularnewline
F-TEST (value) &  18.09 \tabularnewline
F-TEST (DF numerator) & 17 \tabularnewline
F-TEST (DF denominator) & 38 \tabularnewline
p-value &  3.245e-13 \tabularnewline
Multiple Linear Regression - Residual Statistics \tabularnewline
Residual Standard Deviation &  1.298 \tabularnewline
Sum Squared Residuals &  64.05 \tabularnewline
\hline
\end{tabular}
%Source: https://freestatistics.org/blog/index.php?pk=285139&T=3

[TABLE]
[ROW][C]Multiple Linear Regression - Regression Statistics[/C][/ROW]
[ROW][C]Multiple R[/C][C] 0.9434[/C][/ROW]
[ROW][C]R-squared[/C][C] 0.89[/C][/ROW]
[ROW][C]Adjusted R-squared[/C][C] 0.8409[/C][/ROW]
[ROW][C]F-TEST (value)[/C][C] 18.09[/C][/ROW]
[ROW][C]F-TEST (DF numerator)[/C][C]17[/C][/ROW]
[ROW][C]F-TEST (DF denominator)[/C][C]38[/C][/ROW]
[ROW][C]p-value[/C][C] 3.245e-13[/C][/ROW]
[ROW][C]Multiple Linear Regression - Residual Statistics[/C][/ROW]
[ROW][C]Residual Standard Deviation[/C][C] 1.298[/C][/ROW]
[ROW][C]Sum Squared Residuals[/C][C] 64.05[/C][/ROW]
[/TABLE]
Source: https://freestatistics.org/blog/index.php?pk=285139&T=3

Globally Unique Identifier (entire table): ba.freestatistics.org/blog/index.php?pk=285139&T=3

As an alternative you can also use a QR Code:  

The GUIDs for individual cells are displayed in the table below:

Multiple Linear Regression - Regression Statistics
Multiple R 0.9434
R-squared 0.89
Adjusted R-squared 0.8409
F-TEST (value) 18.09
F-TEST (DF numerator)17
F-TEST (DF denominator)38
p-value 3.245e-13
Multiple Linear Regression - Residual Statistics
Residual Standard Deviation 1.298
Sum Squared Residuals 64.05


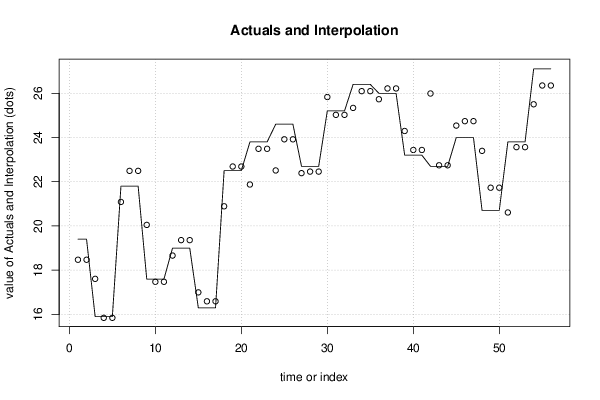
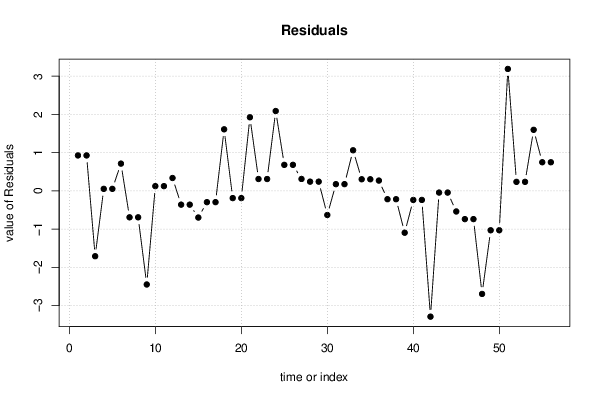
Multiple Linear Regression - Actuals, Interpolation, and Residuals
Time or IndexActualsInterpolationForecastResidualsPrediction Error
1 19.4 18.47 0.9273
2 19.4 18.47 0.9273
3 15.9 17.61-1.709
4 15.9 15.85 0.0535
5 15.9 15.85 0.0535
6 21.8 21.09 0.7132
7 21.8 22.49-0.6916
8 21.8 22.49-0.6916
9 17.6 20.05-2.448
10 17.6 17.48 0.1242
11 17.6 17.48 0.1242
12 19 18.66 0.337
13 19 19.36-0.36
14 19 19.36-0.36
15 16.3 17-0.6975
16 16.3 16.59-0.2946
17 16.3 16.59-0.2946
18 22.5 20.89 1.61
19 22.5 22.69-0.1888
20 22.5 22.69-0.1888
21 23.8 21.88 1.925
22 23.8 23.49 0.3105
23 23.8 23.49 0.3105
24 24.6 22.51 2.089
25 24.6 23.92 0.6809
26 24.6 23.92 0.6809
27 22.7 22.39 0.3118
28 22.7 22.46 0.2415
29 22.7 22.46 0.2415
30 25.2 25.83-0.6308
31 25.2 25.02 0.1758
32 25.2 25.02 0.1758
33 26.4 25.34 1.062
34 26.4 26.1 0.304
35 26.4 26.1 0.304
36 26 25.73 0.2695
37 26 26.22-0.2181
38 26 26.22-0.2181
39 23.2 24.29-1.095
40 23.2 23.44-0.2367
41 23.2 23.44-0.2367
42 22.7 25.99-3.29
43 22.7 22.74-0.04405
44 22.7 22.74-0.04405
45 24 24.54-0.5389
46 24 24.74-0.7386
47 24 24.74-0.7386
48 20.7 23.4-2.696
49 20.7 21.73-1.03
50 20.7 21.73-1.03
51 23.8 20.61 3.19
52 23.8 23.56 0.2363
53 23.8 23.56 0.2363
54 27.1 25.5 1.598
55 27.1 26.35 0.7487
56 27.1 26.35 0.7487

\begin{tabular}{lllllllll}
\hline
Multiple Linear Regression - Actuals, Interpolation, and Residuals \tabularnewline
Time or Index & Actuals & InterpolationForecast & ResidualsPrediction Error \tabularnewline
1 &  19.4 &  18.47 &  0.9273 \tabularnewline
2 &  19.4 &  18.47 &  0.9273 \tabularnewline
3 &  15.9 &  17.61 & -1.709 \tabularnewline
4 &  15.9 &  15.85 &  0.0535 \tabularnewline
5 &  15.9 &  15.85 &  0.0535 \tabularnewline
6 &  21.8 &  21.09 &  0.7132 \tabularnewline
7 &  21.8 &  22.49 & -0.6916 \tabularnewline
8 &  21.8 &  22.49 & -0.6916 \tabularnewline
9 &  17.6 &  20.05 & -2.448 \tabularnewline
10 &  17.6 &  17.48 &  0.1242 \tabularnewline
11 &  17.6 &  17.48 &  0.1242 \tabularnewline
12 &  19 &  18.66 &  0.337 \tabularnewline
13 &  19 &  19.36 & -0.36 \tabularnewline
14 &  19 &  19.36 & -0.36 \tabularnewline
15 &  16.3 &  17 & -0.6975 \tabularnewline
16 &  16.3 &  16.59 & -0.2946 \tabularnewline
17 &  16.3 &  16.59 & -0.2946 \tabularnewline
18 &  22.5 &  20.89 &  1.61 \tabularnewline
19 &  22.5 &  22.69 & -0.1888 \tabularnewline
20 &  22.5 &  22.69 & -0.1888 \tabularnewline
21 &  23.8 &  21.88 &  1.925 \tabularnewline
22 &  23.8 &  23.49 &  0.3105 \tabularnewline
23 &  23.8 &  23.49 &  0.3105 \tabularnewline
24 &  24.6 &  22.51 &  2.089 \tabularnewline
25 &  24.6 &  23.92 &  0.6809 \tabularnewline
26 &  24.6 &  23.92 &  0.6809 \tabularnewline
27 &  22.7 &  22.39 &  0.3118 \tabularnewline
28 &  22.7 &  22.46 &  0.2415 \tabularnewline
29 &  22.7 &  22.46 &  0.2415 \tabularnewline
30 &  25.2 &  25.83 & -0.6308 \tabularnewline
31 &  25.2 &  25.02 &  0.1758 \tabularnewline
32 &  25.2 &  25.02 &  0.1758 \tabularnewline
33 &  26.4 &  25.34 &  1.062 \tabularnewline
34 &  26.4 &  26.1 &  0.304 \tabularnewline
35 &  26.4 &  26.1 &  0.304 \tabularnewline
36 &  26 &  25.73 &  0.2695 \tabularnewline
37 &  26 &  26.22 & -0.2181 \tabularnewline
38 &  26 &  26.22 & -0.2181 \tabularnewline
39 &  23.2 &  24.29 & -1.095 \tabularnewline
40 &  23.2 &  23.44 & -0.2367 \tabularnewline
41 &  23.2 &  23.44 & -0.2367 \tabularnewline
42 &  22.7 &  25.99 & -3.29 \tabularnewline
43 &  22.7 &  22.74 & -0.04405 \tabularnewline
44 &  22.7 &  22.74 & -0.04405 \tabularnewline
45 &  24 &  24.54 & -0.5389 \tabularnewline
46 &  24 &  24.74 & -0.7386 \tabularnewline
47 &  24 &  24.74 & -0.7386 \tabularnewline
48 &  20.7 &  23.4 & -2.696 \tabularnewline
49 &  20.7 &  21.73 & -1.03 \tabularnewline
50 &  20.7 &  21.73 & -1.03 \tabularnewline
51 &  23.8 &  20.61 &  3.19 \tabularnewline
52 &  23.8 &  23.56 &  0.2363 \tabularnewline
53 &  23.8 &  23.56 &  0.2363 \tabularnewline
54 &  27.1 &  25.5 &  1.598 \tabularnewline
55 &  27.1 &  26.35 &  0.7487 \tabularnewline
56 &  27.1 &  26.35 &  0.7487 \tabularnewline
\hline
\end{tabular}
%Source: https://freestatistics.org/blog/index.php?pk=285139&T=4

[TABLE]
[ROW][C]Multiple Linear Regression - Actuals, Interpolation, and Residuals[/C][/ROW]
[ROW][C]Time or Index[/C][C]Actuals[/C][C]InterpolationForecast[/C][C]ResidualsPrediction Error[/C][/ROW]
[ROW][C]1[/C][C] 19.4[/C][C] 18.47[/C][C] 0.9273[/C][/ROW]
[ROW][C]2[/C][C] 19.4[/C][C] 18.47[/C][C] 0.9273[/C][/ROW]
[ROW][C]3[/C][C] 15.9[/C][C] 17.61[/C][C]-1.709[/C][/ROW]
[ROW][C]4[/C][C] 15.9[/C][C] 15.85[/C][C] 0.0535[/C][/ROW]
[ROW][C]5[/C][C] 15.9[/C][C] 15.85[/C][C] 0.0535[/C][/ROW]
[ROW][C]6[/C][C] 21.8[/C][C] 21.09[/C][C] 0.7132[/C][/ROW]
[ROW][C]7[/C][C] 21.8[/C][C] 22.49[/C][C]-0.6916[/C][/ROW]
[ROW][C]8[/C][C] 21.8[/C][C] 22.49[/C][C]-0.6916[/C][/ROW]
[ROW][C]9[/C][C] 17.6[/C][C] 20.05[/C][C]-2.448[/C][/ROW]
[ROW][C]10[/C][C] 17.6[/C][C] 17.48[/C][C] 0.1242[/C][/ROW]
[ROW][C]11[/C][C] 17.6[/C][C] 17.48[/C][C] 0.1242[/C][/ROW]
[ROW][C]12[/C][C] 19[/C][C] 18.66[/C][C] 0.337[/C][/ROW]
[ROW][C]13[/C][C] 19[/C][C] 19.36[/C][C]-0.36[/C][/ROW]
[ROW][C]14[/C][C] 19[/C][C] 19.36[/C][C]-0.36[/C][/ROW]
[ROW][C]15[/C][C] 16.3[/C][C] 17[/C][C]-0.6975[/C][/ROW]
[ROW][C]16[/C][C] 16.3[/C][C] 16.59[/C][C]-0.2946[/C][/ROW]
[ROW][C]17[/C][C] 16.3[/C][C] 16.59[/C][C]-0.2946[/C][/ROW]
[ROW][C]18[/C][C] 22.5[/C][C] 20.89[/C][C] 1.61[/C][/ROW]
[ROW][C]19[/C][C] 22.5[/C][C] 22.69[/C][C]-0.1888[/C][/ROW]
[ROW][C]20[/C][C] 22.5[/C][C] 22.69[/C][C]-0.1888[/C][/ROW]
[ROW][C]21[/C][C] 23.8[/C][C] 21.88[/C][C] 1.925[/C][/ROW]
[ROW][C]22[/C][C] 23.8[/C][C] 23.49[/C][C] 0.3105[/C][/ROW]
[ROW][C]23[/C][C] 23.8[/C][C] 23.49[/C][C] 0.3105[/C][/ROW]
[ROW][C]24[/C][C] 24.6[/C][C] 22.51[/C][C] 2.089[/C][/ROW]
[ROW][C]25[/C][C] 24.6[/C][C] 23.92[/C][C] 0.6809[/C][/ROW]
[ROW][C]26[/C][C] 24.6[/C][C] 23.92[/C][C] 0.6809[/C][/ROW]
[ROW][C]27[/C][C] 22.7[/C][C] 22.39[/C][C] 0.3118[/C][/ROW]
[ROW][C]28[/C][C] 22.7[/C][C] 22.46[/C][C] 0.2415[/C][/ROW]
[ROW][C]29[/C][C] 22.7[/C][C] 22.46[/C][C] 0.2415[/C][/ROW]
[ROW][C]30[/C][C] 25.2[/C][C] 25.83[/C][C]-0.6308[/C][/ROW]
[ROW][C]31[/C][C] 25.2[/C][C] 25.02[/C][C] 0.1758[/C][/ROW]
[ROW][C]32[/C][C] 25.2[/C][C] 25.02[/C][C] 0.1758[/C][/ROW]
[ROW][C]33[/C][C] 26.4[/C][C] 25.34[/C][C] 1.062[/C][/ROW]
[ROW][C]34[/C][C] 26.4[/C][C] 26.1[/C][C] 0.304[/C][/ROW]
[ROW][C]35[/C][C] 26.4[/C][C] 26.1[/C][C] 0.304[/C][/ROW]
[ROW][C]36[/C][C] 26[/C][C] 25.73[/C][C] 0.2695[/C][/ROW]
[ROW][C]37[/C][C] 26[/C][C] 26.22[/C][C]-0.2181[/C][/ROW]
[ROW][C]38[/C][C] 26[/C][C] 26.22[/C][C]-0.2181[/C][/ROW]
[ROW][C]39[/C][C] 23.2[/C][C] 24.29[/C][C]-1.095[/C][/ROW]
[ROW][C]40[/C][C] 23.2[/C][C] 23.44[/C][C]-0.2367[/C][/ROW]
[ROW][C]41[/C][C] 23.2[/C][C] 23.44[/C][C]-0.2367[/C][/ROW]
[ROW][C]42[/C][C] 22.7[/C][C] 25.99[/C][C]-3.29[/C][/ROW]
[ROW][C]43[/C][C] 22.7[/C][C] 22.74[/C][C]-0.04405[/C][/ROW]
[ROW][C]44[/C][C] 22.7[/C][C] 22.74[/C][C]-0.04405[/C][/ROW]
[ROW][C]45[/C][C] 24[/C][C] 24.54[/C][C]-0.5389[/C][/ROW]
[ROW][C]46[/C][C] 24[/C][C] 24.74[/C][C]-0.7386[/C][/ROW]
[ROW][C]47[/C][C] 24[/C][C] 24.74[/C][C]-0.7386[/C][/ROW]
[ROW][C]48[/C][C] 20.7[/C][C] 23.4[/C][C]-2.696[/C][/ROW]
[ROW][C]49[/C][C] 20.7[/C][C] 21.73[/C][C]-1.03[/C][/ROW]
[ROW][C]50[/C][C] 20.7[/C][C] 21.73[/C][C]-1.03[/C][/ROW]
[ROW][C]51[/C][C] 23.8[/C][C] 20.61[/C][C] 3.19[/C][/ROW]
[ROW][C]52[/C][C] 23.8[/C][C] 23.56[/C][C] 0.2363[/C][/ROW]
[ROW][C]53[/C][C] 23.8[/C][C] 23.56[/C][C] 0.2363[/C][/ROW]
[ROW][C]54[/C][C] 27.1[/C][C] 25.5[/C][C] 1.598[/C][/ROW]
[ROW][C]55[/C][C] 27.1[/C][C] 26.35[/C][C] 0.7487[/C][/ROW]
[ROW][C]56[/C][C] 27.1[/C][C] 26.35[/C][C] 0.7487[/C][/ROW]
[/TABLE]
Source: https://freestatistics.org/blog/index.php?pk=285139&T=4

Globally Unique Identifier (entire table): ba.freestatistics.org/blog/index.php?pk=285139&T=4

As an alternative you can also use a QR Code:  

The GUIDs for individual cells are displayed in the table below:

Multiple Linear Regression - Actuals, Interpolation, and Residuals
Time or IndexActualsInterpolationForecastResidualsPrediction Error
1 19.4 18.47 0.9273
2 19.4 18.47 0.9273
3 15.9 17.61-1.709
4 15.9 15.85 0.0535
5 15.9 15.85 0.0535
6 21.8 21.09 0.7132
7 21.8 22.49-0.6916
8 21.8 22.49-0.6916
9 17.6 20.05-2.448
10 17.6 17.48 0.1242
11 17.6 17.48 0.1242
12 19 18.66 0.337
13 19 19.36-0.36
14 19 19.36-0.36
15 16.3 17-0.6975
16 16.3 16.59-0.2946
17 16.3 16.59-0.2946
18 22.5 20.89 1.61
19 22.5 22.69-0.1888
20 22.5 22.69-0.1888
21 23.8 21.88 1.925
22 23.8 23.49 0.3105
23 23.8 23.49 0.3105
24 24.6 22.51 2.089
25 24.6 23.92 0.6809
26 24.6 23.92 0.6809
27 22.7 22.39 0.3118
28 22.7 22.46 0.2415
29 22.7 22.46 0.2415
30 25.2 25.83-0.6308
31 25.2 25.02 0.1758
32 25.2 25.02 0.1758
33 26.4 25.34 1.062
34 26.4 26.1 0.304
35 26.4 26.1 0.304
36 26 25.73 0.2695
37 26 26.22-0.2181
38 26 26.22-0.2181
39 23.2 24.29-1.095
40 23.2 23.44-0.2367
41 23.2 23.44-0.2367
42 22.7 25.99-3.29
43 22.7 22.74-0.04405
44 22.7 22.74-0.04405
45 24 24.54-0.5389
46 24 24.74-0.7386
47 24 24.74-0.7386
48 20.7 23.4-2.696
49 20.7 21.73-1.03
50 20.7 21.73-1.03
51 23.8 20.61 3.19
52 23.8 23.56 0.2363
53 23.8 23.56 0.2363
54 27.1 25.5 1.598
55 27.1 26.35 0.7487
56 27.1 26.35 0.7487


Goldfeld-Quandt test for Heteroskedasticity
p-valuesAlternative Hypothesis
breakpoint indexgreater2-sidedless
21 0.1067 0.2134 0.8933
22 0.09854 0.1971 0.9015
23 0.03949 0.07898 0.9605
24 0.04763 0.09526 0.9524
25 0.129 0.258 0.871
26 0.1006 0.2012 0.8994
27 0.07022 0.1404 0.9298
28 0.04408 0.08816 0.9559
29 0.02433 0.04865 0.9757
30 0.03441 0.06883 0.9656
31 0.01659 0.03318 0.9834
32 0.007401 0.0148 0.9926
33 0.003421 0.006843 0.9966
34 0.002277 0.004554 0.9977
35 1 8.068e-42 4.034e-42

\begin{tabular}{lllllllll}
\hline
Goldfeld-Quandt test for Heteroskedasticity \tabularnewline
p-values & Alternative Hypothesis \tabularnewline
breakpoint index & greater & 2-sided & less \tabularnewline
21 &  0.1067 &  0.2134 &  0.8933 \tabularnewline
22 &  0.09854 &  0.1971 &  0.9015 \tabularnewline
23 &  0.03949 &  0.07898 &  0.9605 \tabularnewline
24 &  0.04763 &  0.09526 &  0.9524 \tabularnewline
25 &  0.129 &  0.258 &  0.871 \tabularnewline
26 &  0.1006 &  0.2012 &  0.8994 \tabularnewline
27 &  0.07022 &  0.1404 &  0.9298 \tabularnewline
28 &  0.04408 &  0.08816 &  0.9559 \tabularnewline
29 &  0.02433 &  0.04865 &  0.9757 \tabularnewline
30 &  0.03441 &  0.06883 &  0.9656 \tabularnewline
31 &  0.01659 &  0.03318 &  0.9834 \tabularnewline
32 &  0.007401 &  0.0148 &  0.9926 \tabularnewline
33 &  0.003421 &  0.006843 &  0.9966 \tabularnewline
34 &  0.002277 &  0.004554 &  0.9977 \tabularnewline
35 &  1 &  8.068e-42 &  4.034e-42 \tabularnewline
\hline
\end{tabular}
%Source: https://freestatistics.org/blog/index.php?pk=285139&T=5

[TABLE]
[ROW][C]Goldfeld-Quandt test for Heteroskedasticity[/C][/ROW]
[ROW][C]p-values[/C][C]Alternative Hypothesis[/C][/ROW]
[ROW][C]breakpoint index[/C][C]greater[/C][C]2-sided[/C][C]less[/C][/ROW]
[ROW][C]21[/C][C] 0.1067[/C][C] 0.2134[/C][C] 0.8933[/C][/ROW]
[ROW][C]22[/C][C] 0.09854[/C][C] 0.1971[/C][C] 0.9015[/C][/ROW]
[ROW][C]23[/C][C] 0.03949[/C][C] 0.07898[/C][C] 0.9605[/C][/ROW]
[ROW][C]24[/C][C] 0.04763[/C][C] 0.09526[/C][C] 0.9524[/C][/ROW]
[ROW][C]25[/C][C] 0.129[/C][C] 0.258[/C][C] 0.871[/C][/ROW]
[ROW][C]26[/C][C] 0.1006[/C][C] 0.2012[/C][C] 0.8994[/C][/ROW]
[ROW][C]27[/C][C] 0.07022[/C][C] 0.1404[/C][C] 0.9298[/C][/ROW]
[ROW][C]28[/C][C] 0.04408[/C][C] 0.08816[/C][C] 0.9559[/C][/ROW]
[ROW][C]29[/C][C] 0.02433[/C][C] 0.04865[/C][C] 0.9757[/C][/ROW]
[ROW][C]30[/C][C] 0.03441[/C][C] 0.06883[/C][C] 0.9656[/C][/ROW]
[ROW][C]31[/C][C] 0.01659[/C][C] 0.03318[/C][C] 0.9834[/C][/ROW]
[ROW][C]32[/C][C] 0.007401[/C][C] 0.0148[/C][C] 0.9926[/C][/ROW]
[ROW][C]33[/C][C] 0.003421[/C][C] 0.006843[/C][C] 0.9966[/C][/ROW]
[ROW][C]34[/C][C] 0.002277[/C][C] 0.004554[/C][C] 0.9977[/C][/ROW]
[ROW][C]35[/C][C] 1[/C][C] 8.068e-42[/C][C] 4.034e-42[/C][/ROW]
[/TABLE]
Source: https://freestatistics.org/blog/index.php?pk=285139&T=5

Globally Unique Identifier (entire table): ba.freestatistics.org/blog/index.php?pk=285139&T=5

As an alternative you can also use a QR Code:  

The GUIDs for individual cells are displayed in the table below:

Goldfeld-Quandt test for Heteroskedasticity
p-valuesAlternative Hypothesis
breakpoint indexgreater2-sidedless
21 0.1067 0.2134 0.8933
22 0.09854 0.1971 0.9015
23 0.03949 0.07898 0.9605
24 0.04763 0.09526 0.9524
25 0.129 0.258 0.871
26 0.1006 0.2012 0.8994
27 0.07022 0.1404 0.9298
28 0.04408 0.08816 0.9559
29 0.02433 0.04865 0.9757
30 0.03441 0.06883 0.9656
31 0.01659 0.03318 0.9834
32 0.007401 0.0148 0.9926
33 0.003421 0.006843 0.9966
34 0.002277 0.004554 0.9977
35 1 8.068e-42 4.034e-42


Meta Analysis of Goldfeld-Quandt test for Heteroskedasticity
Description# significant tests% significant testsOK/NOK
1% type I error level3 0.2NOK
5% type I error level60.4NOK
10% type I error level100.666667NOK

\begin{tabular}{lllllllll}
\hline
Meta Analysis of Goldfeld-Quandt test for Heteroskedasticity \tabularnewline
Description & # significant tests & % significant tests & OK/NOK \tabularnewline
1% type I error level & 3 &  0.2 & NOK \tabularnewline
5% type I error level & 6 & 0.4 & NOK \tabularnewline
10% type I error level & 10 & 0.666667 & NOK \tabularnewline
\hline
\end{tabular}
%Source: https://freestatistics.org/blog/index.php?pk=285139&T=6

[TABLE]
[ROW][C]Meta Analysis of Goldfeld-Quandt test for Heteroskedasticity[/C][/ROW]
[ROW][C]Description[/C][C]# significant tests[/C][C]% significant tests[/C][C]OK/NOK[/C][/ROW]
[ROW][C]1% type I error level[/C][C]3[/C][C] 0.2[/C][C]NOK[/C][/ROW]
[ROW][C]5% type I error level[/C][C]6[/C][C]0.4[/C][C]NOK[/C][/ROW]
[ROW][C]10% type I error level[/C][C]10[/C][C]0.666667[/C][C]NOK[/C][/ROW]
[/TABLE]
Source: https://freestatistics.org/blog/index.php?pk=285139&T=6

Globally Unique Identifier (entire table): ba.freestatistics.org/blog/index.php?pk=285139&T=6

As an alternative you can also use a QR Code:  

The GUIDs for individual cells are displayed in the table below:

Meta Analysis of Goldfeld-Quandt test for Heteroskedasticity
Description# significant tests% significant testsOK/NOK
1% type I error level3 0.2NOK
5% type I error level60.4NOK
10% type I error level100.666667NOK


Parameters (Session):
Parameters (R input):
par1 = ; par2 = Include Monthly Dummies ; par3 = Linear Trend ; par4 = 4 ; par5 = ;
R code (references can be found in the software module):
library(lattice)
library(lmtest)
n25 <- 25 #minimum number of obs. for Goldfeld-Quandt test
mywarning <- ''
par1 <- as.numeric(par1)
if(is.na(par1)) {
par1 <- 1
mywarning = 'Warning: you did not specify the column number of the endogenous series! The first column was selected by default.'
}
if (par4=='') par4 <- 0
par4 <- as.numeric(par4)
if (par5=='') par5 <- 0
par5 <- as.numeric(par5)
x <- na.omit(t(y))
k <- length(x[1,])
n <- length(x[,1])
x1 <- cbind(x[,par1], x[,1:k!=par1])
mycolnames <- c(colnames(x)[par1], colnames(x)[1:k!=par1])
colnames(x1) <- mycolnames #colnames(x)[par1]
x <- x1
if (par3 == 'First Differences'){
x2 <- array(0, dim=c(n-1,k), dimnames=list(1:(n-1), paste('(1-B)',colnames(x),sep='')))
for (i in 1:n-1) {
for (j in 1:k) {
x2[i,j] <- x[i+1,j] - x[i,j]
}
}
x <- x2
}
if(par4 > 0) {
x2 <- array(0, dim=c(n-par4,par4), dimnames=list(1:(n-par4), paste(colnames(x)[par1],'(t-',1:par4,')',sep='')))
for (i in 1:(n-par4)) {
for (j in 1:par4) {
x2[i,j] <- x[i+par4-j,par1]
}
}
x <- cbind(x[(par4+1):n,], x2)
n <- n - par4
}
if (par2 == 'Include Monthly Dummies'){
x2 <- array(0, dim=c(n,11), dimnames=list(1:n, paste('M', seq(1:11), sep ='')))
for (i in 1:11){
x2[seq(i,n,12),i] <- 1
}
x <- cbind(x, x2)
}
if (par2 == 'Include Quarterly Dummies'){
x2 <- array(0, dim=c(n,3), dimnames=list(1:n, paste('Q', seq(1:3), sep ='')))
for (i in 1:3){
x2[seq(i,n,4),i] <- 1
}
x <- cbind(x, x2)
}
k <- length(x[1+par4,])
if (par3 == 'Linear Trend'){
x <- cbind(x, c(1:n))
colnames(x)[k+1] <- 't'
}
x
k <- length(x[1+par4,])
df <- as.data.frame(x)
(mylm <- lm(df))
(mysum <- summary(mylm))
if (n > n25) {
kp3 <- k + 3
nmkm3 <- n - k - 3
gqarr <- array(NA, dim=c(nmkm3-kp3+1,3))
numgqtests <- 0
numsignificant1 <- 0
numsignificant5 <- 0
numsignificant10 <- 0
for (mypoint in kp3:nmkm3) {
j <- 0
numgqtests <- numgqtests + 1
for (myalt in c('greater', 'two.sided', 'less')) {
j <- j + 1
gqarr[mypoint-kp3+1,j] <- gqtest(mylm, point=mypoint, alternative=myalt)$p.value
}
if (gqarr[mypoint-kp3+1,2] < 0.01) numsignificant1 <- numsignificant1 + 1
if (gqarr[mypoint-kp3+1,2] < 0.05) numsignificant5 <- numsignificant5 + 1
if (gqarr[mypoint-kp3+1,2] < 0.10) numsignificant10 <- numsignificant10 + 1
}
gqarr
}
bitmap(file='test0.png')
plot(x[,1], type='l', main='Actuals and Interpolation', ylab='value of Actuals and Interpolation (dots)', xlab='time or index')
points(x[,1]-mysum$resid)
grid()
dev.off()
bitmap(file='test1.png')
plot(mysum$resid, type='b', pch=19, main='Residuals', ylab='value of Residuals', xlab='time or index')
grid()
dev.off()
bitmap(file='test2.png')
hist(mysum$resid, main='Residual Histogram', xlab='values of Residuals')
grid()
dev.off()
bitmap(file='test3.png')
densityplot(~mysum$resid,col='black',main='Residual Density Plot', xlab='values of Residuals')
dev.off()
bitmap(file='test4.png')
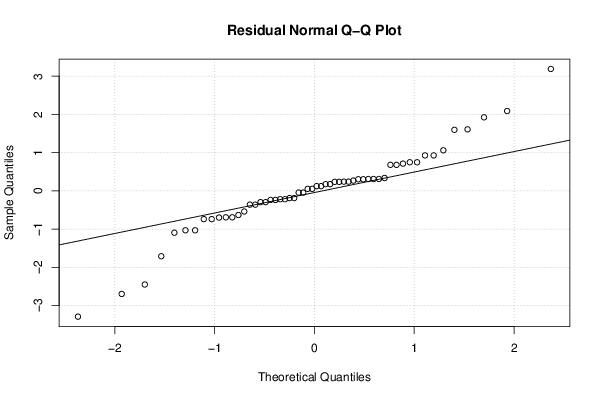
qqnorm(mysum$resid, main='Residual Normal Q-Q Plot')
qqline(mysum$resid)
grid()
dev.off()
(myerror <- as.ts(mysum$resid))
bitmap(file='test5.png')
dum <- cbind(lag(myerror,k=1),myerror)
dum
dum1 <- dum[2:length(myerror),]
dum1
z <- as.data.frame(dum1)
z
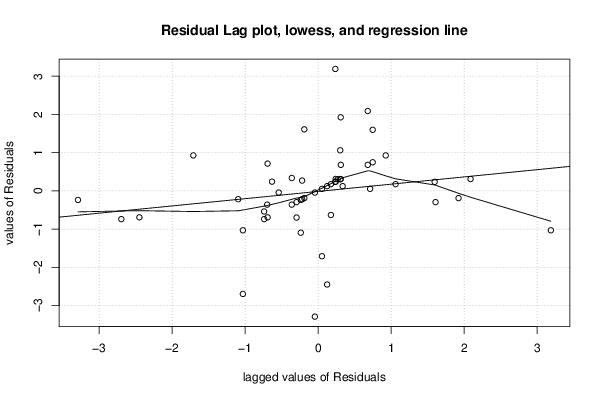
plot(z,main=paste('Residual Lag plot, lowess, and regression line'), ylab='values of Residuals', xlab='lagged values of Residuals')
lines(lowess(z))
abline(lm(z))
grid()
dev.off()
bitmap(file='test6.png')
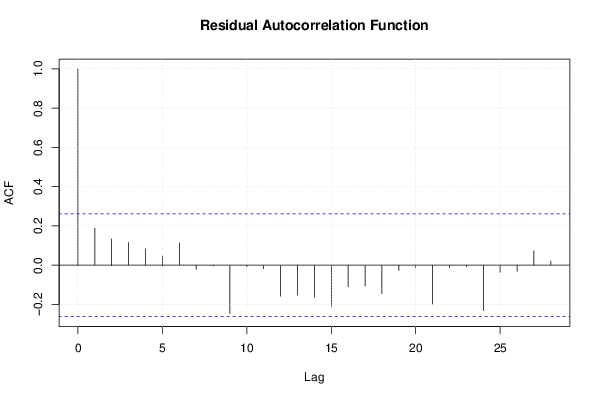
acf(mysum$resid, lag.max=length(mysum$resid)/2, main='Residual Autocorrelation Function')
grid()
dev.off()
bitmap(file='test7.png')
pacf(mysum$resid, lag.max=length(mysum$resid)/2, main='Residual Partial Autocorrelation Function')
grid()
dev.off()
bitmap(file='test8.png')
opar <- par(mfrow = c(2,2), oma = c(0, 0, 1.1, 0))
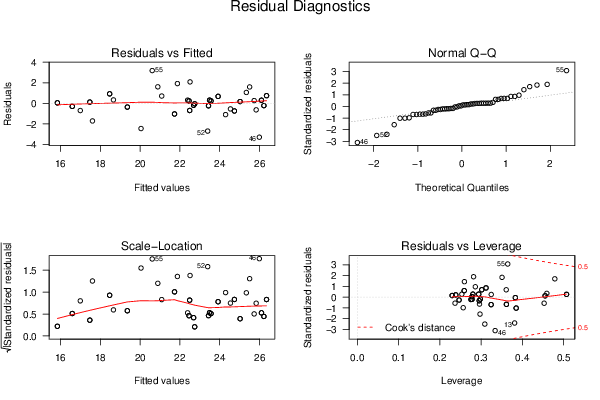
plot(mylm, las = 1, sub='Residual Diagnostics')
par(opar)
dev.off()
if (n > n25) {
bitmap(file='test9.png')
plot(kp3:nmkm3,gqarr[,2], main='Goldfeld-Quandt test',ylab='2-sided p-value',xlab='breakpoint')
grid()
dev.off()
}
load(file='createtable')
a<-table.start()
a<-table.row.start(a)
a<-table.element(a, 'Multiple Linear Regression - Estimated Regression Equation', 1, TRUE)
a<-table.row.end(a)
myeq <- colnames(x)[1]
myeq <- paste(myeq, '[t] = ', sep='')
for (i in 1:k){
if (mysum$coefficients[i,1] > 0) myeq <- paste(myeq, '+', '')
myeq <- paste(myeq, signif(mysum$coefficients[i,1],6), sep=' ')
if (rownames(mysum$coefficients)[i] != '(Intercept)') {
myeq <- paste(myeq, rownames(mysum$coefficients)[i], sep='')
if (rownames(mysum$coefficients)[i] != 't') myeq <- paste(myeq, '[t]', sep='')
}
}
myeq <- paste(myeq, ' + e[t]')
a<-table.row.start(a)
a<-table.element(a, myeq)
a<-table.row.end(a)
a<-table.row.start(a)
a<-table.element(a, mywarning)
a<-table.row.end(a)
a<-table.end(a)
table.save(a,file='mytable1.tab')
a<-table.start()
a<-table.row.start(a)
a<-table.element(a,hyperlink('ols1.htm','Multiple Linear Regression - Ordinary Least Squares',''), 6, TRUE)
a<-table.row.end(a)
a<-table.row.start(a)
a<-table.element(a,'Variable',header=TRUE)
a<-table.element(a,'Parameter',header=TRUE)
a<-table.element(a,'S.D.',header=TRUE)
a<-table.element(a,'T-STAT
H0: parameter = 0',header=TRUE)
a<-table.element(a,'2-tail p-value',header=TRUE)
a<-table.element(a,'1-tail p-value',header=TRUE)
a<-table.row.end(a)
for (i in 1:k){
a<-table.row.start(a)
a<-table.element(a,rownames(mysum$coefficients)[i],header=TRUE)
a<-table.element(a,formatC(signif(mysum$coefficients[i,1],5),format='g',flag='+'))
a<-table.element(a,formatC(signif(mysum$coefficients[i,2],5),format='g',flag=' '))
a<-table.element(a,formatC(signif(mysum$coefficients[i,3],4),format='e',flag='+'))
a<-table.element(a,formatC(signif(mysum$coefficients[i,4],4),format='g',flag=' '))
a<-table.element(a,formatC(signif(mysum$coefficients[i,4]/2,4),format='g',flag=' '))
a<-table.row.end(a)
}
a<-table.end(a)
table.save(a,file='mytable2.tab')
a<-table.start()
a<-table.row.start(a)
a<-table.element(a, 'Multiple Linear Regression - Regression Statistics', 2, TRUE)
a<-table.row.end(a)
a<-table.row.start(a)
a<-table.element(a, 'Multiple R',1,TRUE)
a<-table.element(a,formatC(signif(sqrt(mysum$r.squared),6),format='g',flag=' '))
a<-table.row.end(a)
a<-table.row.start(a)
a<-table.element(a, 'R-squared',1,TRUE)
a<-table.element(a,formatC(signif(mysum$r.squared,6),format='g',flag=' '))
a<-table.row.end(a)
a<-table.row.start(a)
a<-table.element(a, 'Adjusted R-squared',1,TRUE)
a<-table.element(a,formatC(signif(mysum$adj.r.squared,6),format='g',flag=' '))
a<-table.row.end(a)
a<-table.row.start(a)
a<-table.element(a, 'F-TEST (value)',1,TRUE)
a<-table.element(a,formatC(signif(mysum$fstatistic[1],6),format='g',flag=' '))
a<-table.row.end(a)
a<-table.row.start(a)
a<-table.element(a, 'F-TEST (DF numerator)',1,TRUE)
a<-table.element(a, signif(mysum$fstatistic[2],6))
a<-table.row.end(a)
a<-table.row.start(a)
a<-table.element(a, 'F-TEST (DF denominator)',1,TRUE)
a<-table.element(a, signif(mysum$fstatistic[3],6))
a<-table.row.end(a)
a<-table.row.start(a)
a<-table.element(a, 'p-value',1,TRUE)
a<-table.element(a,formatC(signif(1-pf(mysum$fstatistic[1],mysum$fstatistic[2],mysum$fstatistic[3]),6),format='g',flag=' '))
a<-table.row.end(a)
a<-table.row.start(a)
a<-table.element(a, 'Multiple Linear Regression - Residual Statistics', 2, TRUE)
a<-table.row.end(a)
a<-table.row.start(a)
a<-table.element(a, 'Residual Standard Deviation',1,TRUE)
a<-table.element(a,formatC(signif(mysum$sigma,6),format='g',flag=' '))
a<-table.row.end(a)
a<-table.row.start(a)
a<-table.element(a, 'Sum Squared Residuals',1,TRUE)
a<-table.element(a,formatC(signif(sum(myerror*myerror),6),format='g',flag=' '))
a<-table.row.end(a)
a<-table.end(a)
table.save(a,file='mytable3.tab')
if(n < 200) {
a<-table.start()
a<-table.row.start(a)
a<-table.element(a, 'Multiple Linear Regression - Actuals, Interpolation, and Residuals', 4, TRUE)
a<-table.row.end(a)
a<-table.row.start(a)
a<-table.element(a, 'Time or Index', 1, TRUE)
a<-table.element(a, 'Actuals', 1, TRUE)
a<-table.element(a, 'Interpolation
Forecast', 1, TRUE)
a<-table.element(a, 'Residuals
Prediction Error', 1, TRUE)
a<-table.row.end(a)
for (i in 1:n) {
a<-table.row.start(a)
a<-table.element(a,i, 1, TRUE)
a<-table.element(a,formatC(signif(x[i],6),format='g',flag=' '))
a<-table.element(a,formatC(signif(x[i]-mysum$resid[i],6),format='g',flag=' '))
a<-table.element(a,formatC(signif(mysum$resid[i],6),format='g',flag=' '))
a<-table.row.end(a)
}
a<-table.end(a)
table.save(a,file='mytable4.tab')
if (n > n25) {
a<-table.start()
a<-table.row.start(a)
a<-table.element(a,'Goldfeld-Quandt test for Heteroskedasticity',4,TRUE)
a<-table.row.end(a)
a<-table.row.start(a)
a<-table.element(a,'p-values',header=TRUE)
a<-table.element(a,'Alternative Hypothesis',3,header=TRUE)
a<-table.row.end(a)
a<-table.row.start(a)
a<-table.element(a,'breakpoint index',header=TRUE)
a<-table.element(a,'greater',header=TRUE)
a<-table.element(a,'2-sided',header=TRUE)
a<-table.element(a,'less',header=TRUE)
a<-table.row.end(a)
for (mypoint in kp3:nmkm3) {
a<-table.row.start(a)
a<-table.element(a,mypoint,header=TRUE)
a<-table.element(a,formatC(signif(gqarr[mypoint-kp3+1,1],6),format='g',flag=' '))
a<-table.element(a,formatC(signif(gqarr[mypoint-kp3+1,2],6),format='g',flag=' '))
a<-table.element(a,formatC(signif(gqarr[mypoint-kp3+1,3],6),format='g',flag=' '))
a<-table.row.end(a)
}
a<-table.end(a)
table.save(a,file='mytable5.tab')
a<-table.start()
a<-table.row.start(a)
a<-table.element(a,'Meta Analysis of Goldfeld-Quandt test for Heteroskedasticity',4,TRUE)
a<-table.row.end(a)
a<-table.row.start(a)
a<-table.element(a,'Description',header=TRUE)
a<-table.element(a,'# significant tests',header=TRUE)
a<-table.element(a,'% significant tests',header=TRUE)
a<-table.element(a,'OK/NOK',header=TRUE)
a<-table.row.end(a)
a<-table.row.start(a)
a<-table.element(a,'1% type I error level',header=TRUE)
a<-table.element(a,signif(numsignificant1,6))
a<-table.element(a,formatC(signif(numsignificant1/numgqtests,6),format='g',flag=' '))
if (numsignificant1/numgqtests < 0.01) dum <- 'OK' else dum <- 'NOK'
a<-table.element(a,dum)
a<-table.row.end(a)
a<-table.row.start(a)
a<-table.element(a,'5% type I error level',header=TRUE)
a<-table.element(a,signif(numsignificant5,6))
a<-table.element(a,signif(numsignificant5/numgqtests,6))
if (numsignificant5/numgqtests < 0.05) dum <- 'OK' else dum <- 'NOK'
a<-table.element(a,dum)
a<-table.row.end(a)
a<-table.row.start(a)
a<-table.element(a,'10% type I error level',header=TRUE)
a<-table.element(a,signif(numsignificant10,6))
a<-table.element(a,signif(numsignificant10/numgqtests,6))
if (numsignificant10/numgqtests < 0.1) dum <- 'OK' else dum <- 'NOK'
a<-table.element(a,dum)
a<-table.row.end(a)
a<-table.end(a)
table.save(a,file='mytable6.tab')
}
}