Free Statistics

of Irreproducible Research!

Author's title

Author*The author of this computation has been verified*
R Software Modulerwasp_twosampletests_mean.wasp
Title produced by softwarePaired and Unpaired Two Samples Tests about the Mean
Date of computationFri, 04 Dec 2015 14:14:48 +0000
Cite this page as followsStatistical Computations at FreeStatistics.org, Office for Research Development and Education, URL https://freestatistics.org/blog/index.php?v=date/2015/Dec/04/t1449238542zojrsa6ys7q6pan.htm/, Retrieved Thu, 16 May 2024 08:48:32 +0000
Statistical Computations at FreeStatistics.org, Office for Research Development and Education, URL https://freestatistics.org/blog/index.php?pk=285152, Retrieved Thu, 16 May 2024 08:48:32 +0000
QR Codes:

Original text written by user:
IsPrivate?No (this computation is public)
User-defined keywords
Estimated Impact82
Family? (F = Feedback message, R = changed R code, M = changed R Module, P = changed Parameters, D = changed Data)
-       [Paired and Unpaired Two Samples Tests about the Mean] [Unpaired Two Samp...] [2015-12-04 14:14:48] [ff6d1090be03ecb1ea559b1add2eb09a] [Current]
Feedback Forum

Post a new message
Dataseries X:
403 407
436 408
420 381
408 423
401 409
401 397
394 430
396 374
346 400
417 361
374 386
394 387
415 395
363 421
376 358
414 370
379 401
412 374
412 412
379 377
472 414
439 338
409 432
419 357
417 387
413 389
388 436
409 397
416 448
440 382
416 428
403 410
395 250
404 378
398 389
402 434
418 413
446 420
449 403
389 372
395 418
377 370
381 382
388 366
222 393
400 390
378 386
393 377
380 323
376 399
427 423
365 336


Summary of computational transaction
Raw Inputview raw input (R code)
Raw Outputview raw output of R engine
Computing time2 seconds
R Server'Gwilym Jenkins' @ jenkins.wessa.net

\begin{tabular}{lllllllll}
\hline
Summary of computational transaction \tabularnewline
Raw Input & view raw input (R code)  \tabularnewline
Raw Output & view raw output of R engine  \tabularnewline
Computing time & 2 seconds \tabularnewline
R Server & 'Gwilym Jenkins' @ jenkins.wessa.net \tabularnewline
\hline
\end{tabular}
%Source: https://freestatistics.org/blog/index.php?pk=285152&T=0

[TABLE]
[ROW][C]Summary of computational transaction[/C][/ROW]
[ROW][C]Raw Input[/C][C]view raw input (R code) [/C][/ROW]
[ROW][C]Raw Output[/C][C]view raw output of R engine [/C][/ROW]
[ROW][C]Computing time[/C][C]2 seconds[/C][/ROW]
[ROW][C]R Server[/C][C]'Gwilym Jenkins' @ jenkins.wessa.net[/C][/ROW]
[/TABLE]
Source: https://freestatistics.org/blog/index.php?pk=285152&T=0

Globally Unique Identifier (entire table): ba.freestatistics.org/blog/index.php?pk=285152&T=0

As an alternative you can also use a QR Code:  

The GUIDs for individual cells are displayed in the table below:

Summary of computational transaction
Raw Inputview raw input (R code)
Raw Outputview raw output of R engine
Computing time2 seconds
R Server'Gwilym Jenkins' @ jenkins.wessa.net


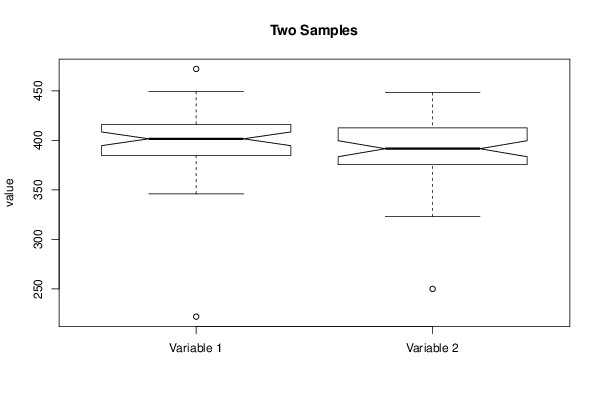
Two Sample t-test (unpaired)
Mean of Sample 1399.307692307692
Mean of Sample 2390.596153846154
t-stat1.31363136288019
df102
p-value0.0959586814949086
H0 value0
Alternativegreater
CI Level0.95
CI[-2.29652988833765,Inf]
F-test to compare two variances
F-stat1.07483311101996
df51
p-value0.797646324866885
H0 value1
Alternativetwo.sided
CI Level0.95
CI[0.616981172088029,1.87244970966474]

\begin{tabular}{lllllllll}
\hline
Two Sample t-test (unpaired) \tabularnewline
Mean of Sample 1 & 399.307692307692 \tabularnewline
Mean of Sample 2 & 390.596153846154 \tabularnewline
t-stat & 1.31363136288019 \tabularnewline
df & 102 \tabularnewline
p-value & 0.0959586814949086 \tabularnewline
H0 value & 0 \tabularnewline
Alternative & greater \tabularnewline
CI Level & 0.95 \tabularnewline
CI & [-2.29652988833765,Inf] \tabularnewline
F-test to compare two variances \tabularnewline
F-stat & 1.07483311101996 \tabularnewline
df & 51 \tabularnewline
p-value & 0.797646324866885 \tabularnewline
H0 value & 1 \tabularnewline
Alternative & two.sided \tabularnewline
CI Level & 0.95 \tabularnewline
CI & [0.616981172088029,1.87244970966474] \tabularnewline
\hline
\end{tabular}
%Source: https://freestatistics.org/blog/index.php?pk=285152&T=1

[TABLE]
[ROW][C]Two Sample t-test (unpaired)[/C][/ROW]
[ROW][C]Mean of Sample 1[/C][C]399.307692307692[/C][/ROW]
[ROW][C]Mean of Sample 2[/C][C]390.596153846154[/C][/ROW]
[ROW][C]t-stat[/C][C]1.31363136288019[/C][/ROW]
[ROW][C]df[/C][C]102[/C][/ROW]
[ROW][C]p-value[/C][C]0.0959586814949086[/C][/ROW]
[ROW][C]H0 value[/C][C]0[/C][/ROW]
[ROW][C]Alternative[/C][C]greater[/C][/ROW]
[ROW][C]CI Level[/C][C]0.95[/C][/ROW]
[ROW][C]CI[/C][C][-2.29652988833765,Inf][/C][/ROW]
[ROW][C]F-test to compare two variances[/C][/ROW]
[ROW][C]F-stat[/C][C]1.07483311101996[/C][/ROW]
[ROW][C]df[/C][C]51[/C][/ROW]
[ROW][C]p-value[/C][C]0.797646324866885[/C][/ROW]
[ROW][C]H0 value[/C][C]1[/C][/ROW]
[ROW][C]Alternative[/C][C]two.sided[/C][/ROW]
[ROW][C]CI Level[/C][C]0.95[/C][/ROW]
[ROW][C]CI[/C][C][0.616981172088029,1.87244970966474][/C][/ROW]
[/TABLE]
Source: https://freestatistics.org/blog/index.php?pk=285152&T=1

Globally Unique Identifier (entire table): ba.freestatistics.org/blog/index.php?pk=285152&T=1

As an alternative you can also use a QR Code:  

The GUIDs for individual cells are displayed in the table below:

Two Sample t-test (unpaired)
Mean of Sample 1399.307692307692
Mean of Sample 2390.596153846154
t-stat1.31363136288019
df102
p-value0.0959586814949086
H0 value0
Alternativegreater
CI Level0.95
CI[-2.29652988833765,Inf]
F-test to compare two variances
F-stat1.07483311101996
df51
p-value0.797646324866885
H0 value1
Alternativetwo.sided
CI Level0.95
CI[0.616981172088029,1.87244970966474]


Welch Two Sample t-test (unpaired)
Mean of Sample 1399.307692307692
Mean of Sample 2390.596153846154
t-stat1.31363136288019
df101.867487497573
p-value0.0959605933824783
H0 value0
Alternativegreater
CI Level0.95
CI[-2.29666114208901,Inf]

\begin{tabular}{lllllllll}
\hline
Welch Two Sample t-test (unpaired) \tabularnewline
Mean of Sample 1 & 399.307692307692 \tabularnewline
Mean of Sample 2 & 390.596153846154 \tabularnewline
t-stat & 1.31363136288019 \tabularnewline
df & 101.867487497573 \tabularnewline
p-value & 0.0959605933824783 \tabularnewline
H0 value & 0 \tabularnewline
Alternative & greater \tabularnewline
CI Level & 0.95 \tabularnewline
CI & [-2.29666114208901,Inf] \tabularnewline
\hline
\end{tabular}
%Source: https://freestatistics.org/blog/index.php?pk=285152&T=2

[TABLE]
[ROW][C]Welch Two Sample t-test (unpaired)[/C][/ROW]
[ROW][C]Mean of Sample 1[/C][C]399.307692307692[/C][/ROW]
[ROW][C]Mean of Sample 2[/C][C]390.596153846154[/C][/ROW]
[ROW][C]t-stat[/C][C]1.31363136288019[/C][/ROW]
[ROW][C]df[/C][C]101.867487497573[/C][/ROW]
[ROW][C]p-value[/C][C]0.0959605933824783[/C][/ROW]
[ROW][C]H0 value[/C][C]0[/C][/ROW]
[ROW][C]Alternative[/C][C]greater[/C][/ROW]
[ROW][C]CI Level[/C][C]0.95[/C][/ROW]
[ROW][C]CI[/C][C][-2.29666114208901,Inf][/C][/ROW]
[/TABLE]
Source: https://freestatistics.org/blog/index.php?pk=285152&T=2

Globally Unique Identifier (entire table): ba.freestatistics.org/blog/index.php?pk=285152&T=2

As an alternative you can also use a QR Code:  

The GUIDs for individual cells are displayed in the table below:

Welch Two Sample t-test (unpaired)
Mean of Sample 1399.307692307692
Mean of Sample 2390.596153846154
t-stat1.31363136288019
df101.867487497573
p-value0.0959605933824783
H0 value0
Alternativegreater
CI Level0.95
CI[-2.29666114208901,Inf]


Wilcoxon Rank-Sum Test (Mann–Whitney U test) with continuity correction (unpaired)
W1594
p-value0.0581769993378617
H0 value0
Alternativegreater
Kolmogorov-Smirnov Test to compare Distributions of two Samples
KS Statistic0.0384615384615385
p-value0.925961078642316
Kolmogorov-Smirnov Test to compare Distributional Shape of two Samples
KS Statistic0.134615384615385
p-value0.389727425841342

\begin{tabular}{lllllllll}
\hline
Wilcoxon Rank-Sum Test (Mann–Whitney U test) with continuity correction (unpaired) \tabularnewline
W & 1594 \tabularnewline
p-value & 0.0581769993378617 \tabularnewline
H0 value & 0 \tabularnewline
Alternative & greater \tabularnewline
Kolmogorov-Smirnov Test to compare Distributions of two Samples \tabularnewline
KS Statistic & 0.0384615384615385 \tabularnewline
p-value & 0.925961078642316 \tabularnewline
Kolmogorov-Smirnov Test to compare Distributional Shape of two Samples \tabularnewline
KS Statistic & 0.134615384615385 \tabularnewline
p-value & 0.389727425841342 \tabularnewline
\hline
\end{tabular}
%Source: https://freestatistics.org/blog/index.php?pk=285152&T=3

[TABLE]
[ROW][C]Wilcoxon Rank-Sum Test (Mann–Whitney U test) with continuity correction (unpaired)[/C][/ROW]
[ROW][C]W[/C][C]1594[/C][/ROW]
[ROW][C]p-value[/C][C]0.0581769993378617[/C][/ROW]
[ROW][C]H0 value[/C][C]0[/C][/ROW]
[ROW][C]Alternative[/C][C]greater[/C][/ROW]
[ROW][C]Kolmogorov-Smirnov Test to compare Distributions of two Samples[/C][/ROW]
[ROW][C]KS Statistic[/C][C]0.0384615384615385[/C][/ROW]
[ROW][C]p-value[/C][C]0.925961078642316[/C][/ROW]
[ROW][C]Kolmogorov-Smirnov Test to compare Distributional Shape of two Samples[/C][/ROW]
[ROW][C]KS Statistic[/C][C]0.134615384615385[/C][/ROW]
[ROW][C]p-value[/C][C]0.389727425841342[/C][/ROW]
[/TABLE]
Source: https://freestatistics.org/blog/index.php?pk=285152&T=3

Globally Unique Identifier (entire table): ba.freestatistics.org/blog/index.php?pk=285152&T=3

As an alternative you can also use a QR Code:  

The GUIDs for individual cells are displayed in the table below:

Wilcoxon Rank-Sum Test (Mann–Whitney U test) with continuity correction (unpaired)
W1594
p-value0.0581769993378617
H0 value0
Alternativegreater
Kolmogorov-Smirnov Test to compare Distributions of two Samples
KS Statistic0.0384615384615385
p-value0.925961078642316
Kolmogorov-Smirnov Test to compare Distributional Shape of two Samples
KS Statistic0.134615384615385
p-value0.389727425841342


Parameters (Session):
par1 = 2 ; par2 = 1 ; par3 = 0.95 ; par4 = less ; par5 = unpaired ; par6 = 0 ;
Parameters (R input):
par1 = 1 ; par2 = 2 ; par3 = 0.95 ; par4 = greater ; par5 = unpaired ; par6 = 0 ;
R code (references can be found in the software module):
par6 <- '0'
par5 <- 'unpaired'
par4 <- 'greater'
par3 <- '0.95'
par2 <- '2'
par1 <- '1'
par1 <- as.numeric(par1) #column number of first sample
par2 <- as.numeric(par2) #column number of second sample
par3 <- as.numeric(par3) #confidence (= 1 - alpha)
if (par5 == 'unpaired') paired <- FALSE else paired <- TRUE
par6 <- as.numeric(par6) #H0
z <- t(y)
if (par1 == par2) stop('Please, select two different column numbers')
if (par1 < 1) stop('Please, select a column number greater than zero for the first sample')
if (par2 < 1) stop('Please, select a column number greater than zero for the second sample')
if (par1 > length(z[1,])) stop('The column number for the first sample should be smaller')
if (par2 > length(z[1,])) stop('The column number for the second sample should be smaller')
if (par3 <= 0) stop('The confidence level should be larger than zero')
if (par3 >= 1) stop('The confidence level should be smaller than zero')
(r.t <- t.test(z[,par1],z[,par2],var.equal=TRUE,alternative=par4,paired=paired,mu=par6,conf.level=par3))
(v.t <- var.test(z[,par1],z[,par2],conf.level=par3))
(r.w <- t.test(z[,par1],z[,par2],var.equal=FALSE,alternative=par4,paired=paired,mu=par6,conf.level=par3))
(w.t <- wilcox.test(z[,par1],z[,par2],alternative=par4,paired=paired,mu=par6,conf.level=par3))
(ks.t <- ks.test(z[,par1],z[,par2],alternative=par4))
m1 <- mean(z[,par1],na.rm=T)
m2 <- mean(z[,par2],na.rm=T)
mdiff <- m1 - m2
newsam1 <- z[!is.na(z[,par1]),par1]
newsam2 <- z[,par2]+mdiff
newsam2 <- newsam2[!is.na(newsam2)]
(ks1.t <- ks.test(newsam1,newsam2,alternative=par4))
mydf <- data.frame(cbind(z[,par1],z[,par2]))
colnames(mydf) <- c('Variable 1','Variable 2')
bitmap(file='test1.png')
boxplot(mydf, notch=TRUE, ylab='value',main=main)
dev.off()
bitmap(file='test2.png')
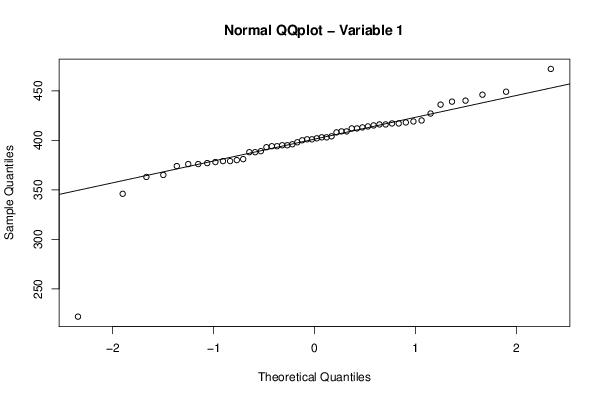
qqnorm(z[,par1],main='Normal QQplot - Variable 1')
qqline(z[,par1])
dev.off()
bitmap(file='test3.png')
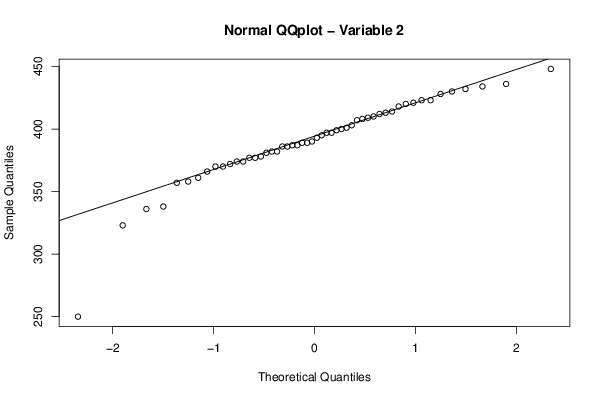
qqnorm(z[,par2],main='Normal QQplot - Variable 2')
qqline(z[,par2])
dev.off()
load(file='createtable')
a<-table.start()
a<-table.row.start(a)
a<-table.element(a,paste('Two Sample t-test (',par5,')',sep=''),2,TRUE)
a<-table.row.end(a)
if(!paired){
a<-table.row.start(a)
a<-table.element(a,'Mean of Sample 1',header=TRUE)
a<-table.element(a,r.t$estimate[[1]])
a<-table.row.end(a)
a<-table.row.start(a)
a<-table.element(a,'Mean of Sample 2',header=TRUE)
a<-table.element(a,r.t$estimate[[2]])
a<-table.row.end(a)
} else {
a<-table.row.start(a)
a<-table.element(a,'Difference: Mean1 - Mean2',header=TRUE)
a<-table.element(a,r.t$estimate)
a<-table.row.end(a)
}
a<-table.row.start(a)
a<-table.element(a,'t-stat',header=TRUE)
a<-table.element(a,r.t$statistic[[1]])
a<-table.row.end(a)
a<-table.row.start(a)
a<-table.element(a,'df',header=TRUE)
a<-table.element(a,r.t$parameter[[1]])
a<-table.row.end(a)
a<-table.row.start(a)
a<-table.element(a,'p-value',header=TRUE)
a<-table.element(a,r.t$p.value)
a<-table.row.end(a)
a<-table.row.start(a)
a<-table.element(a,'H0 value',header=TRUE)
a<-table.element(a,r.t$null.value[[1]])
a<-table.row.end(a)
a<-table.row.start(a)
a<-table.element(a,'Alternative',header=TRUE)
a<-table.element(a,r.t$alternative)
a<-table.row.end(a)
a<-table.row.start(a)
a<-table.element(a,'CI Level',header=TRUE)
a<-table.element(a,attr(r.t$conf.int,'conf.level'))
a<-table.row.end(a)
a<-table.row.start(a)
a<-table.element(a,'CI',header=TRUE)
a<-table.element(a,paste('[',r.t$conf.int[1],',',r.t$conf.int[2],']',sep=''))
a<-table.row.end(a)
a<-table.row.start(a)
a<-table.element(a,'F-test to compare two variances',2,TRUE)
a<-table.row.end(a)
a<-table.row.start(a)
a<-table.element(a,'F-stat',header=TRUE)
a<-table.element(a,v.t$statistic[[1]])
a<-table.row.end(a)
a<-table.row.start(a)
a<-table.element(a,'df',header=TRUE)
a<-table.element(a,v.t$parameter[[1]])
a<-table.row.end(a)
a<-table.row.start(a)
a<-table.element(a,'p-value',header=TRUE)
a<-table.element(a,v.t$p.value)
a<-table.row.end(a)
a<-table.row.start(a)
a<-table.element(a,'H0 value',header=TRUE)
a<-table.element(a,v.t$null.value[[1]])
a<-table.row.end(a)
a<-table.row.start(a)
a<-table.element(a,'Alternative',header=TRUE)
a<-table.element(a,v.t$alternative)
a<-table.row.end(a)
a<-table.row.start(a)
a<-table.element(a,'CI Level',header=TRUE)
a<-table.element(a,attr(v.t$conf.int,'conf.level'))
a<-table.row.end(a)
a<-table.row.start(a)
a<-table.element(a,'CI',header=TRUE)
a<-table.element(a,paste('[',v.t$conf.int[1],',',v.t$conf.int[2],']',sep=''))
a<-table.row.end(a)
a<-table.end(a)
table.save(a,file='mytable.tab')
a<-table.start()
a<-table.row.start(a)
a<-table.element(a,paste('Welch Two Sample t-test (',par5,')',sep=''),2,TRUE)
a<-table.row.end(a)
if(!paired){
a<-table.row.start(a)
a<-table.element(a,'Mean of Sample 1',header=TRUE)
a<-table.element(a,r.w$estimate[[1]])
a<-table.row.end(a)
a<-table.row.start(a)
a<-table.element(a,'Mean of Sample 2',header=TRUE)
a<-table.element(a,r.w$estimate[[2]])
a<-table.row.end(a)
} else {
a<-table.row.start(a)
a<-table.element(a,'Difference: Mean1 - Mean2',header=TRUE)
a<-table.element(a,r.w$estimate)
a<-table.row.end(a)
}
a<-table.row.start(a)
a<-table.element(a,'t-stat',header=TRUE)
a<-table.element(a,r.w$statistic[[1]])
a<-table.row.end(a)
a<-table.row.start(a)
a<-table.element(a,'df',header=TRUE)
a<-table.element(a,r.w$parameter[[1]])
a<-table.row.end(a)
a<-table.row.start(a)
a<-table.element(a,'p-value',header=TRUE)
a<-table.element(a,r.w$p.value)
a<-table.row.end(a)
a<-table.row.start(a)
a<-table.element(a,'H0 value',header=TRUE)
a<-table.element(a,r.w$null.value[[1]])
a<-table.row.end(a)
a<-table.row.start(a)
a<-table.element(a,'Alternative',header=TRUE)
a<-table.element(a,r.w$alternative)
a<-table.row.end(a)
a<-table.row.start(a)
a<-table.element(a,'CI Level',header=TRUE)
a<-table.element(a,attr(r.w$conf.int,'conf.level'))
a<-table.row.end(a)
a<-table.row.start(a)
a<-table.element(a,'CI',header=TRUE)
a<-table.element(a,paste('[',r.w$conf.int[1],',',r.w$conf.int[2],']',sep=''))
a<-table.row.end(a)
a<-table.end(a)
table.save(a,file='mytable1.tab')
a<-table.start()
a<-table.row.start(a)
myWlabel <- 'Wilcoxon Signed-Rank Test'
if (par5=='unpaired') myWlabel = 'Wilcoxon Rank-Sum Test (Mann–Whitney U test)'
a<-table.element(a,paste(myWlabel,' with continuity correction (',par5,')',sep=''),2,TRUE)
a<-table.row.end(a)
a<-table.row.start(a)
a<-table.element(a,'W',header=TRUE)
a<-table.element(a,w.t$statistic[[1]])
a<-table.row.end(a)
a<-table.row.start(a)
a<-table.element(a,'p-value',header=TRUE)
a<-table.element(a,w.t$p.value)
a<-table.row.end(a)
a<-table.row.start(a)
a<-table.element(a,'H0 value',header=TRUE)
a<-table.element(a,w.t$null.value[[1]])
a<-table.row.end(a)
a<-table.row.start(a)
a<-table.element(a,'Alternative',header=TRUE)
a<-table.element(a,w.t$alternative)
a<-table.row.end(a)
a<-table.row.start(a)
a<-table.element(a,'Kolmogorov-Smirnov Test to compare Distributions of two Samples',2,TRUE)
a<-table.row.end(a)
a<-table.row.start(a)
a<-table.element(a,'KS Statistic',header=TRUE)
a<-table.element(a,ks.t$statistic[[1]])
a<-table.row.end(a)
a<-table.row.start(a)
a<-table.element(a,'p-value',header=TRUE)
a<-table.element(a,ks.t$p.value)
a<-table.row.end(a)
a<-table.row.start(a)
a<-table.element(a,'Kolmogorov-Smirnov Test to compare Distributional Shape of two Samples',2,TRUE)
a<-table.row.end(a)
a<-table.row.start(a)
a<-table.element(a,'KS Statistic',header=TRUE)
a<-table.element(a,ks1.t$statistic[[1]])
a<-table.row.end(a)
a<-table.row.start(a)
a<-table.element(a,'p-value',header=TRUE)
a<-table.element(a,ks1.t$p.value)
a<-table.row.end(a)
a<-table.end(a)
table.save(a,file='mytable2.tab')