Free Statistics

of Irreproducible Research!

Author's title

Author*The author of this computation has been verified*
R Software Modulerwasp_autocorrelation.wasp
Title produced by software(Partial) Autocorrelation Function
Date of computationFri, 04 Dec 2015 19:02:22 +0000
Cite this page as followsStatistical Computations at FreeStatistics.org, Office for Research Development and Education, URL https://freestatistics.org/blog/index.php?v=date/2015/Dec/04/t14492557618u1sjym7d6c3zhk.htm/, Retrieved Thu, 16 May 2024 14:29:18 +0000
Statistical Computations at FreeStatistics.org, Office for Research Development and Education, URL https://freestatistics.org/blog/index.php?pk=285175, Retrieved Thu, 16 May 2024 14:29:18 +0000
QR Codes:

Original text written by user:
IsPrivate?No (this computation is public)
User-defined keywords
Estimated Impact107
Family? (F = Feedback message, R = changed R code, M = changed R Module, P = changed Parameters, D = changed Data)
-       [(Partial) Autocorrelation Function] [] [2015-12-04 19:02:22] [63a9f0ea7bb98050796b649e85481845] [Current]
Feedback Forum

Post a new message
Dataseries X:
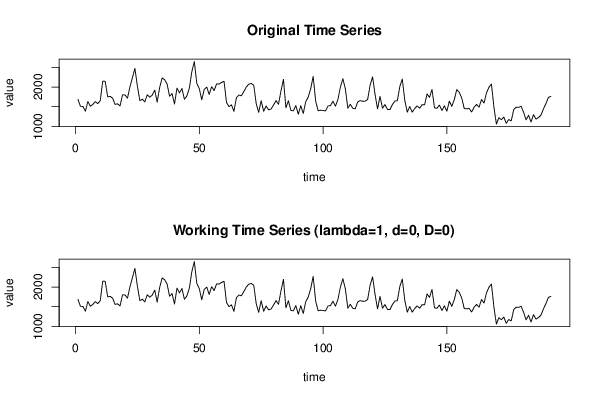
1687
1508
1507
1385
1632
1511
1559
1630
1579
1653
2152
2148
1752
1765
1717
1558
1575
1520
1805
1800
1719
2008
2242
2478
2030
1655
1693
1623
1805
1746
1795
1926
1619
1992
2233
2192
2080
1768
1835
1569
1976
1853
1965
1689
1778
1976
2397
2654
2097
1963
1677
1941
2003
1813
2012
1912
2084
2080
2118
2150
1608
1503
1548
1382
1731
1798
1779
1887
2004
2077
2092
2051
1577
1356
1652
1382
1519
1421
1442
1543
1656
1561
1905
2199
1473
1655
1407
1395
1530
1309
1526
1327
1627
1748
1958
2274
1648
1401
1411
1403
1394
1520
1528
1643
1515
1685
2000
2215
1956
1462
1563
1459
1446
1622
1657
1638
1643
1683
2050
2262
1813
1445
1762
1461
1556
1431
1427
1554
1645
1653
2016
2207
1665
1361
1506
1360
1453
1522
1460
1552
1548
1827
1737
1941
1474
1458
1542
1404
1522
1385
1641
1510
1681
1938
1868
1726
1456
1445
1456
1365
1487
1558
1488
1684
1594
1850
1998
2079
1494
1057
1218
1168
1236
1076
1174
1139
1427
1487
1483
1513
1357
1165
1282
1110
1297
1185
1222
1284
1444
1575
1737
1763


Summary of computational transaction
Raw Inputview raw input (R code)
Raw Outputview raw output of R engine
Computing time1 seconds
R Server'Herman Ole Andreas Wold' @ wold.wessa.net

\begin{tabular}{lllllllll}
\hline
Summary of computational transaction \tabularnewline
Raw Input & view raw input (R code)  \tabularnewline
Raw Output & view raw output of R engine  \tabularnewline
Computing time & 1 seconds \tabularnewline
R Server & 'Herman Ole Andreas Wold' @ wold.wessa.net \tabularnewline
\hline
\end{tabular}
%Source: https://freestatistics.org/blog/index.php?pk=285175&T=0

[TABLE]
[ROW][C]Summary of computational transaction[/C][/ROW]
[ROW][C]Raw Input[/C][C]view raw input (R code) [/C][/ROW]
[ROW][C]Raw Output[/C][C]view raw output of R engine [/C][/ROW]
[ROW][C]Computing time[/C][C]1 seconds[/C][/ROW]
[ROW][C]R Server[/C][C]'Herman Ole Andreas Wold' @ wold.wessa.net[/C][/ROW]
[/TABLE]
Source: https://freestatistics.org/blog/index.php?pk=285175&T=0

Globally Unique Identifier (entire table): ba.freestatistics.org/blog/index.php?pk=285175&T=0

As an alternative you can also use a QR Code:  

The GUIDs for individual cells are displayed in the table below:

Summary of computational transaction
Raw Inputview raw input (R code)
Raw Outputview raw output of R engine
Computing time1 seconds
R Server'Herman Ole Andreas Wold' @ wold.wessa.net


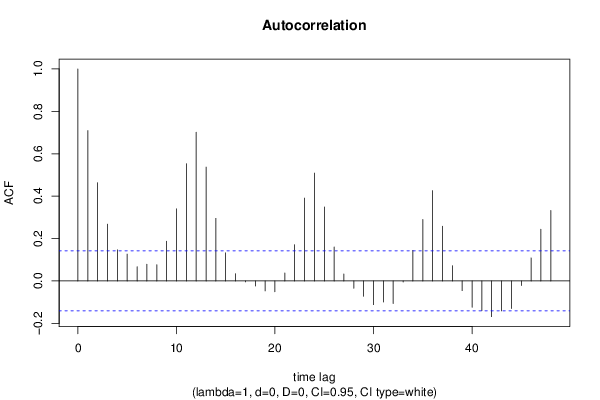
Autocorrelation Function
Time lag kACF(k)T-STATP-value
10.7092169.82720
20.4634376.42160
30.2679273.71250.000134
40.1466522.03210.021762
50.1265961.75420.040499
60.0667540.9250.178071
70.0792331.09790.136814
80.0763621.05810.145668
90.1872.59110.00515
100.3401224.71292e-06
110.5530877.66380
120.7012399.71660
130.5370167.44110
140.2951884.09023.2e-05
150.132611.83750.033841
160.0339740.47080.319172
17-0.004447-0.06160.475463
18-0.023669-0.3280.371645
19-0.046773-0.64810.258846
20-0.050729-0.70290.241476
210.0378820.52490.300125
220.1708912.36790.009441
230.3908365.41560
240.5086277.04770
250.3487244.83211e-06
260.160122.21870.01384
270.03320.460.323006
28-0.034799-0.48220.315109
29-0.072127-0.99940.159424
30-0.111609-1.54650.061815
31-0.098987-1.37160.085895
32-0.106564-1.47660.070712
33-0.005216-0.07230.471228
340.1441421.99730.023603
350.2899214.01734.2e-05
360.426265.90640
370.258443.5810.000217
380.0716190.99240.16113
39-0.04582-0.63490.263125
40-0.123863-1.71630.043861
41-0.140545-1.94750.026469
42-0.168382-2.33320.010337
43-0.141149-1.95580.025969
44-0.129769-1.79810.036863
45-0.021105-0.29240.385132
460.1087451.50680.066752
470.2442633.38460.000432
480.3322424.60374e-06

\begin{tabular}{lllllllll}
\hline
Autocorrelation Function \tabularnewline
Time lag k & ACF(k) & T-STAT & P-value \tabularnewline
1 & 0.709216 & 9.8272 & 0 \tabularnewline
2 & 0.463437 & 6.4216 & 0 \tabularnewline
3 & 0.267927 & 3.7125 & 0.000134 \tabularnewline
4 & 0.146652 & 2.0321 & 0.021762 \tabularnewline
5 & 0.126596 & 1.7542 & 0.040499 \tabularnewline
6 & 0.066754 & 0.925 & 0.178071 \tabularnewline
7 & 0.079233 & 1.0979 & 0.136814 \tabularnewline
8 & 0.076362 & 1.0581 & 0.145668 \tabularnewline
9 & 0.187 & 2.5911 & 0.00515 \tabularnewline
10 & 0.340122 & 4.7129 & 2e-06 \tabularnewline
11 & 0.553087 & 7.6638 & 0 \tabularnewline
12 & 0.701239 & 9.7166 & 0 \tabularnewline
13 & 0.537016 & 7.4411 & 0 \tabularnewline
14 & 0.295188 & 4.0902 & 3.2e-05 \tabularnewline
15 & 0.13261 & 1.8375 & 0.033841 \tabularnewline
16 & 0.033974 & 0.4708 & 0.319172 \tabularnewline
17 & -0.004447 & -0.0616 & 0.475463 \tabularnewline
18 & -0.023669 & -0.328 & 0.371645 \tabularnewline
19 & -0.046773 & -0.6481 & 0.258846 \tabularnewline
20 & -0.050729 & -0.7029 & 0.241476 \tabularnewline
21 & 0.037882 & 0.5249 & 0.300125 \tabularnewline
22 & 0.170891 & 2.3679 & 0.009441 \tabularnewline
23 & 0.390836 & 5.4156 & 0 \tabularnewline
24 & 0.508627 & 7.0477 & 0 \tabularnewline
25 & 0.348724 & 4.8321 & 1e-06 \tabularnewline
26 & 0.16012 & 2.2187 & 0.01384 \tabularnewline
27 & 0.0332 & 0.46 & 0.323006 \tabularnewline
28 & -0.034799 & -0.4822 & 0.315109 \tabularnewline
29 & -0.072127 & -0.9994 & 0.159424 \tabularnewline
30 & -0.111609 & -1.5465 & 0.061815 \tabularnewline
31 & -0.098987 & -1.3716 & 0.085895 \tabularnewline
32 & -0.106564 & -1.4766 & 0.070712 \tabularnewline
33 & -0.005216 & -0.0723 & 0.471228 \tabularnewline
34 & 0.144142 & 1.9973 & 0.023603 \tabularnewline
35 & 0.289921 & 4.0173 & 4.2e-05 \tabularnewline
36 & 0.42626 & 5.9064 & 0 \tabularnewline
37 & 0.25844 & 3.581 & 0.000217 \tabularnewline
38 & 0.071619 & 0.9924 & 0.16113 \tabularnewline
39 & -0.04582 & -0.6349 & 0.263125 \tabularnewline
40 & -0.123863 & -1.7163 & 0.043861 \tabularnewline
41 & -0.140545 & -1.9475 & 0.026469 \tabularnewline
42 & -0.168382 & -2.3332 & 0.010337 \tabularnewline
43 & -0.141149 & -1.9558 & 0.025969 \tabularnewline
44 & -0.129769 & -1.7981 & 0.036863 \tabularnewline
45 & -0.021105 & -0.2924 & 0.385132 \tabularnewline
46 & 0.108745 & 1.5068 & 0.066752 \tabularnewline
47 & 0.244263 & 3.3846 & 0.000432 \tabularnewline
48 & 0.332242 & 4.6037 & 4e-06 \tabularnewline
\hline
\end{tabular}
%Source: https://freestatistics.org/blog/index.php?pk=285175&T=1

[TABLE]
[ROW][C]Autocorrelation Function[/C][/ROW]
[ROW][C]Time lag k[/C][C]ACF(k)[/C][C]T-STAT[/C][C]P-value[/C][/ROW]
[ROW][C]1[/C][C]0.709216[/C][C]9.8272[/C][C]0[/C][/ROW]
[ROW][C]2[/C][C]0.463437[/C][C]6.4216[/C][C]0[/C][/ROW]
[ROW][C]3[/C][C]0.267927[/C][C]3.7125[/C][C]0.000134[/C][/ROW]
[ROW][C]4[/C][C]0.146652[/C][C]2.0321[/C][C]0.021762[/C][/ROW]
[ROW][C]5[/C][C]0.126596[/C][C]1.7542[/C][C]0.040499[/C][/ROW]
[ROW][C]6[/C][C]0.066754[/C][C]0.925[/C][C]0.178071[/C][/ROW]
[ROW][C]7[/C][C]0.079233[/C][C]1.0979[/C][C]0.136814[/C][/ROW]
[ROW][C]8[/C][C]0.076362[/C][C]1.0581[/C][C]0.145668[/C][/ROW]
[ROW][C]9[/C][C]0.187[/C][C]2.5911[/C][C]0.00515[/C][/ROW]
[ROW][C]10[/C][C]0.340122[/C][C]4.7129[/C][C]2e-06[/C][/ROW]
[ROW][C]11[/C][C]0.553087[/C][C]7.6638[/C][C]0[/C][/ROW]
[ROW][C]12[/C][C]0.701239[/C][C]9.7166[/C][C]0[/C][/ROW]
[ROW][C]13[/C][C]0.537016[/C][C]7.4411[/C][C]0[/C][/ROW]
[ROW][C]14[/C][C]0.295188[/C][C]4.0902[/C][C]3.2e-05[/C][/ROW]
[ROW][C]15[/C][C]0.13261[/C][C]1.8375[/C][C]0.033841[/C][/ROW]
[ROW][C]16[/C][C]0.033974[/C][C]0.4708[/C][C]0.319172[/C][/ROW]
[ROW][C]17[/C][C]-0.004447[/C][C]-0.0616[/C][C]0.475463[/C][/ROW]
[ROW][C]18[/C][C]-0.023669[/C][C]-0.328[/C][C]0.371645[/C][/ROW]
[ROW][C]19[/C][C]-0.046773[/C][C]-0.6481[/C][C]0.258846[/C][/ROW]
[ROW][C]20[/C][C]-0.050729[/C][C]-0.7029[/C][C]0.241476[/C][/ROW]
[ROW][C]21[/C][C]0.037882[/C][C]0.5249[/C][C]0.300125[/C][/ROW]
[ROW][C]22[/C][C]0.170891[/C][C]2.3679[/C][C]0.009441[/C][/ROW]
[ROW][C]23[/C][C]0.390836[/C][C]5.4156[/C][C]0[/C][/ROW]
[ROW][C]24[/C][C]0.508627[/C][C]7.0477[/C][C]0[/C][/ROW]
[ROW][C]25[/C][C]0.348724[/C][C]4.8321[/C][C]1e-06[/C][/ROW]
[ROW][C]26[/C][C]0.16012[/C][C]2.2187[/C][C]0.01384[/C][/ROW]
[ROW][C]27[/C][C]0.0332[/C][C]0.46[/C][C]0.323006[/C][/ROW]
[ROW][C]28[/C][C]-0.034799[/C][C]-0.4822[/C][C]0.315109[/C][/ROW]
[ROW][C]29[/C][C]-0.072127[/C][C]-0.9994[/C][C]0.159424[/C][/ROW]
[ROW][C]30[/C][C]-0.111609[/C][C]-1.5465[/C][C]0.061815[/C][/ROW]
[ROW][C]31[/C][C]-0.098987[/C][C]-1.3716[/C][C]0.085895[/C][/ROW]
[ROW][C]32[/C][C]-0.106564[/C][C]-1.4766[/C][C]0.070712[/C][/ROW]
[ROW][C]33[/C][C]-0.005216[/C][C]-0.0723[/C][C]0.471228[/C][/ROW]
[ROW][C]34[/C][C]0.144142[/C][C]1.9973[/C][C]0.023603[/C][/ROW]
[ROW][C]35[/C][C]0.289921[/C][C]4.0173[/C][C]4.2e-05[/C][/ROW]
[ROW][C]36[/C][C]0.42626[/C][C]5.9064[/C][C]0[/C][/ROW]
[ROW][C]37[/C][C]0.25844[/C][C]3.581[/C][C]0.000217[/C][/ROW]
[ROW][C]38[/C][C]0.071619[/C][C]0.9924[/C][C]0.16113[/C][/ROW]
[ROW][C]39[/C][C]-0.04582[/C][C]-0.6349[/C][C]0.263125[/C][/ROW]
[ROW][C]40[/C][C]-0.123863[/C][C]-1.7163[/C][C]0.043861[/C][/ROW]
[ROW][C]41[/C][C]-0.140545[/C][C]-1.9475[/C][C]0.026469[/C][/ROW]
[ROW][C]42[/C][C]-0.168382[/C][C]-2.3332[/C][C]0.010337[/C][/ROW]
[ROW][C]43[/C][C]-0.141149[/C][C]-1.9558[/C][C]0.025969[/C][/ROW]
[ROW][C]44[/C][C]-0.129769[/C][C]-1.7981[/C][C]0.036863[/C][/ROW]
[ROW][C]45[/C][C]-0.021105[/C][C]-0.2924[/C][C]0.385132[/C][/ROW]
[ROW][C]46[/C][C]0.108745[/C][C]1.5068[/C][C]0.066752[/C][/ROW]
[ROW][C]47[/C][C]0.244263[/C][C]3.3846[/C][C]0.000432[/C][/ROW]
[ROW][C]48[/C][C]0.332242[/C][C]4.6037[/C][C]4e-06[/C][/ROW]
[/TABLE]
Source: https://freestatistics.org/blog/index.php?pk=285175&T=1

Globally Unique Identifier (entire table): ba.freestatistics.org/blog/index.php?pk=285175&T=1

As an alternative you can also use a QR Code:  

The GUIDs for individual cells are displayed in the table below:

Autocorrelation Function
Time lag kACF(k)T-STATP-value
10.7092169.82720
20.4634376.42160
30.2679273.71250.000134
40.1466522.03210.021762
50.1265961.75420.040499
60.0667540.9250.178071
70.0792331.09790.136814
80.0763621.05810.145668
90.1872.59110.00515
100.3401224.71292e-06
110.5530877.66380
120.7012399.71660
130.5370167.44110
140.2951884.09023.2e-05
150.132611.83750.033841
160.0339740.47080.319172
17-0.004447-0.06160.475463
18-0.023669-0.3280.371645
19-0.046773-0.64810.258846
20-0.050729-0.70290.241476
210.0378820.52490.300125
220.1708912.36790.009441
230.3908365.41560
240.5086277.04770
250.3487244.83211e-06
260.160122.21870.01384
270.03320.460.323006
28-0.034799-0.48220.315109
29-0.072127-0.99940.159424
30-0.111609-1.54650.061815
31-0.098987-1.37160.085895
32-0.106564-1.47660.070712
33-0.005216-0.07230.471228
340.1441421.99730.023603
350.2899214.01734.2e-05
360.426265.90640
370.258443.5810.000217
380.0716190.99240.16113
39-0.04582-0.63490.263125
40-0.123863-1.71630.043861
41-0.140545-1.94750.026469
42-0.168382-2.33320.010337
43-0.141149-1.95580.025969
44-0.129769-1.79810.036863
45-0.021105-0.29240.385132
460.1087451.50680.066752
470.2442633.38460.000432
480.3322424.60374e-06


Partial Autocorrelation Function
Time lag kPACF(k)T-STATP-value
10.7092169.82720
2-0.079575-1.10260.135785
3-0.061694-0.85490.196848
40.003190.04420.482392
50.1038511.4390.075889
6-0.09865-1.36690.086623
70.103351.43210.076877
8-0.007712-0.10690.457506
90.2525873.49990.000289
100.2024712.80550.00277
110.404125.59970
120.2783123.85647.8e-05
13-0.259546-3.59640.000205
14-0.296827-4.1132.9e-05
15-0.005228-0.07240.471164
16-0.071728-0.99390.160764
17-0.035546-0.49250.311452
180.0649290.89970.184709
19-0.016613-0.23020.409091
20-0.093673-1.2980.097927
21-0.007874-0.10910.456616
22-0.055261-0.76570.22239
230.1586312.19810.01457
240.0692620.95970.169201
25-0.190366-2.63780.004514
260.0241450.33460.369159
270.083651.15910.123931
28-0.039098-0.54180.294304
29-0.016946-0.23480.407304
30-0.048483-0.67180.251259
310.14161.96210.0256
32-0.024745-0.34290.366031
330.0624670.86560.193902
340.0834951.15690.124367
35-0.142084-1.96880.025209
360.1042881.44510.075035
37-0.119404-1.65450.049829
38-0.110624-1.53290.063479
39-0.01363-0.18890.425202
40-0.054069-0.74920.227324
41-0.002224-0.03080.487726
420.0609540.84460.199692
430.0588170.8150.208041
44-0.001326-0.01840.492682
450.0350580.48580.313841
46-0.072246-1.00110.159025
47-0.03165-0.43860.330737
480.0492350.68220.24796

\begin{tabular}{lllllllll}
\hline
Partial Autocorrelation Function \tabularnewline
Time lag k & PACF(k) & T-STAT & P-value \tabularnewline
1 & 0.709216 & 9.8272 & 0 \tabularnewline
2 & -0.079575 & -1.1026 & 0.135785 \tabularnewline
3 & -0.061694 & -0.8549 & 0.196848 \tabularnewline
4 & 0.00319 & 0.0442 & 0.482392 \tabularnewline
5 & 0.103851 & 1.439 & 0.075889 \tabularnewline
6 & -0.09865 & -1.3669 & 0.086623 \tabularnewline
7 & 0.10335 & 1.4321 & 0.076877 \tabularnewline
8 & -0.007712 & -0.1069 & 0.457506 \tabularnewline
9 & 0.252587 & 3.4999 & 0.000289 \tabularnewline
10 & 0.202471 & 2.8055 & 0.00277 \tabularnewline
11 & 0.40412 & 5.5997 & 0 \tabularnewline
12 & 0.278312 & 3.8564 & 7.8e-05 \tabularnewline
13 & -0.259546 & -3.5964 & 0.000205 \tabularnewline
14 & -0.296827 & -4.113 & 2.9e-05 \tabularnewline
15 & -0.005228 & -0.0724 & 0.471164 \tabularnewline
16 & -0.071728 & -0.9939 & 0.160764 \tabularnewline
17 & -0.035546 & -0.4925 & 0.311452 \tabularnewline
18 & 0.064929 & 0.8997 & 0.184709 \tabularnewline
19 & -0.016613 & -0.2302 & 0.409091 \tabularnewline
20 & -0.093673 & -1.298 & 0.097927 \tabularnewline
21 & -0.007874 & -0.1091 & 0.456616 \tabularnewline
22 & -0.055261 & -0.7657 & 0.22239 \tabularnewline
23 & 0.158631 & 2.1981 & 0.01457 \tabularnewline
24 & 0.069262 & 0.9597 & 0.169201 \tabularnewline
25 & -0.190366 & -2.6378 & 0.004514 \tabularnewline
26 & 0.024145 & 0.3346 & 0.369159 \tabularnewline
27 & 0.08365 & 1.1591 & 0.123931 \tabularnewline
28 & -0.039098 & -0.5418 & 0.294304 \tabularnewline
29 & -0.016946 & -0.2348 & 0.407304 \tabularnewline
30 & -0.048483 & -0.6718 & 0.251259 \tabularnewline
31 & 0.1416 & 1.9621 & 0.0256 \tabularnewline
32 & -0.024745 & -0.3429 & 0.366031 \tabularnewline
33 & 0.062467 & 0.8656 & 0.193902 \tabularnewline
34 & 0.083495 & 1.1569 & 0.124367 \tabularnewline
35 & -0.142084 & -1.9688 & 0.025209 \tabularnewline
36 & 0.104288 & 1.4451 & 0.075035 \tabularnewline
37 & -0.119404 & -1.6545 & 0.049829 \tabularnewline
38 & -0.110624 & -1.5329 & 0.063479 \tabularnewline
39 & -0.01363 & -0.1889 & 0.425202 \tabularnewline
40 & -0.054069 & -0.7492 & 0.227324 \tabularnewline
41 & -0.002224 & -0.0308 & 0.487726 \tabularnewline
42 & 0.060954 & 0.8446 & 0.199692 \tabularnewline
43 & 0.058817 & 0.815 & 0.208041 \tabularnewline
44 & -0.001326 & -0.0184 & 0.492682 \tabularnewline
45 & 0.035058 & 0.4858 & 0.313841 \tabularnewline
46 & -0.072246 & -1.0011 & 0.159025 \tabularnewline
47 & -0.03165 & -0.4386 & 0.330737 \tabularnewline
48 & 0.049235 & 0.6822 & 0.24796 \tabularnewline
\hline
\end{tabular}
%Source: https://freestatistics.org/blog/index.php?pk=285175&T=2

[TABLE]
[ROW][C]Partial Autocorrelation Function[/C][/ROW]
[ROW][C]Time lag k[/C][C]PACF(k)[/C][C]T-STAT[/C][C]P-value[/C][/ROW]
[ROW][C]1[/C][C]0.709216[/C][C]9.8272[/C][C]0[/C][/ROW]
[ROW][C]2[/C][C]-0.079575[/C][C]-1.1026[/C][C]0.135785[/C][/ROW]
[ROW][C]3[/C][C]-0.061694[/C][C]-0.8549[/C][C]0.196848[/C][/ROW]
[ROW][C]4[/C][C]0.00319[/C][C]0.0442[/C][C]0.482392[/C][/ROW]
[ROW][C]5[/C][C]0.103851[/C][C]1.439[/C][C]0.075889[/C][/ROW]
[ROW][C]6[/C][C]-0.09865[/C][C]-1.3669[/C][C]0.086623[/C][/ROW]
[ROW][C]7[/C][C]0.10335[/C][C]1.4321[/C][C]0.076877[/C][/ROW]
[ROW][C]8[/C][C]-0.007712[/C][C]-0.1069[/C][C]0.457506[/C][/ROW]
[ROW][C]9[/C][C]0.252587[/C][C]3.4999[/C][C]0.000289[/C][/ROW]
[ROW][C]10[/C][C]0.202471[/C][C]2.8055[/C][C]0.00277[/C][/ROW]
[ROW][C]11[/C][C]0.40412[/C][C]5.5997[/C][C]0[/C][/ROW]
[ROW][C]12[/C][C]0.278312[/C][C]3.8564[/C][C]7.8e-05[/C][/ROW]
[ROW][C]13[/C][C]-0.259546[/C][C]-3.5964[/C][C]0.000205[/C][/ROW]
[ROW][C]14[/C][C]-0.296827[/C][C]-4.113[/C][C]2.9e-05[/C][/ROW]
[ROW][C]15[/C][C]-0.005228[/C][C]-0.0724[/C][C]0.471164[/C][/ROW]
[ROW][C]16[/C][C]-0.071728[/C][C]-0.9939[/C][C]0.160764[/C][/ROW]
[ROW][C]17[/C][C]-0.035546[/C][C]-0.4925[/C][C]0.311452[/C][/ROW]
[ROW][C]18[/C][C]0.064929[/C][C]0.8997[/C][C]0.184709[/C][/ROW]
[ROW][C]19[/C][C]-0.016613[/C][C]-0.2302[/C][C]0.409091[/C][/ROW]
[ROW][C]20[/C][C]-0.093673[/C][C]-1.298[/C][C]0.097927[/C][/ROW]
[ROW][C]21[/C][C]-0.007874[/C][C]-0.1091[/C][C]0.456616[/C][/ROW]
[ROW][C]22[/C][C]-0.055261[/C][C]-0.7657[/C][C]0.22239[/C][/ROW]
[ROW][C]23[/C][C]0.158631[/C][C]2.1981[/C][C]0.01457[/C][/ROW]
[ROW][C]24[/C][C]0.069262[/C][C]0.9597[/C][C]0.169201[/C][/ROW]
[ROW][C]25[/C][C]-0.190366[/C][C]-2.6378[/C][C]0.004514[/C][/ROW]
[ROW][C]26[/C][C]0.024145[/C][C]0.3346[/C][C]0.369159[/C][/ROW]
[ROW][C]27[/C][C]0.08365[/C][C]1.1591[/C][C]0.123931[/C][/ROW]
[ROW][C]28[/C][C]-0.039098[/C][C]-0.5418[/C][C]0.294304[/C][/ROW]
[ROW][C]29[/C][C]-0.016946[/C][C]-0.2348[/C][C]0.407304[/C][/ROW]
[ROW][C]30[/C][C]-0.048483[/C][C]-0.6718[/C][C]0.251259[/C][/ROW]
[ROW][C]31[/C][C]0.1416[/C][C]1.9621[/C][C]0.0256[/C][/ROW]
[ROW][C]32[/C][C]-0.024745[/C][C]-0.3429[/C][C]0.366031[/C][/ROW]
[ROW][C]33[/C][C]0.062467[/C][C]0.8656[/C][C]0.193902[/C][/ROW]
[ROW][C]34[/C][C]0.083495[/C][C]1.1569[/C][C]0.124367[/C][/ROW]
[ROW][C]35[/C][C]-0.142084[/C][C]-1.9688[/C][C]0.025209[/C][/ROW]
[ROW][C]36[/C][C]0.104288[/C][C]1.4451[/C][C]0.075035[/C][/ROW]
[ROW][C]37[/C][C]-0.119404[/C][C]-1.6545[/C][C]0.049829[/C][/ROW]
[ROW][C]38[/C][C]-0.110624[/C][C]-1.5329[/C][C]0.063479[/C][/ROW]
[ROW][C]39[/C][C]-0.01363[/C][C]-0.1889[/C][C]0.425202[/C][/ROW]
[ROW][C]40[/C][C]-0.054069[/C][C]-0.7492[/C][C]0.227324[/C][/ROW]
[ROW][C]41[/C][C]-0.002224[/C][C]-0.0308[/C][C]0.487726[/C][/ROW]
[ROW][C]42[/C][C]0.060954[/C][C]0.8446[/C][C]0.199692[/C][/ROW]
[ROW][C]43[/C][C]0.058817[/C][C]0.815[/C][C]0.208041[/C][/ROW]
[ROW][C]44[/C][C]-0.001326[/C][C]-0.0184[/C][C]0.492682[/C][/ROW]
[ROW][C]45[/C][C]0.035058[/C][C]0.4858[/C][C]0.313841[/C][/ROW]
[ROW][C]46[/C][C]-0.072246[/C][C]-1.0011[/C][C]0.159025[/C][/ROW]
[ROW][C]47[/C][C]-0.03165[/C][C]-0.4386[/C][C]0.330737[/C][/ROW]
[ROW][C]48[/C][C]0.049235[/C][C]0.6822[/C][C]0.24796[/C][/ROW]
[/TABLE]
Source: https://freestatistics.org/blog/index.php?pk=285175&T=2

Globally Unique Identifier (entire table): ba.freestatistics.org/blog/index.php?pk=285175&T=2

As an alternative you can also use a QR Code:  

The GUIDs for individual cells are displayed in the table below:

Partial Autocorrelation Function
Time lag kPACF(k)T-STATP-value
10.7092169.82720
2-0.079575-1.10260.135785
3-0.061694-0.85490.196848
40.003190.04420.482392
50.1038511.4390.075889
6-0.09865-1.36690.086623
70.103351.43210.076877
8-0.007712-0.10690.457506
90.2525873.49990.000289
100.2024712.80550.00277
110.404125.59970
120.2783123.85647.8e-05
13-0.259546-3.59640.000205
14-0.296827-4.1132.9e-05
15-0.005228-0.07240.471164
16-0.071728-0.99390.160764
17-0.035546-0.49250.311452
180.0649290.89970.184709
19-0.016613-0.23020.409091
20-0.093673-1.2980.097927
21-0.007874-0.10910.456616
22-0.055261-0.76570.22239
230.1586312.19810.01457
240.0692620.95970.169201
25-0.190366-2.63780.004514
260.0241450.33460.369159
270.083651.15910.123931
28-0.039098-0.54180.294304
29-0.016946-0.23480.407304
30-0.048483-0.67180.251259
310.14161.96210.0256
32-0.024745-0.34290.366031
330.0624670.86560.193902
340.0834951.15690.124367
35-0.142084-1.96880.025209
360.1042881.44510.075035
37-0.119404-1.65450.049829
38-0.110624-1.53290.063479
39-0.01363-0.18890.425202
40-0.054069-0.74920.227324
41-0.002224-0.03080.487726
420.0609540.84460.199692
430.0588170.8150.208041
44-0.001326-0.01840.492682
450.0350580.48580.313841
46-0.072246-1.00110.159025
47-0.03165-0.43860.330737
480.0492350.68220.24796


Parameters (Session):
par1 = 48 ; par2 = 1 ; par3 = 0 ; par4 = 0 ; par5 = 12 ; par6 = White Noise ; par7 = 0.95 ;
Parameters (R input):
par1 = 48 ; par2 = 1 ; par3 = 0 ; par4 = 0 ; par5 = 12 ; par6 = White Noise ; par7 = 0.95 ; par8 = ;
R code (references can be found in the software module):
if (par1 == 'Default') {
par1 = 10*log10(length(x))
} else {
par1 <- as.numeric(par1)
}
par2 <- as.numeric(par2)
par3 <- as.numeric(par3)
par4 <- as.numeric(par4)
par5 <- as.numeric(par5)
if (par6 == 'White Noise') par6 <- 'white' else par6 <- 'ma'
par7 <- as.numeric(par7)
if (par8 != '') par8 <- as.numeric(par8)
x <- na.omit(x)
ox <- x
if (par8 == '') {
if (par2 == 0) {
x <- log(x)
} else {
x <- (x ^ par2 - 1) / par2
}
} else {
x <- log(x,base=par8)
}
if (par3 > 0) x <- diff(x,lag=1,difference=par3)
if (par4 > 0) x <- diff(x,lag=par5,difference=par4)
bitmap(file='picts.png')
op <- par(mfrow=c(2,1))
plot(ox,type='l',main='Original Time Series',xlab='time',ylab='value')
if (par8=='') {
mytitle <- paste('Working Time Series (lambda=',par2,', d=',par3,', D=',par4,')',sep='')
mysub <- paste('(lambda=',par2,', d=',par3,', D=',par4,', CI=', par7, ', CI type=',par6,')',sep='')
} else {
mytitle <- paste('Working Time Series (base=',par8,', d=',par3,', D=',par4,')',sep='')
mysub <- paste('(base=',par8,', d=',par3,', D=',par4,', CI=', par7, ', CI type=',par6,')',sep='')
}
plot(x,type='l', main=mytitle,xlab='time',ylab='value')
par(op)
dev.off()
bitmap(file='pic1.png')
racf <- acf(x, par1, main='Autocorrelation', xlab='time lag', ylab='ACF', ci.type=par6, ci=par7, sub=mysub)
dev.off()
bitmap(file='pic2.png')
rpacf <- pacf(x,par1,main='Partial Autocorrelation',xlab='lags',ylab='PACF',sub=mysub)
dev.off()
(myacf <- c(racf$acf))
(mypacf <- c(rpacf$acf))
lengthx <- length(x)
sqrtn <- sqrt(lengthx)
load(file='createtable')
a<-table.start()
a<-table.row.start(a)
a<-table.element(a,'Autocorrelation Function',4,TRUE)
a<-table.row.end(a)
a<-table.row.start(a)
a<-table.element(a,'Time lag k',header=TRUE)
a<-table.element(a,hyperlink('basics.htm','ACF(k)','click here for more information about the Autocorrelation Function'),header=TRUE)
a<-table.element(a,'T-STAT',header=TRUE)
a<-table.element(a,'P-value',header=TRUE)
a<-table.row.end(a)
for (i in 2:(par1+1)) {
a<-table.row.start(a)
a<-table.element(a,i-1,header=TRUE)
a<-table.element(a,round(myacf[i],6))
mytstat <- myacf[i]*sqrtn
a<-table.element(a,round(mytstat,4))
a<-table.element(a,round(1-pt(abs(mytstat),lengthx),6))
a<-table.row.end(a)
}
a<-table.end(a)
table.save(a,file='mytable.tab')
a<-table.start()
a<-table.row.start(a)
a<-table.element(a,'Partial Autocorrelation Function',4,TRUE)
a<-table.row.end(a)
a<-table.row.start(a)
a<-table.element(a,'Time lag k',header=TRUE)
a<-table.element(a,hyperlink('basics.htm','PACF(k)','click here for more information about the Partial Autocorrelation Function'),header=TRUE)
a<-table.element(a,'T-STAT',header=TRUE)
a<-table.element(a,'P-value',header=TRUE)
a<-table.row.end(a)
for (i in 1:par1) {
a<-table.row.start(a)
a<-table.element(a,i,header=TRUE)
a<-table.element(a,round(mypacf[i],6))
mytstat <- mypacf[i]*sqrtn
a<-table.element(a,round(mytstat,4))
a<-table.element(a,round(1-pt(abs(mytstat),lengthx),6))
a<-table.row.end(a)
}
a<-table.end(a)
table.save(a,file='mytable1.tab')