Free Statistics

of Irreproducible Research!

Author's title

Author*Unverified author*
R Software Modulerwasp_multipleregression.wasp
Title produced by softwareMultiple Regression
Date of computationFri, 04 Dec 2015 21:35:11 +0000
Cite this page as followsStatistical Computations at FreeStatistics.org, Office for Research Development and Education, URL https://freestatistics.org/blog/index.php?v=date/2015/Dec/04/t14492662759xxqxfi0unvanjj.htm/, Retrieved Thu, 16 May 2024 17:19:20 +0000
Statistical Computations at FreeStatistics.org, Office for Research Development and Education, URL https://freestatistics.org/blog/index.php?pk=285182, Retrieved Thu, 16 May 2024 17:19:20 +0000
QR Codes:

Original text written by user:The Sokal & Rohlf Table 16.1 dataset on Air Pollution (from: http://math.fau.edu/Qian/course/sta4234/airpolut.htm)
IsPrivate?No (this computation is public)
User-defined keywords
Estimated Impact82
Family? (F = Feedback message, R = changed R code, M = changed R Module, P = changed Parameters, D = changed Data)
-       [Multiple Regression] [Sokal & Rohlf Air...] [2015-12-04 21:35:11] [d41d8cd98f00b204e9800998ecf8427e] [Current]
Feedback Forum

Post a new message
Dataseries X:
10	70.3	213	582	6	7.05	36
13	61	91	132	8.2	48.52	100
12	56.7	453	716	8.7	20.66	67
17	51.9	454	515	9	12.95	86
56	49.1	412	158	9	43.37	127
36	54	80	80	9	40.25	114
29	57.3	434	757	9.3	38.89	111
14	68.4	136	529	8.8	54.47	116
10	75.5	207	335	9	59.8	128
24	61.5	368	497	9.1	48.34	115
110	50.6	3344	3369	10.4	34.44	122
28	52.3	361	746	9.7	38.74	121
17	49	104	201	11.2	30.85	103
8	56.6	125	277	12.7	30.58	82
30	55.6	291	593	8.3	43.11	123
9	68.3	204	361	8.4	56.77	113
47	55	625	905	9.6	41.31	111
35	49.9	1064	1513	10.1	30.96	129
29	43.5	699	744	10.6	25.94	137
14	54.5	381	507	10	37	99
56	55.9	775	622	9.5	35.89	105
14	51.5	181	347	10.9	30.18	98
11	56.8	46	244	8.9	7.77	58
46	47.6	44	116	8.8	33.36	135
11	47.1	391	463	12.4	36.11	166
23	54	462	453	7.1	39.04	132
65	49.7	1007	751	10.9	34.99	155
26	51.5	266	540	8.6	37.01	134
69	54.6	1692	1950	9.6	39.93	115
61	50.4	347	520	9.4	36.22	147
94	50	343	179	10.6	42.75	125
10	61.6	337	624	9.2	49.1	105
18	59.4	275	448	7.9	46	119
9	66.2	641	844	10.9	35.94	78
10	68.9	721	1233	10.8	48.19	103
28	51	137	176	8.7	15.17	89
31	59.3	96	308	10.6	44.68	116
26	57.8	197	299	7.6	42.59	115
29	51.1	379	531	9.4	38.79	164
31	55.2	35	71	6.5	40.75	148
16	45.7	569	717	11.8	29.07	123


Summary of computational transaction
Raw Inputview raw input (R code)
Raw Outputview raw output of R engine
Computing time5 seconds
R Server'Sir Ronald Aylmer Fisher' @ fisher.wessa.net

\begin{tabular}{lllllllll}
\hline
Summary of computational transaction \tabularnewline
Raw Input & view raw input (R code)  \tabularnewline
Raw Output & view raw output of R engine  \tabularnewline
Computing time & 5 seconds \tabularnewline
R Server & 'Sir Ronald Aylmer Fisher' @ fisher.wessa.net \tabularnewline
\hline
\end{tabular}
%Source: https://freestatistics.org/blog/index.php?pk=285182&T=0

[TABLE]
[ROW][C]Summary of computational transaction[/C][/ROW]
[ROW][C]Raw Input[/C][C]view raw input (R code) [/C][/ROW]
[ROW][C]Raw Output[/C][C]view raw output of R engine [/C][/ROW]
[ROW][C]Computing time[/C][C]5 seconds[/C][/ROW]
[ROW][C]R Server[/C][C]'Sir Ronald Aylmer Fisher' @ fisher.wessa.net[/C][/ROW]
[/TABLE]
Source: https://freestatistics.org/blog/index.php?pk=285182&T=0

Globally Unique Identifier (entire table): ba.freestatistics.org/blog/index.php?pk=285182&T=0

As an alternative you can also use a QR Code:  

The GUIDs for individual cells are displayed in the table below:

Summary of computational transaction
Raw Inputview raw input (R code)
Raw Outputview raw output of R engine
Computing time5 seconds
R Server'Sir Ronald Aylmer Fisher' @ fisher.wessa.net


Multiple Linear Regression - Estimated Regression Equation
SO2[t] = + 111.728 -1.26794Temp[t] + 0.0649182Man[t] -0.0392767Pop[t] -3.18137Wind[t] + 0.512359Rain[t] -0.0520502RainDays[t] + e[t]

\begin{tabular}{lllllllll}
\hline
Multiple Linear Regression - Estimated Regression Equation \tabularnewline
SO2[t] =  +  111.728 -1.26794Temp[t] +  0.0649182Man[t] -0.0392767Pop[t] -3.18137Wind[t] +  0.512359Rain[t] -0.0520502RainDays[t]  + e[t] \tabularnewline
 \tabularnewline
\hline
\end{tabular}
%Source: https://freestatistics.org/blog/index.php?pk=285182&T=1

[TABLE]
[ROW][C]Multiple Linear Regression - Estimated Regression Equation[/C][/ROW]
[ROW][C]SO2[t] =  +  111.728 -1.26794Temp[t] +  0.0649182Man[t] -0.0392767Pop[t] -3.18137Wind[t] +  0.512359Rain[t] -0.0520502RainDays[t]  + e[t][/C][/ROW]
[ROW][C][/C][/ROW]
[/TABLE]
Source: https://freestatistics.org/blog/index.php?pk=285182&T=1

Globally Unique Identifier (entire table): ba.freestatistics.org/blog/index.php?pk=285182&T=1

As an alternative you can also use a QR Code:  

The GUIDs for individual cells are displayed in the table below:

Multiple Linear Regression - Estimated Regression Equation
SO2[t] = + 111.728 -1.26794Temp[t] + 0.0649182Man[t] -0.0392767Pop[t] -3.18137Wind[t] + 0.512359Rain[t] -0.0520502RainDays[t] + e[t]


Multiple Linear Regression - Ordinary Least Squares
VariableParameterS.D.T-STATH0: parameter = 02-tail p-value1-tail p-value
(Intercept)+111.7 47.32+2.3610e+00 0.02409 0.01204
Temp-1.268 0.6212-2.0410e+00 0.04906 0.02453
Man+0.06492 0.01575+4.1220e+00 0.0002278 0.0001139
Pop-0.03928 0.01513-2.5950e+00 0.01385 0.006923
Wind-3.181 1.815-1.7530e+00 0.08865 0.04433
Rain+0.5124 0.3628+1.4120e+00 0.1669 0.08346
RainDays-0.05205 0.162-3.2130e-01 0.75 0.375

\begin{tabular}{lllllllll}
\hline
Multiple Linear Regression - Ordinary Least Squares \tabularnewline
Variable & Parameter & S.D. & T-STATH0: parameter = 0 & 2-tail p-value & 1-tail p-value \tabularnewline
(Intercept) & +111.7 &  47.32 & +2.3610e+00 &  0.02409 &  0.01204 \tabularnewline
Temp & -1.268 &  0.6212 & -2.0410e+00 &  0.04906 &  0.02453 \tabularnewline
Man & +0.06492 &  0.01575 & +4.1220e+00 &  0.0002278 &  0.0001139 \tabularnewline
Pop & -0.03928 &  0.01513 & -2.5950e+00 &  0.01385 &  0.006923 \tabularnewline
Wind & -3.181 &  1.815 & -1.7530e+00 &  0.08865 &  0.04433 \tabularnewline
Rain & +0.5124 &  0.3628 & +1.4120e+00 &  0.1669 &  0.08346 \tabularnewline
RainDays & -0.05205 &  0.162 & -3.2130e-01 &  0.75 &  0.375 \tabularnewline
\hline
\end{tabular}
%Source: https://freestatistics.org/blog/index.php?pk=285182&T=2

[TABLE]
[ROW][C]Multiple Linear Regression - Ordinary Least Squares[/C][/ROW]
[ROW][C]Variable[/C][C]Parameter[/C][C]S.D.[/C][C]T-STATH0: parameter = 0[/C][C]2-tail p-value[/C][C]1-tail p-value[/C][/ROW]
[ROW][C](Intercept)[/C][C]+111.7[/C][C] 47.32[/C][C]+2.3610e+00[/C][C] 0.02409[/C][C] 0.01204[/C][/ROW]
[ROW][C]Temp[/C][C]-1.268[/C][C] 0.6212[/C][C]-2.0410e+00[/C][C] 0.04906[/C][C] 0.02453[/C][/ROW]
[ROW][C]Man[/C][C]+0.06492[/C][C] 0.01575[/C][C]+4.1220e+00[/C][C] 0.0002278[/C][C] 0.0001139[/C][/ROW]
[ROW][C]Pop[/C][C]-0.03928[/C][C] 0.01513[/C][C]-2.5950e+00[/C][C] 0.01385[/C][C] 0.006923[/C][/ROW]
[ROW][C]Wind[/C][C]-3.181[/C][C] 1.815[/C][C]-1.7530e+00[/C][C] 0.08865[/C][C] 0.04433[/C][/ROW]
[ROW][C]Rain[/C][C]+0.5124[/C][C] 0.3628[/C][C]+1.4120e+00[/C][C] 0.1669[/C][C] 0.08346[/C][/ROW]
[ROW][C]RainDays[/C][C]-0.05205[/C][C] 0.162[/C][C]-3.2130e-01[/C][C] 0.75[/C][C] 0.375[/C][/ROW]
[/TABLE]
Source: https://freestatistics.org/blog/index.php?pk=285182&T=2

Globally Unique Identifier (entire table): ba.freestatistics.org/blog/index.php?pk=285182&T=2

As an alternative you can also use a QR Code:  

The GUIDs for individual cells are displayed in the table below:

Multiple Linear Regression - Ordinary Least Squares
VariableParameterS.D.T-STATH0: parameter = 02-tail p-value1-tail p-value
(Intercept)+111.7 47.32+2.3610e+00 0.02409 0.01204
Temp-1.268 0.6212-2.0410e+00 0.04906 0.02453
Man+0.06492 0.01575+4.1220e+00 0.0002278 0.0001139
Pop-0.03928 0.01513-2.5950e+00 0.01385 0.006923
Wind-3.181 1.815-1.7530e+00 0.08865 0.04433
Rain+0.5124 0.3628+1.4120e+00 0.1669 0.08346
RainDays-0.05205 0.162-3.2130e-01 0.75 0.375


Multiple Linear Regression - Regression Statistics
Multiple R 0.8182
R-squared 0.6695
Adjusted R-squared 0.6112
F-TEST (value) 11.48
F-TEST (DF numerator)6
F-TEST (DF denominator)34
p-value 5.419e-07
Multiple Linear Regression - Residual Statistics
Residual Standard Deviation 14.64
Sum Squared Residuals 7283

\begin{tabular}{lllllllll}
\hline
Multiple Linear Regression - Regression Statistics \tabularnewline
Multiple R &  0.8182 \tabularnewline
R-squared &  0.6695 \tabularnewline
Adjusted R-squared &  0.6112 \tabularnewline
F-TEST (value) &  11.48 \tabularnewline
F-TEST (DF numerator) & 6 \tabularnewline
F-TEST (DF denominator) & 34 \tabularnewline
p-value &  5.419e-07 \tabularnewline
Multiple Linear Regression - Residual Statistics \tabularnewline
Residual Standard Deviation &  14.64 \tabularnewline
Sum Squared Residuals &  7283 \tabularnewline
\hline
\end{tabular}
%Source: https://freestatistics.org/blog/index.php?pk=285182&T=3

[TABLE]
[ROW][C]Multiple Linear Regression - Regression Statistics[/C][/ROW]
[ROW][C]Multiple R[/C][C] 0.8182[/C][/ROW]
[ROW][C]R-squared[/C][C] 0.6695[/C][/ROW]
[ROW][C]Adjusted R-squared[/C][C] 0.6112[/C][/ROW]
[ROW][C]F-TEST (value)[/C][C] 11.48[/C][/ROW]
[ROW][C]F-TEST (DF numerator)[/C][C]6[/C][/ROW]
[ROW][C]F-TEST (DF denominator)[/C][C]34[/C][/ROW]
[ROW][C]p-value[/C][C] 5.419e-07[/C][/ROW]
[ROW][C]Multiple Linear Regression - Residual Statistics[/C][/ROW]
[ROW][C]Residual Standard Deviation[/C][C] 14.64[/C][/ROW]
[ROW][C]Sum Squared Residuals[/C][C] 7283[/C][/ROW]
[/TABLE]
Source: https://freestatistics.org/blog/index.php?pk=285182&T=3

Globally Unique Identifier (entire table): ba.freestatistics.org/blog/index.php?pk=285182&T=3

As an alternative you can also use a QR Code:  

The GUIDs for individual cells are displayed in the table below:

Multiple Linear Regression - Regression Statistics
Multiple R 0.8182
R-squared 0.6695
Adjusted R-squared 0.6112
F-TEST (value) 11.48
F-TEST (DF numerator)6
F-TEST (DF denominator)34
p-value 5.419e-07
Multiple Linear Regression - Residual Statistics
Residual Standard Deviation 14.64
Sum Squared Residuals 7283


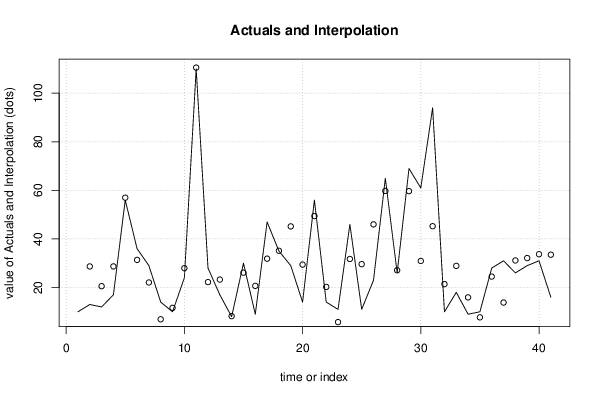
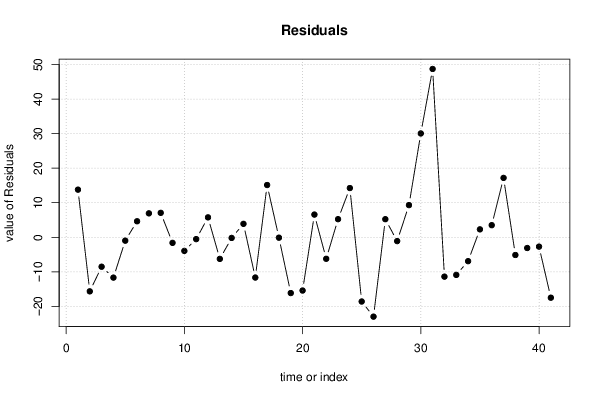
Multiple Linear Regression - Actuals, Interpolation, and Residuals
Time or IndexActualsInterpolationForecastResidualsPrediction Error
1 10-3.789 13.79
2 13 28.67-15.67
3 12 20.54-8.542
4 17 28.69-11.69
5 56 56.99-0.9915
6 36 31.37 4.633
7 29 22.08 6.921
8 14 6.927 7.073
9 10 11.62-1.624
10 24 27.95-3.951
11 110 110.5-0.543
12 28 22.24 5.758
13 17 23.27-6.27
14 8 8.195-0.1946
15 30 26.11 3.889
16 9 20.67-11.67
17 47 31.87 15.13
18 35 35.12-0.1218
19 29 45.17-16.17
20 14 29.44-15.44
21 56 49.43 6.568
22 14 20.24-6.236
23 11 5.76 5.24
24 46 31.74 14.26
25 11 29.62-18.62
26 23 46-23
27 65 59.77 5.23
28 26 27.12-1.116
29 69 59.68 9.318
30 61 30.93 30.07
31 94 45.24 48.76
32 10 21.41-11.41
33 18 28.91-10.91
34 9 15.93-6.931
35 10 7.716 2.284
36 28 24.51 3.493
37 31 13.81 17.19
38 26 31.14-5.144
39 29 32.12-3.118
40 31 33.72-2.718
41 16 33.51-17.51

\begin{tabular}{lllllllll}
\hline
Multiple Linear Regression - Actuals, Interpolation, and Residuals \tabularnewline
Time or Index & Actuals & InterpolationForecast & ResidualsPrediction Error \tabularnewline
1 &  10 & -3.789 &  13.79 \tabularnewline
2 &  13 &  28.67 & -15.67 \tabularnewline
3 &  12 &  20.54 & -8.542 \tabularnewline
4 &  17 &  28.69 & -11.69 \tabularnewline
5 &  56 &  56.99 & -0.9915 \tabularnewline
6 &  36 &  31.37 &  4.633 \tabularnewline
7 &  29 &  22.08 &  6.921 \tabularnewline
8 &  14 &  6.927 &  7.073 \tabularnewline
9 &  10 &  11.62 & -1.624 \tabularnewline
10 &  24 &  27.95 & -3.951 \tabularnewline
11 &  110 &  110.5 & -0.543 \tabularnewline
12 &  28 &  22.24 &  5.758 \tabularnewline
13 &  17 &  23.27 & -6.27 \tabularnewline
14 &  8 &  8.195 & -0.1946 \tabularnewline
15 &  30 &  26.11 &  3.889 \tabularnewline
16 &  9 &  20.67 & -11.67 \tabularnewline
17 &  47 &  31.87 &  15.13 \tabularnewline
18 &  35 &  35.12 & -0.1218 \tabularnewline
19 &  29 &  45.17 & -16.17 \tabularnewline
20 &  14 &  29.44 & -15.44 \tabularnewline
21 &  56 &  49.43 &  6.568 \tabularnewline
22 &  14 &  20.24 & -6.236 \tabularnewline
23 &  11 &  5.76 &  5.24 \tabularnewline
24 &  46 &  31.74 &  14.26 \tabularnewline
25 &  11 &  29.62 & -18.62 \tabularnewline
26 &  23 &  46 & -23 \tabularnewline
27 &  65 &  59.77 &  5.23 \tabularnewline
28 &  26 &  27.12 & -1.116 \tabularnewline
29 &  69 &  59.68 &  9.318 \tabularnewline
30 &  61 &  30.93 &  30.07 \tabularnewline
31 &  94 &  45.24 &  48.76 \tabularnewline
32 &  10 &  21.41 & -11.41 \tabularnewline
33 &  18 &  28.91 & -10.91 \tabularnewline
34 &  9 &  15.93 & -6.931 \tabularnewline
35 &  10 &  7.716 &  2.284 \tabularnewline
36 &  28 &  24.51 &  3.493 \tabularnewline
37 &  31 &  13.81 &  17.19 \tabularnewline
38 &  26 &  31.14 & -5.144 \tabularnewline
39 &  29 &  32.12 & -3.118 \tabularnewline
40 &  31 &  33.72 & -2.718 \tabularnewline
41 &  16 &  33.51 & -17.51 \tabularnewline
\hline
\end{tabular}
%Source: https://freestatistics.org/blog/index.php?pk=285182&T=4

[TABLE]
[ROW][C]Multiple Linear Regression - Actuals, Interpolation, and Residuals[/C][/ROW]
[ROW][C]Time or Index[/C][C]Actuals[/C][C]InterpolationForecast[/C][C]ResidualsPrediction Error[/C][/ROW]
[ROW][C]1[/C][C] 10[/C][C]-3.789[/C][C] 13.79[/C][/ROW]
[ROW][C]2[/C][C] 13[/C][C] 28.67[/C][C]-15.67[/C][/ROW]
[ROW][C]3[/C][C] 12[/C][C] 20.54[/C][C]-8.542[/C][/ROW]
[ROW][C]4[/C][C] 17[/C][C] 28.69[/C][C]-11.69[/C][/ROW]
[ROW][C]5[/C][C] 56[/C][C] 56.99[/C][C]-0.9915[/C][/ROW]
[ROW][C]6[/C][C] 36[/C][C] 31.37[/C][C] 4.633[/C][/ROW]
[ROW][C]7[/C][C] 29[/C][C] 22.08[/C][C] 6.921[/C][/ROW]
[ROW][C]8[/C][C] 14[/C][C] 6.927[/C][C] 7.073[/C][/ROW]
[ROW][C]9[/C][C] 10[/C][C] 11.62[/C][C]-1.624[/C][/ROW]
[ROW][C]10[/C][C] 24[/C][C] 27.95[/C][C]-3.951[/C][/ROW]
[ROW][C]11[/C][C] 110[/C][C] 110.5[/C][C]-0.543[/C][/ROW]
[ROW][C]12[/C][C] 28[/C][C] 22.24[/C][C] 5.758[/C][/ROW]
[ROW][C]13[/C][C] 17[/C][C] 23.27[/C][C]-6.27[/C][/ROW]
[ROW][C]14[/C][C] 8[/C][C] 8.195[/C][C]-0.1946[/C][/ROW]
[ROW][C]15[/C][C] 30[/C][C] 26.11[/C][C] 3.889[/C][/ROW]
[ROW][C]16[/C][C] 9[/C][C] 20.67[/C][C]-11.67[/C][/ROW]
[ROW][C]17[/C][C] 47[/C][C] 31.87[/C][C] 15.13[/C][/ROW]
[ROW][C]18[/C][C] 35[/C][C] 35.12[/C][C]-0.1218[/C][/ROW]
[ROW][C]19[/C][C] 29[/C][C] 45.17[/C][C]-16.17[/C][/ROW]
[ROW][C]20[/C][C] 14[/C][C] 29.44[/C][C]-15.44[/C][/ROW]
[ROW][C]21[/C][C] 56[/C][C] 49.43[/C][C] 6.568[/C][/ROW]
[ROW][C]22[/C][C] 14[/C][C] 20.24[/C][C]-6.236[/C][/ROW]
[ROW][C]23[/C][C] 11[/C][C] 5.76[/C][C] 5.24[/C][/ROW]
[ROW][C]24[/C][C] 46[/C][C] 31.74[/C][C] 14.26[/C][/ROW]
[ROW][C]25[/C][C] 11[/C][C] 29.62[/C][C]-18.62[/C][/ROW]
[ROW][C]26[/C][C] 23[/C][C] 46[/C][C]-23[/C][/ROW]
[ROW][C]27[/C][C] 65[/C][C] 59.77[/C][C] 5.23[/C][/ROW]
[ROW][C]28[/C][C] 26[/C][C] 27.12[/C][C]-1.116[/C][/ROW]
[ROW][C]29[/C][C] 69[/C][C] 59.68[/C][C] 9.318[/C][/ROW]
[ROW][C]30[/C][C] 61[/C][C] 30.93[/C][C] 30.07[/C][/ROW]
[ROW][C]31[/C][C] 94[/C][C] 45.24[/C][C] 48.76[/C][/ROW]
[ROW][C]32[/C][C] 10[/C][C] 21.41[/C][C]-11.41[/C][/ROW]
[ROW][C]33[/C][C] 18[/C][C] 28.91[/C][C]-10.91[/C][/ROW]
[ROW][C]34[/C][C] 9[/C][C] 15.93[/C][C]-6.931[/C][/ROW]
[ROW][C]35[/C][C] 10[/C][C] 7.716[/C][C] 2.284[/C][/ROW]
[ROW][C]36[/C][C] 28[/C][C] 24.51[/C][C] 3.493[/C][/ROW]
[ROW][C]37[/C][C] 31[/C][C] 13.81[/C][C] 17.19[/C][/ROW]
[ROW][C]38[/C][C] 26[/C][C] 31.14[/C][C]-5.144[/C][/ROW]
[ROW][C]39[/C][C] 29[/C][C] 32.12[/C][C]-3.118[/C][/ROW]
[ROW][C]40[/C][C] 31[/C][C] 33.72[/C][C]-2.718[/C][/ROW]
[ROW][C]41[/C][C] 16[/C][C] 33.51[/C][C]-17.51[/C][/ROW]
[/TABLE]
Source: https://freestatistics.org/blog/index.php?pk=285182&T=4

Globally Unique Identifier (entire table): ba.freestatistics.org/blog/index.php?pk=285182&T=4

As an alternative you can also use a QR Code:  

The GUIDs for individual cells are displayed in the table below:

Multiple Linear Regression - Actuals, Interpolation, and Residuals
Time or IndexActualsInterpolationForecastResidualsPrediction Error
1 10-3.789 13.79
2 13 28.67-15.67
3 12 20.54-8.542
4 17 28.69-11.69
5 56 56.99-0.9915
6 36 31.37 4.633
7 29 22.08 6.921
8 14 6.927 7.073
9 10 11.62-1.624
10 24 27.95-3.951
11 110 110.5-0.543
12 28 22.24 5.758
13 17 23.27-6.27
14 8 8.195-0.1946
15 30 26.11 3.889
16 9 20.67-11.67
17 47 31.87 15.13
18 35 35.12-0.1218
19 29 45.17-16.17
20 14 29.44-15.44
21 56 49.43 6.568
22 14 20.24-6.236
23 11 5.76 5.24
24 46 31.74 14.26
25 11 29.62-18.62
26 23 46-23
27 65 59.77 5.23
28 26 27.12-1.116
29 69 59.68 9.318
30 61 30.93 30.07
31 94 45.24 48.76
32 10 21.41-11.41
33 18 28.91-10.91
34 9 15.93-6.931
35 10 7.716 2.284
36 28 24.51 3.493
37 31 13.81 17.19
38 26 31.14-5.144
39 29 32.12-3.118
40 31 33.72-2.718
41 16 33.51-17.51


Goldfeld-Quandt test for Heteroskedasticity
p-valuesAlternative Hypothesis
breakpoint indexgreater2-sidedless
10 0.1405 0.281 0.8595
11 0.05442 0.1088 0.9456
12 0.02671 0.05342 0.9733
13 0.04057 0.08114 0.9594
14 0.03994 0.07987 0.9601
15 0.01767 0.03533 0.9823
16 0.01229 0.02457 0.9877
17 0.01475 0.0295 0.9852
18 0.01135 0.0227 0.9886
19 0.01024 0.02048 0.9898
20 0.01205 0.02411 0.9879
21 0.01128 0.02257 0.9887
22 0.00657 0.01314 0.9934
23 0.003711 0.007423 0.9963
24 0.003905 0.00781 0.9961
25 0.006653 0.01331 0.9933
26 0.01705 0.03411 0.9829
27 0.0281 0.05621 0.9719
28 0.01544 0.03087 0.9846
29 0.01483 0.02965 0.9852
30 0.1787 0.3574 0.8213
31 0.9734 0.05323 0.02662

\begin{tabular}{lllllllll}
\hline
Goldfeld-Quandt test for Heteroskedasticity \tabularnewline
p-values & Alternative Hypothesis \tabularnewline
breakpoint index & greater & 2-sided & less \tabularnewline
10 &  0.1405 &  0.281 &  0.8595 \tabularnewline
11 &  0.05442 &  0.1088 &  0.9456 \tabularnewline
12 &  0.02671 &  0.05342 &  0.9733 \tabularnewline
13 &  0.04057 &  0.08114 &  0.9594 \tabularnewline
14 &  0.03994 &  0.07987 &  0.9601 \tabularnewline
15 &  0.01767 &  0.03533 &  0.9823 \tabularnewline
16 &  0.01229 &  0.02457 &  0.9877 \tabularnewline
17 &  0.01475 &  0.0295 &  0.9852 \tabularnewline
18 &  0.01135 &  0.0227 &  0.9886 \tabularnewline
19 &  0.01024 &  0.02048 &  0.9898 \tabularnewline
20 &  0.01205 &  0.02411 &  0.9879 \tabularnewline
21 &  0.01128 &  0.02257 &  0.9887 \tabularnewline
22 &  0.00657 &  0.01314 &  0.9934 \tabularnewline
23 &  0.003711 &  0.007423 &  0.9963 \tabularnewline
24 &  0.003905 &  0.00781 &  0.9961 \tabularnewline
25 &  0.006653 &  0.01331 &  0.9933 \tabularnewline
26 &  0.01705 &  0.03411 &  0.9829 \tabularnewline
27 &  0.0281 &  0.05621 &  0.9719 \tabularnewline
28 &  0.01544 &  0.03087 &  0.9846 \tabularnewline
29 &  0.01483 &  0.02965 &  0.9852 \tabularnewline
30 &  0.1787 &  0.3574 &  0.8213 \tabularnewline
31 &  0.9734 &  0.05323 &  0.02662 \tabularnewline
\hline
\end{tabular}
%Source: https://freestatistics.org/blog/index.php?pk=285182&T=5

[TABLE]
[ROW][C]Goldfeld-Quandt test for Heteroskedasticity[/C][/ROW]
[ROW][C]p-values[/C][C]Alternative Hypothesis[/C][/ROW]
[ROW][C]breakpoint index[/C][C]greater[/C][C]2-sided[/C][C]less[/C][/ROW]
[ROW][C]10[/C][C] 0.1405[/C][C] 0.281[/C][C] 0.8595[/C][/ROW]
[ROW][C]11[/C][C] 0.05442[/C][C] 0.1088[/C][C] 0.9456[/C][/ROW]
[ROW][C]12[/C][C] 0.02671[/C][C] 0.05342[/C][C] 0.9733[/C][/ROW]
[ROW][C]13[/C][C] 0.04057[/C][C] 0.08114[/C][C] 0.9594[/C][/ROW]
[ROW][C]14[/C][C] 0.03994[/C][C] 0.07987[/C][C] 0.9601[/C][/ROW]
[ROW][C]15[/C][C] 0.01767[/C][C] 0.03533[/C][C] 0.9823[/C][/ROW]
[ROW][C]16[/C][C] 0.01229[/C][C] 0.02457[/C][C] 0.9877[/C][/ROW]
[ROW][C]17[/C][C] 0.01475[/C][C] 0.0295[/C][C] 0.9852[/C][/ROW]
[ROW][C]18[/C][C] 0.01135[/C][C] 0.0227[/C][C] 0.9886[/C][/ROW]
[ROW][C]19[/C][C] 0.01024[/C][C] 0.02048[/C][C] 0.9898[/C][/ROW]
[ROW][C]20[/C][C] 0.01205[/C][C] 0.02411[/C][C] 0.9879[/C][/ROW]
[ROW][C]21[/C][C] 0.01128[/C][C] 0.02257[/C][C] 0.9887[/C][/ROW]
[ROW][C]22[/C][C] 0.00657[/C][C] 0.01314[/C][C] 0.9934[/C][/ROW]
[ROW][C]23[/C][C] 0.003711[/C][C] 0.007423[/C][C] 0.9963[/C][/ROW]
[ROW][C]24[/C][C] 0.003905[/C][C] 0.00781[/C][C] 0.9961[/C][/ROW]
[ROW][C]25[/C][C] 0.006653[/C][C] 0.01331[/C][C] 0.9933[/C][/ROW]
[ROW][C]26[/C][C] 0.01705[/C][C] 0.03411[/C][C] 0.9829[/C][/ROW]
[ROW][C]27[/C][C] 0.0281[/C][C] 0.05621[/C][C] 0.9719[/C][/ROW]
[ROW][C]28[/C][C] 0.01544[/C][C] 0.03087[/C][C] 0.9846[/C][/ROW]
[ROW][C]29[/C][C] 0.01483[/C][C] 0.02965[/C][C] 0.9852[/C][/ROW]
[ROW][C]30[/C][C] 0.1787[/C][C] 0.3574[/C][C] 0.8213[/C][/ROW]
[ROW][C]31[/C][C] 0.9734[/C][C] 0.05323[/C][C] 0.02662[/C][/ROW]
[/TABLE]
Source: https://freestatistics.org/blog/index.php?pk=285182&T=5

Globally Unique Identifier (entire table): ba.freestatistics.org/blog/index.php?pk=285182&T=5

As an alternative you can also use a QR Code:  

The GUIDs for individual cells are displayed in the table below:

Goldfeld-Quandt test for Heteroskedasticity
p-valuesAlternative Hypothesis
breakpoint indexgreater2-sidedless
10 0.1405 0.281 0.8595
11 0.05442 0.1088 0.9456
12 0.02671 0.05342 0.9733
13 0.04057 0.08114 0.9594
14 0.03994 0.07987 0.9601
15 0.01767 0.03533 0.9823
16 0.01229 0.02457 0.9877
17 0.01475 0.0295 0.9852
18 0.01135 0.0227 0.9886
19 0.01024 0.02048 0.9898
20 0.01205 0.02411 0.9879
21 0.01128 0.02257 0.9887
22 0.00657 0.01314 0.9934
23 0.003711 0.007423 0.9963
24 0.003905 0.00781 0.9961
25 0.006653 0.01331 0.9933
26 0.01705 0.03411 0.9829
27 0.0281 0.05621 0.9719
28 0.01544 0.03087 0.9846
29 0.01483 0.02965 0.9852
30 0.1787 0.3574 0.8213
31 0.9734 0.05323 0.02662


Meta Analysis of Goldfeld-Quandt test for Heteroskedasticity
Description# significant tests% significant testsOK/NOK
1% type I error level2 0.09091NOK
5% type I error level140.636364NOK
10% type I error level190.863636NOK

\begin{tabular}{lllllllll}
\hline
Meta Analysis of Goldfeld-Quandt test for Heteroskedasticity \tabularnewline
Description & # significant tests & % significant tests & OK/NOK \tabularnewline
1% type I error level & 2 &  0.09091 & NOK \tabularnewline
5% type I error level & 14 & 0.636364 & NOK \tabularnewline
10% type I error level & 19 & 0.863636 & NOK \tabularnewline
\hline
\end{tabular}
%Source: https://freestatistics.org/blog/index.php?pk=285182&T=6

[TABLE]
[ROW][C]Meta Analysis of Goldfeld-Quandt test for Heteroskedasticity[/C][/ROW]
[ROW][C]Description[/C][C]# significant tests[/C][C]% significant tests[/C][C]OK/NOK[/C][/ROW]
[ROW][C]1% type I error level[/C][C]2[/C][C] 0.09091[/C][C]NOK[/C][/ROW]
[ROW][C]5% type I error level[/C][C]14[/C][C]0.636364[/C][C]NOK[/C][/ROW]
[ROW][C]10% type I error level[/C][C]19[/C][C]0.863636[/C][C]NOK[/C][/ROW]
[/TABLE]
Source: https://freestatistics.org/blog/index.php?pk=285182&T=6

Globally Unique Identifier (entire table): ba.freestatistics.org/blog/index.php?pk=285182&T=6

As an alternative you can also use a QR Code:  

The GUIDs for individual cells are displayed in the table below:

Meta Analysis of Goldfeld-Quandt test for Heteroskedasticity
Description# significant tests% significant testsOK/NOK
1% type I error level2 0.09091NOK
5% type I error level140.636364NOK
10% type I error level190.863636NOK


Parameters (Session):
par1 = 1 ; par2 = Do not include Seasonal Dummies ; par3 = No Linear Trend ; par4 = 0 ; par5 = 0 ;
Parameters (R input):
par1 = 1 ; par2 = Do not include Seasonal Dummies ; par3 = No Linear Trend ; par4 = 0 ; par5 = 0 ;
R code (references can be found in the software module):
par5 <- '0'
par4 <- '0'
par3 <- 'No Linear Trend'
par2 <- 'Do not include Seasonal Dummies'
par1 <- '1'
library(lattice)
library(lmtest)
n25 <- 25 #minimum number of obs. for Goldfeld-Quandt test
mywarning <- ''
par1 <- as.numeric(par1)
if(is.na(par1)) {
par1 <- 1
mywarning = 'Warning: you did not specify the column number of the endogenous series! The first column was selected by default.'
}
if (par4=='') par4 <- 0
par4 <- as.numeric(par4)
if (par5=='') par5 <- 0
par5 <- as.numeric(par5)
x <- na.omit(t(y))
k <- length(x[1,])
n <- length(x[,1])
x1 <- cbind(x[,par1], x[,1:k!=par1])
mycolnames <- c(colnames(x)[par1], colnames(x)[1:k!=par1])
colnames(x1) <- mycolnames #colnames(x)[par1]
x <- x1
if (par3 == 'First Differences'){
x2 <- array(0, dim=c(n-1,k), dimnames=list(1:(n-1), paste('(1-B)',colnames(x),sep='')))
for (i in 1:n-1) {
for (j in 1:k) {
x2[i,j] <- x[i+1,j] - x[i,j]
}
}
x <- x2
}
if(par4 > 0) {
x2 <- array(0, dim=c(n-par4,par4), dimnames=list(1:(n-par4), paste(colnames(x)[par1],'(t-',1:par4,')',sep='')))
for (i in 1:(n-par4)) {
for (j in 1:par4) {
x2[i,j] <- x[i+par4-j,par1]
}
}
x <- cbind(x[(par4+1):n,], x2)
n <- n - par4
}
if (par2 == 'Include Monthly Dummies'){
x2 <- array(0, dim=c(n,11), dimnames=list(1:n, paste('M', seq(1:11), sep ='')))
for (i in 1:11){
x2[seq(i,n,12),i] <- 1
}
x <- cbind(x, x2)
}
if (par2 == 'Include Quarterly Dummies'){
x2 <- array(0, dim=c(n,3), dimnames=list(1:n, paste('Q', seq(1:3), sep ='')))
for (i in 1:3){
x2[seq(i,n,4),i] <- 1
}
x <- cbind(x, x2)
}
k <- length(x[1+par4,])
if (par3 == 'Linear Trend'){
x <- cbind(x, c(1:n))
colnames(x)[k+1] <- 't'
}
x
k <- length(x[1+par4,])
df <- as.data.frame(x)
(mylm <- lm(df))
(mysum <- summary(mylm))
if (n > n25) {
kp3 <- k + 3
nmkm3 <- n - k - 3
gqarr <- array(NA, dim=c(nmkm3-kp3+1,3))
numgqtests <- 0
numsignificant1 <- 0
numsignificant5 <- 0
numsignificant10 <- 0
for (mypoint in kp3:nmkm3) {
j <- 0
numgqtests <- numgqtests + 1
for (myalt in c('greater', 'two.sided', 'less')) {
j <- j + 1
gqarr[mypoint-kp3+1,j] <- gqtest(mylm, point=mypoint, alternative=myalt)$p.value
}
if (gqarr[mypoint-kp3+1,2] < 0.01) numsignificant1 <- numsignificant1 + 1
if (gqarr[mypoint-kp3+1,2] < 0.05) numsignificant5 <- numsignificant5 + 1
if (gqarr[mypoint-kp3+1,2] < 0.10) numsignificant10 <- numsignificant10 + 1
}
gqarr
}
bitmap(file='test0.png')
plot(x[,1], type='l', main='Actuals and Interpolation', ylab='value of Actuals and Interpolation (dots)', xlab='time or index')
points(x[,1]-mysum$resid)
grid()
dev.off()
bitmap(file='test1.png')
plot(mysum$resid, type='b', pch=19, main='Residuals', ylab='value of Residuals', xlab='time or index')
grid()
dev.off()
bitmap(file='test2.png')
hist(mysum$resid, main='Residual Histogram', xlab='values of Residuals')
grid()
dev.off()
bitmap(file='test3.png')
densityplot(~mysum$resid,col='black',main='Residual Density Plot', xlab='values of Residuals')
dev.off()
bitmap(file='test4.png')
qqnorm(mysum$resid, main='Residual Normal Q-Q Plot')
qqline(mysum$resid)
grid()
dev.off()
(myerror <- as.ts(mysum$resid))
bitmap(file='test5.png')
dum <- cbind(lag(myerror,k=1),myerror)
dum
dum1 <- dum[2:length(myerror),]
dum1
z <- as.data.frame(dum1)
z
plot(z,main=paste('Residual Lag plot, lowess, and regression line'), ylab='values of Residuals', xlab='lagged values of Residuals')
lines(lowess(z))
abline(lm(z))
grid()
dev.off()
bitmap(file='test6.png')
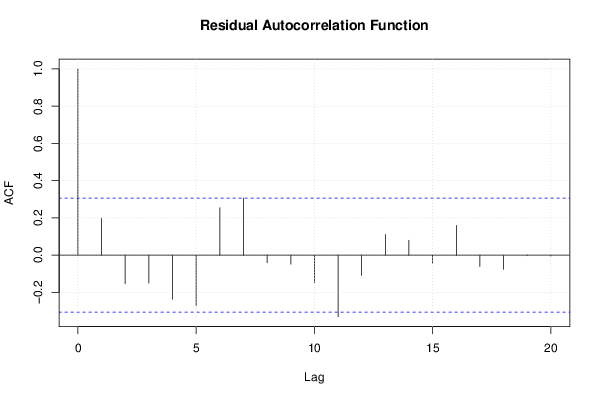
acf(mysum$resid, lag.max=length(mysum$resid)/2, main='Residual Autocorrelation Function')
grid()
dev.off()
bitmap(file='test7.png')
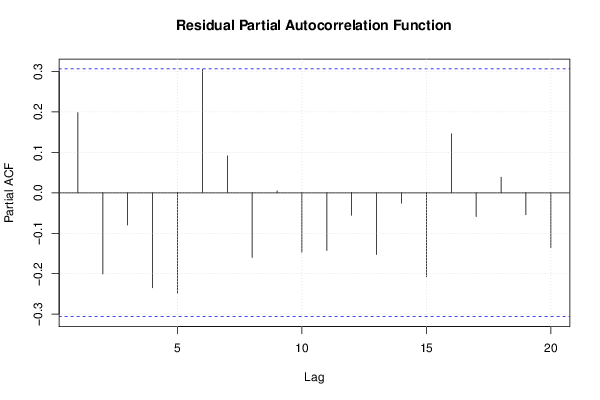
pacf(mysum$resid, lag.max=length(mysum$resid)/2, main='Residual Partial Autocorrelation Function')
grid()
dev.off()
bitmap(file='test8.png')
opar <- par(mfrow = c(2,2), oma = c(0, 0, 1.1, 0))
plot(mylm, las = 1, sub='Residual Diagnostics')
par(opar)
dev.off()
if (n > n25) {
bitmap(file='test9.png')
plot(kp3:nmkm3,gqarr[,2], main='Goldfeld-Quandt test',ylab='2-sided p-value',xlab='breakpoint')
grid()
dev.off()
}
load(file='createtable')
a<-table.start()
a<-table.row.start(a)
a<-table.element(a, 'Multiple Linear Regression - Estimated Regression Equation', 1, TRUE)
a<-table.row.end(a)
myeq <- colnames(x)[1]
myeq <- paste(myeq, '[t] = ', sep='')
for (i in 1:k){
if (mysum$coefficients[i,1] > 0) myeq <- paste(myeq, '+', '')
myeq <- paste(myeq, signif(mysum$coefficients[i,1],6), sep=' ')
if (rownames(mysum$coefficients)[i] != '(Intercept)') {
myeq <- paste(myeq, rownames(mysum$coefficients)[i], sep='')
if (rownames(mysum$coefficients)[i] != 't') myeq <- paste(myeq, '[t]', sep='')
}
}
myeq <- paste(myeq, ' + e[t]')
a<-table.row.start(a)
a<-table.element(a, myeq)
a<-table.row.end(a)
a<-table.row.start(a)
a<-table.element(a, mywarning)
a<-table.row.end(a)
a<-table.end(a)
table.save(a,file='mytable1.tab')
a<-table.start()
a<-table.row.start(a)
a<-table.element(a,hyperlink('ols1.htm','Multiple Linear Regression - Ordinary Least Squares',''), 6, TRUE)
a<-table.row.end(a)
a<-table.row.start(a)
a<-table.element(a,'Variable',header=TRUE)
a<-table.element(a,'Parameter',header=TRUE)
a<-table.element(a,'S.D.',header=TRUE)
a<-table.element(a,'T-STAT
H0: parameter = 0',header=TRUE)
a<-table.element(a,'2-tail p-value',header=TRUE)
a<-table.element(a,'1-tail p-value',header=TRUE)
a<-table.row.end(a)
for (i in 1:k){
a<-table.row.start(a)
a<-table.element(a,rownames(mysum$coefficients)[i],header=TRUE)
a<-table.element(a,formatC(signif(mysum$coefficients[i,1],5),format='g',flag='+'))
a<-table.element(a,formatC(signif(mysum$coefficients[i,2],5),format='g',flag=' '))
a<-table.element(a,formatC(signif(mysum$coefficients[i,3],4),format='e',flag='+'))
a<-table.element(a,formatC(signif(mysum$coefficients[i,4],4),format='g',flag=' '))
a<-table.element(a,formatC(signif(mysum$coefficients[i,4]/2,4),format='g',flag=' '))
a<-table.row.end(a)
}
a<-table.end(a)
table.save(a,file='mytable2.tab')
a<-table.start()
a<-table.row.start(a)
a<-table.element(a, 'Multiple Linear Regression - Regression Statistics', 2, TRUE)
a<-table.row.end(a)
a<-table.row.start(a)
a<-table.element(a, 'Multiple R',1,TRUE)
a<-table.element(a,formatC(signif(sqrt(mysum$r.squared),6),format='g',flag=' '))
a<-table.row.end(a)
a<-table.row.start(a)
a<-table.element(a, 'R-squared',1,TRUE)
a<-table.element(a,formatC(signif(mysum$r.squared,6),format='g',flag=' '))
a<-table.row.end(a)
a<-table.row.start(a)
a<-table.element(a, 'Adjusted R-squared',1,TRUE)
a<-table.element(a,formatC(signif(mysum$adj.r.squared,6),format='g',flag=' '))
a<-table.row.end(a)
a<-table.row.start(a)
a<-table.element(a, 'F-TEST (value)',1,TRUE)
a<-table.element(a,formatC(signif(mysum$fstatistic[1],6),format='g',flag=' '))
a<-table.row.end(a)
a<-table.row.start(a)
a<-table.element(a, 'F-TEST (DF numerator)',1,TRUE)
a<-table.element(a, signif(mysum$fstatistic[2],6))
a<-table.row.end(a)
a<-table.row.start(a)
a<-table.element(a, 'F-TEST (DF denominator)',1,TRUE)
a<-table.element(a, signif(mysum$fstatistic[3],6))
a<-table.row.end(a)
a<-table.row.start(a)
a<-table.element(a, 'p-value',1,TRUE)
a<-table.element(a,formatC(signif(1-pf(mysum$fstatistic[1],mysum$fstatistic[2],mysum$fstatistic[3]),6),format='g',flag=' '))
a<-table.row.end(a)
a<-table.row.start(a)
a<-table.element(a, 'Multiple Linear Regression - Residual Statistics', 2, TRUE)
a<-table.row.end(a)
a<-table.row.start(a)
a<-table.element(a, 'Residual Standard Deviation',1,TRUE)
a<-table.element(a,formatC(signif(mysum$sigma,6),format='g',flag=' '))
a<-table.row.end(a)
a<-table.row.start(a)
a<-table.element(a, 'Sum Squared Residuals',1,TRUE)
a<-table.element(a,formatC(signif(sum(myerror*myerror),6),format='g',flag=' '))
a<-table.row.end(a)
a<-table.end(a)
table.save(a,file='mytable3.tab')
if(n < 200) {
a<-table.start()
a<-table.row.start(a)
a<-table.element(a, 'Multiple Linear Regression - Actuals, Interpolation, and Residuals', 4, TRUE)
a<-table.row.end(a)
a<-table.row.start(a)
a<-table.element(a, 'Time or Index', 1, TRUE)
a<-table.element(a, 'Actuals', 1, TRUE)
a<-table.element(a, 'Interpolation
Forecast', 1, TRUE)
a<-table.element(a, 'Residuals
Prediction Error', 1, TRUE)
a<-table.row.end(a)
for (i in 1:n) {
a<-table.row.start(a)
a<-table.element(a,i, 1, TRUE)
a<-table.element(a,formatC(signif(x[i],6),format='g',flag=' '))
a<-table.element(a,formatC(signif(x[i]-mysum$resid[i],6),format='g',flag=' '))
a<-table.element(a,formatC(signif(mysum$resid[i],6),format='g',flag=' '))
a<-table.row.end(a)
}
a<-table.end(a)
table.save(a,file='mytable4.tab')
if (n > n25) {
a<-table.start()
a<-table.row.start(a)
a<-table.element(a,'Goldfeld-Quandt test for Heteroskedasticity',4,TRUE)
a<-table.row.end(a)
a<-table.row.start(a)
a<-table.element(a,'p-values',header=TRUE)
a<-table.element(a,'Alternative Hypothesis',3,header=TRUE)
a<-table.row.end(a)
a<-table.row.start(a)
a<-table.element(a,'breakpoint index',header=TRUE)
a<-table.element(a,'greater',header=TRUE)
a<-table.element(a,'2-sided',header=TRUE)
a<-table.element(a,'less',header=TRUE)
a<-table.row.end(a)
for (mypoint in kp3:nmkm3) {
a<-table.row.start(a)
a<-table.element(a,mypoint,header=TRUE)
a<-table.element(a,formatC(signif(gqarr[mypoint-kp3+1,1],6),format='g',flag=' '))
a<-table.element(a,formatC(signif(gqarr[mypoint-kp3+1,2],6),format='g',flag=' '))
a<-table.element(a,formatC(signif(gqarr[mypoint-kp3+1,3],6),format='g',flag=' '))
a<-table.row.end(a)
}
a<-table.end(a)
table.save(a,file='mytable5.tab')
a<-table.start()
a<-table.row.start(a)
a<-table.element(a,'Meta Analysis of Goldfeld-Quandt test for Heteroskedasticity',4,TRUE)
a<-table.row.end(a)
a<-table.row.start(a)
a<-table.element(a,'Description',header=TRUE)
a<-table.element(a,'# significant tests',header=TRUE)
a<-table.element(a,'% significant tests',header=TRUE)
a<-table.element(a,'OK/NOK',header=TRUE)
a<-table.row.end(a)
a<-table.row.start(a)
a<-table.element(a,'1% type I error level',header=TRUE)
a<-table.element(a,signif(numsignificant1,6))
a<-table.element(a,formatC(signif(numsignificant1/numgqtests,6),format='g',flag=' '))
if (numsignificant1/numgqtests < 0.01) dum <- 'OK' else dum <- 'NOK'
a<-table.element(a,dum)
a<-table.row.end(a)
a<-table.row.start(a)
a<-table.element(a,'5% type I error level',header=TRUE)
a<-table.element(a,signif(numsignificant5,6))
a<-table.element(a,signif(numsignificant5/numgqtests,6))
if (numsignificant5/numgqtests < 0.05) dum <- 'OK' else dum <- 'NOK'
a<-table.element(a,dum)
a<-table.row.end(a)
a<-table.row.start(a)
a<-table.element(a,'10% type I error level',header=TRUE)
a<-table.element(a,signif(numsignificant10,6))
a<-table.element(a,signif(numsignificant10/numgqtests,6))
if (numsignificant10/numgqtests < 0.1) dum <- 'OK' else dum <- 'NOK'
a<-table.element(a,dum)
a<-table.row.end(a)
a<-table.end(a)
table.save(a,file='mytable6.tab')
}
}