Free Statistics

of Irreproducible Research!

Author's title

Author*The author of this computation has been verified*
R Software Modulerwasp_multipleregression.wasp
Title produced by softwareMultiple Regression
Date of computationSat, 05 Dec 2015 13:01:04 +0000
Cite this page as followsStatistical Computations at FreeStatistics.org, Office for Research Development and Education, URL https://freestatistics.org/blog/index.php?v=date/2015/Dec/05/t1449320557hku02nn5fkmxbuk.htm/, Retrieved Fri, 17 May 2024 18:44:01 +0000
Statistical Computations at FreeStatistics.org, Office for Research Development and Education, URL https://freestatistics.org/blog/index.php?pk=285198, Retrieved Fri, 17 May 2024 18:44:01 +0000
QR Codes:

Original text written by user:
IsPrivate?No (this computation is public)
User-defined keywords
Estimated Impact125
Family? (F = Feedback message, R = changed R code, M = changed R Module, P = changed Parameters, D = changed Data)
-       [Multiple Regression] [V_A Computation 1] [2015-12-05 13:01:04] [e73b7cd66085b2a8dc50e64bc3434afa] [Current]
Feedback Forum

Post a new message
Dataseries X:
-5 -25 50 14 17 -12 -6 19 -29
-1 -19 53 14 20 -9 -2 20 -29
-2 -20 50 16 19 -12 -4 21 -29
-5 -21 50 19 21 -10 -5 20 -27
-4 -19 51 18 17 -10 -2 21 -29
-6 -17 53 19 15 -11 -4 19 -24
-2 -16 49 20 18 -11 -4 22 -29
-2 -10 54 20 19 -10 -5 20 -21
-2 -16 57 24 16 -13 -7 18 -20
-2 -10 58 18 21 -10 -5 16 -26
2 -8 56 15 26 -6 -6 17 -19
1 -7 60 25 23 -9 -4 18 -22
-8 -15 55 23 24 -8 -2 19 -22
-1 -7 54 20 23 -12 -3 18 -15
1 -6 52 20 19 -10 0 20 -16
-1 -6 55 22 25 -11 -4 21 -22
2 2 56 25 21 -13 -3 18 -21
2 -4 54 22 19 -10 -3 19 -11
1 -4 53 26 20 -10 -3 19 -10
-1 -8 59 27 20 -11 -4 19 -6
-2 -10 62 41 17 -11 -5 21 -8
-2 -16 63 29 25 -11 -5 19 -15
-1 -14 64 33 19 -10 -6 19 -16
-8 -30 75 39 13 -13 -10 17 -24
-4 -33 77 27 15 -12 -11 16 -27
-6 -40 79 27 15 -13 -13 16 -33
-3 -38 77 25 13 -15 -12 17 -29
-3 -39 82 19 11 -16 -13 16 -34
-7 -46 83 15 9 -18 -12 15 -37
-9 -50 81 19 2 -17 -15 16 -31
-11 -55 78 23 -2 -18 -14 16 -33
-13 -66 79 23 -4 -20 -16 16 -25
-11 -63 79 7 -2 -22 -16 18 -27
-9 -56 73 1 1 -17 -12 19 -21
-17 -66 72 7 -13 -19 -16 16 -32
-22 -63 67 4 -11 -18 -15 16 -31
-25 -69 67 -8 -14 -26 -17 16 -32
-20 -69 50 -14 -4 -19 -15 18 -30
-24 -72 45 -10 -9 -23 -14 16 -34
-24 -69 39 -11 -5 -21 -15 15 -35
-22 -67 39 -10 -4 -27 -14 15 -37
-19 -64 37 -8 -8 -27 -16 16 -32
-18 -61 30 -8 -1 -21 -11 18 -28
-17 -58 24 -7 -2 -22 -14 16 -26
-11 -47 27 -8 -1 -24 -12 19 -24
-11 -44 19 -4 8 -21 -11 19 -27
-12 -42 19 3 8 -21 -13 18 -26
-10 -34 25 -5 6 -22 -12 17 -27
-15 -38 16 -4 7 -25 -12 19 -27
-15 -41 20 5 2 -21 -10 22 -24
-15 -38 25 3 3 -26 -12 19 -28
-13 -37 34 6 0 -27 -11 19 -23
-8 -22 39 10 5 -22 -10 16 -23
-13 -37 40 16 -1 -22 -12 18 -29
-9 -36 38 11 3 -20 -12 20 -25
-7 -25 42 10 4 -21 -11 17 -24
-4 -15 46 21 8 -16 -12 17 -20
-4 -17 48 18 10 -17 -9 17 -22
-2 -19 51 20 14 -19 -6 20 -24
0 -12 55 18 15 -20 -7 21 -27
-2 -17 52 23 9 -20 -7 19 -25
-3 -21 55 28 8 -20 -10 18 -26
1 -10 58 31 10 -19 -8 20 -24
-2 -19 72 38 5 -20 -11 17 -26
-1 -14 70 27 4 -25 -12 15 -22
1 -8 70 21 8 -25 -11 17 -20
-3 -16 63 31 8 -22 -11 18 -26
-4 -14 66 31 10 -19 -9 20 -22
-9 -30 65 29 8 -20 -9 19 -29
-9 -33 55 24 10 -18 -12 20 -30
-7 -37 57 27 -8 -17 -10 22 -26
-14 -47 60 36 -6 -17 -10 20 -30
-12 -48 63 35 -10 -21 -13 21 -33
-16 -50 65 44 -15 -17 -13 19 -33
-20 -56 61 39 -21 -22 -12 22 -31
-12 -47 65 26 -24 -24 -14 19 -36
-12 -37 63 27 -15 -18 -9 21 -43
-10 -35 59 17 -12 -20 -12 19 -40
-10 -29 56 20 -11 -21 -10 21 -38
-13 -28 54 22 -11 -17 -13 18 -41
-16 -29 56 32 -13 -17 -11 18 -38
-14 -33 54 28 -10 -17 -11 20 -40
-17 -41 58 30 -9 -21 -11 19 -41
-24 -52 59 36 -11 -18 -12 19 -45
-25 -49 60 38 -17 -20 -13 17 -54
-23 -47 57 33 -14 -18 -10 18 -47
-17 -37 54 25 -15 -20 -11 17 -44
-24 -49 52 24 -17 -21 -10 18 -47
-20 -44 50 24 -14 -18 -12 19 -47
-19 -39 51 20 -14 -17 -10 17 -45
-18 -38 47 23 -16 -17 -10 19 -42
-16 -35 51 23 -15 -21 -11 19 -42
-12 -24 46 19 -14 -19 -12 17 -39
-7 -11 44 16 -15 -17 -8 19 -35
-6 -10 39 12 -7 -15 -6 21 -29
-6 -10 43 14 -7 -12 -6 20 -37
-5 -9 46 20 -1 -12 -4 19 -35
-4 -3 43 16 -5 -12 -6 21 -32
-4 -3 34 12 -3 -10 -6 20 -33
-8 -5 36 15 1 -17 -6 18 -37
-9 -8 34 9 -4 -16 -8 18 -36
-6 -6 38 19 -7 -17 -7 16 -34
-7 -9 32 12 -4 -14 -8 18 -38
-10 -13 38 19 -4 -8 -7 19 -33
-11 -20 30 17 -7 -14 -8 18 -41
-11 -22 17 8 3 -14 -7 18 -39
-12 -25 14 3 0 -16 -9 17 -40
-14 -28 18 14 -3 -19 -10 18 -42
-12 -28 18 6 -3 -22 -10 19 -45
-9 -23 13 2 -3 -17 -9 18 -39
-5 -20 9 -1 1 -15 -8 19 -44
-6 -20 12 8 2 -15 -8 19 -44
-6 -20 19 8 -1 -17 -7 20 -43
-3 -14 20 11 4 -14 -7 21 -39
-2 -7 25 15 2 -17 -11 17 -38
-6 -10 26 15 1 -14 -9 20 -43
-6 -14 29 26 1 -14 -11 21 -46
-10 -11 28 23 0 -14 -10 18 -42
-8 -15 30 20 3 -12 -13 19 -45
-4 -10 38 26 1 -17 -13 20 -46


Summary of computational transaction
Raw Inputview raw input (R code)
Raw Outputview raw output of R engine
Computing time6 seconds
R Server'George Udny Yule' @ yule.wessa.net

\begin{tabular}{lllllllll}
\hline
Summary of computational transaction \tabularnewline
Raw Input & view raw input (R code)  \tabularnewline
Raw Output & view raw output of R engine  \tabularnewline
Computing time & 6 seconds \tabularnewline
R Server & 'George Udny Yule' @ yule.wessa.net \tabularnewline
\hline
\end{tabular}
%Source: https://freestatistics.org/blog/index.php?pk=285198&T=0

[TABLE]
[ROW][C]Summary of computational transaction[/C][/ROW]
[ROW][C]Raw Input[/C][C]view raw input (R code) [/C][/ROW]
[ROW][C]Raw Output[/C][C]view raw output of R engine [/C][/ROW]
[ROW][C]Computing time[/C][C]6 seconds[/C][/ROW]
[ROW][C]R Server[/C][C]'George Udny Yule' @ yule.wessa.net[/C][/ROW]
[/TABLE]
Source: https://freestatistics.org/blog/index.php?pk=285198&T=0

Globally Unique Identifier (entire table): ba.freestatistics.org/blog/index.php?pk=285198&T=0

As an alternative you can also use a QR Code:  

The GUIDs for individual cells are displayed in the table below:

Summary of computational transaction
Raw Inputview raw input (R code)
Raw Outputview raw output of R engine
Computing time6 seconds
R Server'George Udny Yule' @ yule.wessa.net


Multiple Linear Regression - Estimated Regression Equation
consumentenvertrouwen[t] = -19.6621 + 0.334292econ_situatie_12m[t] + 0.129269cons_prijzen_12m[t] -0.118926vooruitz_cpi_12m[t] + 0.220625gunstig_bel_aankopen[t] + 0.0140224vooruitz_aankopen[t] -0.562905verloop_fin_12m[t] + 0.656171fin_sit_gezinnen[t] + 0.0539707gunstig_sparen[t] + e[t]

\begin{tabular}{lllllllll}
\hline
Multiple Linear Regression - Estimated Regression Equation \tabularnewline
consumentenvertrouwen[t] =  -19.6621 +  0.334292econ_situatie_12m[t] +  0.129269cons_prijzen_12m[t] -0.118926vooruitz_cpi_12m[t] +  0.220625gunstig_bel_aankopen[t] +  0.0140224vooruitz_aankopen[t] -0.562905verloop_fin_12m[t] +  0.656171fin_sit_gezinnen[t] +  0.0539707gunstig_sparen[t]  + e[t] \tabularnewline
 \tabularnewline
\hline
\end{tabular}
%Source: https://freestatistics.org/blog/index.php?pk=285198&T=1

[TABLE]
[ROW][C]Multiple Linear Regression - Estimated Regression Equation[/C][/ROW]
[ROW][C]consumentenvertrouwen[t] =  -19.6621 +  0.334292econ_situatie_12m[t] +  0.129269cons_prijzen_12m[t] -0.118926vooruitz_cpi_12m[t] +  0.220625gunstig_bel_aankopen[t] +  0.0140224vooruitz_aankopen[t] -0.562905verloop_fin_12m[t] +  0.656171fin_sit_gezinnen[t] +  0.0539707gunstig_sparen[t]  + e[t][/C][/ROW]
[ROW][C][/C][/ROW]
[/TABLE]
Source: https://freestatistics.org/blog/index.php?pk=285198&T=1

Globally Unique Identifier (entire table): ba.freestatistics.org/blog/index.php?pk=285198&T=1

As an alternative you can also use a QR Code:  

The GUIDs for individual cells are displayed in the table below:

Multiple Linear Regression - Estimated Regression Equation
consumentenvertrouwen[t] = -19.6621 + 0.334292econ_situatie_12m[t] + 0.129269cons_prijzen_12m[t] -0.118926vooruitz_cpi_12m[t] + 0.220625gunstig_bel_aankopen[t] + 0.0140224vooruitz_aankopen[t] -0.562905verloop_fin_12m[t] + 0.656171fin_sit_gezinnen[t] + 0.0539707gunstig_sparen[t] + e[t]


Multiple Linear Regression - Ordinary Least Squares
VariableParameterS.D.T-STATH0: parameter = 02-tail p-value1-tail p-value
(Intercept)-19.66 4.282-4.5910e+00 1.168e-05 5.838e-06
econ_situatie_12m+0.3343 0.02309+1.4480e+01 2.539e-27 1.269e-27
cons_prijzen_12m+0.1293 0.02222+5.8190e+00 5.829e-08 2.915e-08
vooruitz_cpi_12m-0.1189 0.03083-3.8580e+00 0.0001922 9.611e-05
gunstig_bel_aankopen+0.2206 0.034+6.4890e+00 2.501e-09 1.251e-09
vooruitz_aankopen+0.01402 0.07827+1.7910e-01 0.8581 0.4291
verloop_fin_12m-0.5629 0.1331-4.2310e+00 4.816e-05 2.408e-05
fin_sit_gezinnen+0.6562 0.1671+3.9260e+00 0.0001501 7.506e-05
gunstig_sparen+0.05397 0.03867+1.3960e+00 0.1656 0.08282

\begin{tabular}{lllllllll}
\hline
Multiple Linear Regression - Ordinary Least Squares \tabularnewline
Variable & Parameter & S.D. & T-STATH0: parameter = 0 & 2-tail p-value & 1-tail p-value \tabularnewline
(Intercept) & -19.66 &  4.282 & -4.5910e+00 &  1.168e-05 &  5.838e-06 \tabularnewline
econ_situatie_12m & +0.3343 &  0.02309 & +1.4480e+01 &  2.539e-27 &  1.269e-27 \tabularnewline
cons_prijzen_12m & +0.1293 &  0.02222 & +5.8190e+00 &  5.829e-08 &  2.915e-08 \tabularnewline
vooruitz_cpi_12m & -0.1189 &  0.03083 & -3.8580e+00 &  0.0001922 &  9.611e-05 \tabularnewline
gunstig_bel_aankopen & +0.2206 &  0.034 & +6.4890e+00 &  2.501e-09 &  1.251e-09 \tabularnewline
vooruitz_aankopen & +0.01402 &  0.07827 & +1.7910e-01 &  0.8581 &  0.4291 \tabularnewline
verloop_fin_12m & -0.5629 &  0.1331 & -4.2310e+00 &  4.816e-05 &  2.408e-05 \tabularnewline
fin_sit_gezinnen & +0.6562 &  0.1671 & +3.9260e+00 &  0.0001501 &  7.506e-05 \tabularnewline
gunstig_sparen & +0.05397 &  0.03867 & +1.3960e+00 &  0.1656 &  0.08282 \tabularnewline
\hline
\end{tabular}
%Source: https://freestatistics.org/blog/index.php?pk=285198&T=2

[TABLE]
[ROW][C]Multiple Linear Regression - Ordinary Least Squares[/C][/ROW]
[ROW][C]Variable[/C][C]Parameter[/C][C]S.D.[/C][C]T-STATH0: parameter = 0[/C][C]2-tail p-value[/C][C]1-tail p-value[/C][/ROW]
[ROW][C](Intercept)[/C][C]-19.66[/C][C] 4.282[/C][C]-4.5910e+00[/C][C] 1.168e-05[/C][C] 5.838e-06[/C][/ROW]
[ROW][C]econ_situatie_12m[/C][C]+0.3343[/C][C] 0.02309[/C][C]+1.4480e+01[/C][C] 2.539e-27[/C][C] 1.269e-27[/C][/ROW]
[ROW][C]cons_prijzen_12m[/C][C]+0.1293[/C][C] 0.02222[/C][C]+5.8190e+00[/C][C] 5.829e-08[/C][C] 2.915e-08[/C][/ROW]
[ROW][C]vooruitz_cpi_12m[/C][C]-0.1189[/C][C] 0.03083[/C][C]-3.8580e+00[/C][C] 0.0001922[/C][C] 9.611e-05[/C][/ROW]
[ROW][C]gunstig_bel_aankopen[/C][C]+0.2206[/C][C] 0.034[/C][C]+6.4890e+00[/C][C] 2.501e-09[/C][C] 1.251e-09[/C][/ROW]
[ROW][C]vooruitz_aankopen[/C][C]+0.01402[/C][C] 0.07827[/C][C]+1.7910e-01[/C][C] 0.8581[/C][C] 0.4291[/C][/ROW]
[ROW][C]verloop_fin_12m[/C][C]-0.5629[/C][C] 0.1331[/C][C]-4.2310e+00[/C][C] 4.816e-05[/C][C] 2.408e-05[/C][/ROW]
[ROW][C]fin_sit_gezinnen[/C][C]+0.6562[/C][C] 0.1671[/C][C]+3.9260e+00[/C][C] 0.0001501[/C][C] 7.506e-05[/C][/ROW]
[ROW][C]gunstig_sparen[/C][C]+0.05397[/C][C] 0.03867[/C][C]+1.3960e+00[/C][C] 0.1656[/C][C] 0.08282[/C][/ROW]
[/TABLE]
Source: https://freestatistics.org/blog/index.php?pk=285198&T=2

Globally Unique Identifier (entire table): ba.freestatistics.org/blog/index.php?pk=285198&T=2

As an alternative you can also use a QR Code:  

The GUIDs for individual cells are displayed in the table below:

Multiple Linear Regression - Ordinary Least Squares
VariableParameterS.D.T-STATH0: parameter = 02-tail p-value1-tail p-value
(Intercept)-19.66 4.282-4.5910e+00 1.168e-05 5.838e-06
econ_situatie_12m+0.3343 0.02309+1.4480e+01 2.539e-27 1.269e-27
cons_prijzen_12m+0.1293 0.02222+5.8190e+00 5.829e-08 2.915e-08
vooruitz_cpi_12m-0.1189 0.03083-3.8580e+00 0.0001922 9.611e-05
gunstig_bel_aankopen+0.2206 0.034+6.4890e+00 2.501e-09 1.251e-09
vooruitz_aankopen+0.01402 0.07827+1.7910e-01 0.8581 0.4291
verloop_fin_12m-0.5629 0.1331-4.2310e+00 4.816e-05 2.408e-05
fin_sit_gezinnen+0.6562 0.1671+3.9260e+00 0.0001501 7.506e-05
gunstig_sparen+0.05397 0.03867+1.3960e+00 0.1656 0.08282


Multiple Linear Regression - Regression Statistics
Multiple R 0.9413
R-squared 0.8861
Adjusted R-squared 0.8779
F-TEST (value) 107.9
F-TEST (DF numerator)8
F-TEST (DF denominator)111
p-value 0
Multiple Linear Regression - Residual Statistics
Residual Standard Deviation 2.446
Sum Squared Residuals 664.2

\begin{tabular}{lllllllll}
\hline
Multiple Linear Regression - Regression Statistics \tabularnewline
Multiple R &  0.9413 \tabularnewline
R-squared &  0.8861 \tabularnewline
Adjusted R-squared &  0.8779 \tabularnewline
F-TEST (value) &  107.9 \tabularnewline
F-TEST (DF numerator) & 8 \tabularnewline
F-TEST (DF denominator) & 111 \tabularnewline
p-value &  0 \tabularnewline
Multiple Linear Regression - Residual Statistics \tabularnewline
Residual Standard Deviation &  2.446 \tabularnewline
Sum Squared Residuals &  664.2 \tabularnewline
\hline
\end{tabular}
%Source: https://freestatistics.org/blog/index.php?pk=285198&T=3

[TABLE]
[ROW][C]Multiple Linear Regression - Regression Statistics[/C][/ROW]
[ROW][C]Multiple R[/C][C] 0.9413[/C][/ROW]
[ROW][C]R-squared[/C][C] 0.8861[/C][/ROW]
[ROW][C]Adjusted R-squared[/C][C] 0.8779[/C][/ROW]
[ROW][C]F-TEST (value)[/C][C] 107.9[/C][/ROW]
[ROW][C]F-TEST (DF numerator)[/C][C]8[/C][/ROW]
[ROW][C]F-TEST (DF denominator)[/C][C]111[/C][/ROW]
[ROW][C]p-value[/C][C] 0[/C][/ROW]
[ROW][C]Multiple Linear Regression - Residual Statistics[/C][/ROW]
[ROW][C]Residual Standard Deviation[/C][C] 2.446[/C][/ROW]
[ROW][C]Sum Squared Residuals[/C][C] 664.2[/C][/ROW]
[/TABLE]
Source: https://freestatistics.org/blog/index.php?pk=285198&T=3

Globally Unique Identifier (entire table): ba.freestatistics.org/blog/index.php?pk=285198&T=3

As an alternative you can also use a QR Code:  

The GUIDs for individual cells are displayed in the table below:

Multiple Linear Regression - Regression Statistics
Multiple R 0.9413
R-squared 0.8861
Adjusted R-squared 0.8779
F-TEST (value) 107.9
F-TEST (DF numerator)8
F-TEST (DF denominator)111
p-value 0
Multiple Linear Regression - Residual Statistics
Residual Standard Deviation 2.446
Sum Squared Residuals 664.2


Multiple Linear Regression - Actuals, Interpolation, and Residuals
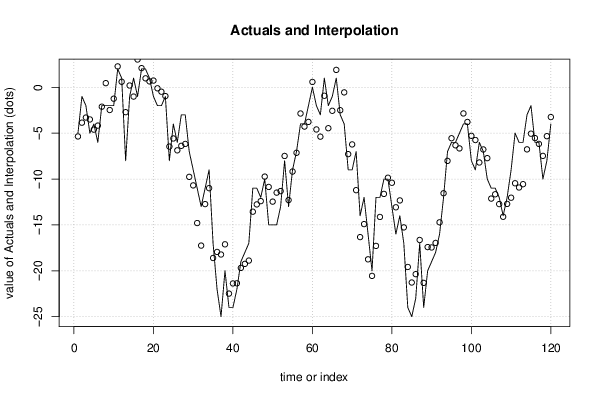
Time or IndexActualsInterpolationForecastResidualsPrediction Error
1-5-5.359 0.359
2-1-3.857 2.857
3-2-3.298 1.298
4-5-3.505-1.495
5-4-4.611 0.6109
6-6-4.175-1.825
7-2-2.116 0.1158
8-2 0.4532-2.453
9-2-2.477 0.4769
10-2-1.245-0.7549
11 2 2.278-0.2778
12 1 0.6044 0.3956
13-8-2.713-5.287
14-1 0.1962-1.196
15 1-1.013 2.013
16-1 3.031-4.031
17 2 2.09-0.08968
18 2 0.9789 1.021
19 1 0.6485 0.3515
20-1 0.7328-1.733
21-2-0.1075-1.892
22-2-0.482-1.518
23-1-0.9607-0.03931
24-8-6.459-1.541
25-4-5.576 1.576
26-6-6.87 0.8699
27-3-6.382 3.382
28-3-6.175 3.175
29-7-9.76 2.76
30-9-10.69 1.693
31-11-14.8 3.796
32-13-17.26 4.255
33-11-12.73 1.732
34-9-10.99 1.994
35-17-18.61 1.607
36-22-17.95-4.053
37-25-18.23-6.772
38-20-17.11-2.887
39-24-22.49-1.512
40-24-21.38-2.621
41-22-21.36-0.6363
42-19-19.69 0.6879
43-18-19.25 1.248
44-17-18.89 1.89
45-11-13.56 2.562
46-11-12.77 1.767
47-12-12.41 0.4069
48-10-9.734-0.2662
49-15-10.86-4.138
50-15-12.46-2.539
51-15-11.48-3.518
52-13-11.31-1.69
53-8-7.483-0.5168
54-13-12.29-0.7087
55-9-9.182 0.1821
56-7-7.14 0.1397
57-4-2.857-1.143
58-4-4.279 0.2792
59-2-3.772 1.772
60 0 0.5872-0.5872
61-2-4.595 2.595
62-3-5.381 2.381
63 1-0.9229 1.923
64-2-4.459 2.459
65-1-2.562 1.562
66 1 1.897-0.8969
67-3-2.497-0.5028
68-4-0.5551-3.445
69-9-7.284-1.716
70-9-6.225-2.775
71-7-11.22 4.215
72-14-16.33 2.328
73-12-14.91 2.911
74-16-18.75 2.751
75-20-20.56 0.5592
76-12-17.29 5.29
77-12-14.13 2.135
78-10-11.62 1.622
79-10-9.86-0.1404
80-13-10.41-2.593
81-16-13.08-2.923
82-14-12.33-1.669
83-17-15.27-1.728
84-24-19.59-4.414
85-25-21.28-3.722
86-23-20.37-2.632
87-17-16.64-0.3588
88-24-21.32-2.684
89-20-17.42-2.583
90-19-17.46-1.543
91-18-16.96-1.036
92-16-14.72-1.284
93-12-11.55-0.4514
94-7-8.021 1.021
95-6-5.553-0.4465
96-6-6.32 0.3201
97-5-6.662 1.662
98-4-2.851-1.149
99-4-3.779-0.2208
100-8-5.29-2.71
101-9-5.747-3.253
102-6-8.194 2.194
103-7-6.777-0.2234
104-10-7.723-2.277
105-11-12.13 1.131
106-11-11.66 0.6582
107-12-12.73 0.7285
108-14-14.12 0.1153
109-12-12.71 0.7117
110-9-12.04 3.036
111-5-10.46 5.46
112-6-10.92 4.921
113-6-10.56 4.559
114-3-6.764 3.764
115-2-5.055 3.055
116-6-5.535-0.4653
117-6-6.172 0.1722
118-10-7.478-2.522
119-8-5.327-2.673
120-4-3.244-0.7559

\begin{tabular}{lllllllll}
\hline
Multiple Linear Regression - Actuals, Interpolation, and Residuals \tabularnewline
Time or Index & Actuals & InterpolationForecast & ResidualsPrediction Error \tabularnewline
1 & -5 & -5.359 &  0.359 \tabularnewline
2 & -1 & -3.857 &  2.857 \tabularnewline
3 & -2 & -3.298 &  1.298 \tabularnewline
4 & -5 & -3.505 & -1.495 \tabularnewline
5 & -4 & -4.611 &  0.6109 \tabularnewline
6 & -6 & -4.175 & -1.825 \tabularnewline
7 & -2 & -2.116 &  0.1158 \tabularnewline
8 & -2 &  0.4532 & -2.453 \tabularnewline
9 & -2 & -2.477 &  0.4769 \tabularnewline
10 & -2 & -1.245 & -0.7549 \tabularnewline
11 &  2 &  2.278 & -0.2778 \tabularnewline
12 &  1 &  0.6044 &  0.3956 \tabularnewline
13 & -8 & -2.713 & -5.287 \tabularnewline
14 & -1 &  0.1962 & -1.196 \tabularnewline
15 &  1 & -1.013 &  2.013 \tabularnewline
16 & -1 &  3.031 & -4.031 \tabularnewline
17 &  2 &  2.09 & -0.08968 \tabularnewline
18 &  2 &  0.9789 &  1.021 \tabularnewline
19 &  1 &  0.6485 &  0.3515 \tabularnewline
20 & -1 &  0.7328 & -1.733 \tabularnewline
21 & -2 & -0.1075 & -1.892 \tabularnewline
22 & -2 & -0.482 & -1.518 \tabularnewline
23 & -1 & -0.9607 & -0.03931 \tabularnewline
24 & -8 & -6.459 & -1.541 \tabularnewline
25 & -4 & -5.576 &  1.576 \tabularnewline
26 & -6 & -6.87 &  0.8699 \tabularnewline
27 & -3 & -6.382 &  3.382 \tabularnewline
28 & -3 & -6.175 &  3.175 \tabularnewline
29 & -7 & -9.76 &  2.76 \tabularnewline
30 & -9 & -10.69 &  1.693 \tabularnewline
31 & -11 & -14.8 &  3.796 \tabularnewline
32 & -13 & -17.26 &  4.255 \tabularnewline
33 & -11 & -12.73 &  1.732 \tabularnewline
34 & -9 & -10.99 &  1.994 \tabularnewline
35 & -17 & -18.61 &  1.607 \tabularnewline
36 & -22 & -17.95 & -4.053 \tabularnewline
37 & -25 & -18.23 & -6.772 \tabularnewline
38 & -20 & -17.11 & -2.887 \tabularnewline
39 & -24 & -22.49 & -1.512 \tabularnewline
40 & -24 & -21.38 & -2.621 \tabularnewline
41 & -22 & -21.36 & -0.6363 \tabularnewline
42 & -19 & -19.69 &  0.6879 \tabularnewline
43 & -18 & -19.25 &  1.248 \tabularnewline
44 & -17 & -18.89 &  1.89 \tabularnewline
45 & -11 & -13.56 &  2.562 \tabularnewline
46 & -11 & -12.77 &  1.767 \tabularnewline
47 & -12 & -12.41 &  0.4069 \tabularnewline
48 & -10 & -9.734 & -0.2662 \tabularnewline
49 & -15 & -10.86 & -4.138 \tabularnewline
50 & -15 & -12.46 & -2.539 \tabularnewline
51 & -15 & -11.48 & -3.518 \tabularnewline
52 & -13 & -11.31 & -1.69 \tabularnewline
53 & -8 & -7.483 & -0.5168 \tabularnewline
54 & -13 & -12.29 & -0.7087 \tabularnewline
55 & -9 & -9.182 &  0.1821 \tabularnewline
56 & -7 & -7.14 &  0.1397 \tabularnewline
57 & -4 & -2.857 & -1.143 \tabularnewline
58 & -4 & -4.279 &  0.2792 \tabularnewline
59 & -2 & -3.772 &  1.772 \tabularnewline
60 &  0 &  0.5872 & -0.5872 \tabularnewline
61 & -2 & -4.595 &  2.595 \tabularnewline
62 & -3 & -5.381 &  2.381 \tabularnewline
63 &  1 & -0.9229 &  1.923 \tabularnewline
64 & -2 & -4.459 &  2.459 \tabularnewline
65 & -1 & -2.562 &  1.562 \tabularnewline
66 &  1 &  1.897 & -0.8969 \tabularnewline
67 & -3 & -2.497 & -0.5028 \tabularnewline
68 & -4 & -0.5551 & -3.445 \tabularnewline
69 & -9 & -7.284 & -1.716 \tabularnewline
70 & -9 & -6.225 & -2.775 \tabularnewline
71 & -7 & -11.22 &  4.215 \tabularnewline
72 & -14 & -16.33 &  2.328 \tabularnewline
73 & -12 & -14.91 &  2.911 \tabularnewline
74 & -16 & -18.75 &  2.751 \tabularnewline
75 & -20 & -20.56 &  0.5592 \tabularnewline
76 & -12 & -17.29 &  5.29 \tabularnewline
77 & -12 & -14.13 &  2.135 \tabularnewline
78 & -10 & -11.62 &  1.622 \tabularnewline
79 & -10 & -9.86 & -0.1404 \tabularnewline
80 & -13 & -10.41 & -2.593 \tabularnewline
81 & -16 & -13.08 & -2.923 \tabularnewline
82 & -14 & -12.33 & -1.669 \tabularnewline
83 & -17 & -15.27 & -1.728 \tabularnewline
84 & -24 & -19.59 & -4.414 \tabularnewline
85 & -25 & -21.28 & -3.722 \tabularnewline
86 & -23 & -20.37 & -2.632 \tabularnewline
87 & -17 & -16.64 & -0.3588 \tabularnewline
88 & -24 & -21.32 & -2.684 \tabularnewline
89 & -20 & -17.42 & -2.583 \tabularnewline
90 & -19 & -17.46 & -1.543 \tabularnewline
91 & -18 & -16.96 & -1.036 \tabularnewline
92 & -16 & -14.72 & -1.284 \tabularnewline
93 & -12 & -11.55 & -0.4514 \tabularnewline
94 & -7 & -8.021 &  1.021 \tabularnewline
95 & -6 & -5.553 & -0.4465 \tabularnewline
96 & -6 & -6.32 &  0.3201 \tabularnewline
97 & -5 & -6.662 &  1.662 \tabularnewline
98 & -4 & -2.851 & -1.149 \tabularnewline
99 & -4 & -3.779 & -0.2208 \tabularnewline
100 & -8 & -5.29 & -2.71 \tabularnewline
101 & -9 & -5.747 & -3.253 \tabularnewline
102 & -6 & -8.194 &  2.194 \tabularnewline
103 & -7 & -6.777 & -0.2234 \tabularnewline
104 & -10 & -7.723 & -2.277 \tabularnewline
105 & -11 & -12.13 &  1.131 \tabularnewline
106 & -11 & -11.66 &  0.6582 \tabularnewline
107 & -12 & -12.73 &  0.7285 \tabularnewline
108 & -14 & -14.12 &  0.1153 \tabularnewline
109 & -12 & -12.71 &  0.7117 \tabularnewline
110 & -9 & -12.04 &  3.036 \tabularnewline
111 & -5 & -10.46 &  5.46 \tabularnewline
112 & -6 & -10.92 &  4.921 \tabularnewline
113 & -6 & -10.56 &  4.559 \tabularnewline
114 & -3 & -6.764 &  3.764 \tabularnewline
115 & -2 & -5.055 &  3.055 \tabularnewline
116 & -6 & -5.535 & -0.4653 \tabularnewline
117 & -6 & -6.172 &  0.1722 \tabularnewline
118 & -10 & -7.478 & -2.522 \tabularnewline
119 & -8 & -5.327 & -2.673 \tabularnewline
120 & -4 & -3.244 & -0.7559 \tabularnewline
\hline
\end{tabular}
%Source: https://freestatistics.org/blog/index.php?pk=285198&T=4

[TABLE]
[ROW][C]Multiple Linear Regression - Actuals, Interpolation, and Residuals[/C][/ROW]
[ROW][C]Time or Index[/C][C]Actuals[/C][C]InterpolationForecast[/C][C]ResidualsPrediction Error[/C][/ROW]
[ROW][C]1[/C][C]-5[/C][C]-5.359[/C][C] 0.359[/C][/ROW]
[ROW][C]2[/C][C]-1[/C][C]-3.857[/C][C] 2.857[/C][/ROW]
[ROW][C]3[/C][C]-2[/C][C]-3.298[/C][C] 1.298[/C][/ROW]
[ROW][C]4[/C][C]-5[/C][C]-3.505[/C][C]-1.495[/C][/ROW]
[ROW][C]5[/C][C]-4[/C][C]-4.611[/C][C] 0.6109[/C][/ROW]
[ROW][C]6[/C][C]-6[/C][C]-4.175[/C][C]-1.825[/C][/ROW]
[ROW][C]7[/C][C]-2[/C][C]-2.116[/C][C] 0.1158[/C][/ROW]
[ROW][C]8[/C][C]-2[/C][C] 0.4532[/C][C]-2.453[/C][/ROW]
[ROW][C]9[/C][C]-2[/C][C]-2.477[/C][C] 0.4769[/C][/ROW]
[ROW][C]10[/C][C]-2[/C][C]-1.245[/C][C]-0.7549[/C][/ROW]
[ROW][C]11[/C][C] 2[/C][C] 2.278[/C][C]-0.2778[/C][/ROW]
[ROW][C]12[/C][C] 1[/C][C] 0.6044[/C][C] 0.3956[/C][/ROW]
[ROW][C]13[/C][C]-8[/C][C]-2.713[/C][C]-5.287[/C][/ROW]
[ROW][C]14[/C][C]-1[/C][C] 0.1962[/C][C]-1.196[/C][/ROW]
[ROW][C]15[/C][C] 1[/C][C]-1.013[/C][C] 2.013[/C][/ROW]
[ROW][C]16[/C][C]-1[/C][C] 3.031[/C][C]-4.031[/C][/ROW]
[ROW][C]17[/C][C] 2[/C][C] 2.09[/C][C]-0.08968[/C][/ROW]
[ROW][C]18[/C][C] 2[/C][C] 0.9789[/C][C] 1.021[/C][/ROW]
[ROW][C]19[/C][C] 1[/C][C] 0.6485[/C][C] 0.3515[/C][/ROW]
[ROW][C]20[/C][C]-1[/C][C] 0.7328[/C][C]-1.733[/C][/ROW]
[ROW][C]21[/C][C]-2[/C][C]-0.1075[/C][C]-1.892[/C][/ROW]
[ROW][C]22[/C][C]-2[/C][C]-0.482[/C][C]-1.518[/C][/ROW]
[ROW][C]23[/C][C]-1[/C][C]-0.9607[/C][C]-0.03931[/C][/ROW]
[ROW][C]24[/C][C]-8[/C][C]-6.459[/C][C]-1.541[/C][/ROW]
[ROW][C]25[/C][C]-4[/C][C]-5.576[/C][C] 1.576[/C][/ROW]
[ROW][C]26[/C][C]-6[/C][C]-6.87[/C][C] 0.8699[/C][/ROW]
[ROW][C]27[/C][C]-3[/C][C]-6.382[/C][C] 3.382[/C][/ROW]
[ROW][C]28[/C][C]-3[/C][C]-6.175[/C][C] 3.175[/C][/ROW]
[ROW][C]29[/C][C]-7[/C][C]-9.76[/C][C] 2.76[/C][/ROW]
[ROW][C]30[/C][C]-9[/C][C]-10.69[/C][C] 1.693[/C][/ROW]
[ROW][C]31[/C][C]-11[/C][C]-14.8[/C][C] 3.796[/C][/ROW]
[ROW][C]32[/C][C]-13[/C][C]-17.26[/C][C] 4.255[/C][/ROW]
[ROW][C]33[/C][C]-11[/C][C]-12.73[/C][C] 1.732[/C][/ROW]
[ROW][C]34[/C][C]-9[/C][C]-10.99[/C][C] 1.994[/C][/ROW]
[ROW][C]35[/C][C]-17[/C][C]-18.61[/C][C] 1.607[/C][/ROW]
[ROW][C]36[/C][C]-22[/C][C]-17.95[/C][C]-4.053[/C][/ROW]
[ROW][C]37[/C][C]-25[/C][C]-18.23[/C][C]-6.772[/C][/ROW]
[ROW][C]38[/C][C]-20[/C][C]-17.11[/C][C]-2.887[/C][/ROW]
[ROW][C]39[/C][C]-24[/C][C]-22.49[/C][C]-1.512[/C][/ROW]
[ROW][C]40[/C][C]-24[/C][C]-21.38[/C][C]-2.621[/C][/ROW]
[ROW][C]41[/C][C]-22[/C][C]-21.36[/C][C]-0.6363[/C][/ROW]
[ROW][C]42[/C][C]-19[/C][C]-19.69[/C][C] 0.6879[/C][/ROW]
[ROW][C]43[/C][C]-18[/C][C]-19.25[/C][C] 1.248[/C][/ROW]
[ROW][C]44[/C][C]-17[/C][C]-18.89[/C][C] 1.89[/C][/ROW]
[ROW][C]45[/C][C]-11[/C][C]-13.56[/C][C] 2.562[/C][/ROW]
[ROW][C]46[/C][C]-11[/C][C]-12.77[/C][C] 1.767[/C][/ROW]
[ROW][C]47[/C][C]-12[/C][C]-12.41[/C][C] 0.4069[/C][/ROW]
[ROW][C]48[/C][C]-10[/C][C]-9.734[/C][C]-0.2662[/C][/ROW]
[ROW][C]49[/C][C]-15[/C][C]-10.86[/C][C]-4.138[/C][/ROW]
[ROW][C]50[/C][C]-15[/C][C]-12.46[/C][C]-2.539[/C][/ROW]
[ROW][C]51[/C][C]-15[/C][C]-11.48[/C][C]-3.518[/C][/ROW]
[ROW][C]52[/C][C]-13[/C][C]-11.31[/C][C]-1.69[/C][/ROW]
[ROW][C]53[/C][C]-8[/C][C]-7.483[/C][C]-0.5168[/C][/ROW]
[ROW][C]54[/C][C]-13[/C][C]-12.29[/C][C]-0.7087[/C][/ROW]
[ROW][C]55[/C][C]-9[/C][C]-9.182[/C][C] 0.1821[/C][/ROW]
[ROW][C]56[/C][C]-7[/C][C]-7.14[/C][C] 0.1397[/C][/ROW]
[ROW][C]57[/C][C]-4[/C][C]-2.857[/C][C]-1.143[/C][/ROW]
[ROW][C]58[/C][C]-4[/C][C]-4.279[/C][C] 0.2792[/C][/ROW]
[ROW][C]59[/C][C]-2[/C][C]-3.772[/C][C] 1.772[/C][/ROW]
[ROW][C]60[/C][C] 0[/C][C] 0.5872[/C][C]-0.5872[/C][/ROW]
[ROW][C]61[/C][C]-2[/C][C]-4.595[/C][C] 2.595[/C][/ROW]
[ROW][C]62[/C][C]-3[/C][C]-5.381[/C][C] 2.381[/C][/ROW]
[ROW][C]63[/C][C] 1[/C][C]-0.9229[/C][C] 1.923[/C][/ROW]
[ROW][C]64[/C][C]-2[/C][C]-4.459[/C][C] 2.459[/C][/ROW]
[ROW][C]65[/C][C]-1[/C][C]-2.562[/C][C] 1.562[/C][/ROW]
[ROW][C]66[/C][C] 1[/C][C] 1.897[/C][C]-0.8969[/C][/ROW]
[ROW][C]67[/C][C]-3[/C][C]-2.497[/C][C]-0.5028[/C][/ROW]
[ROW][C]68[/C][C]-4[/C][C]-0.5551[/C][C]-3.445[/C][/ROW]
[ROW][C]69[/C][C]-9[/C][C]-7.284[/C][C]-1.716[/C][/ROW]
[ROW][C]70[/C][C]-9[/C][C]-6.225[/C][C]-2.775[/C][/ROW]
[ROW][C]71[/C][C]-7[/C][C]-11.22[/C][C] 4.215[/C][/ROW]
[ROW][C]72[/C][C]-14[/C][C]-16.33[/C][C] 2.328[/C][/ROW]
[ROW][C]73[/C][C]-12[/C][C]-14.91[/C][C] 2.911[/C][/ROW]
[ROW][C]74[/C][C]-16[/C][C]-18.75[/C][C] 2.751[/C][/ROW]
[ROW][C]75[/C][C]-20[/C][C]-20.56[/C][C] 0.5592[/C][/ROW]
[ROW][C]76[/C][C]-12[/C][C]-17.29[/C][C] 5.29[/C][/ROW]
[ROW][C]77[/C][C]-12[/C][C]-14.13[/C][C] 2.135[/C][/ROW]
[ROW][C]78[/C][C]-10[/C][C]-11.62[/C][C] 1.622[/C][/ROW]
[ROW][C]79[/C][C]-10[/C][C]-9.86[/C][C]-0.1404[/C][/ROW]
[ROW][C]80[/C][C]-13[/C][C]-10.41[/C][C]-2.593[/C][/ROW]
[ROW][C]81[/C][C]-16[/C][C]-13.08[/C][C]-2.923[/C][/ROW]
[ROW][C]82[/C][C]-14[/C][C]-12.33[/C][C]-1.669[/C][/ROW]
[ROW][C]83[/C][C]-17[/C][C]-15.27[/C][C]-1.728[/C][/ROW]
[ROW][C]84[/C][C]-24[/C][C]-19.59[/C][C]-4.414[/C][/ROW]
[ROW][C]85[/C][C]-25[/C][C]-21.28[/C][C]-3.722[/C][/ROW]
[ROW][C]86[/C][C]-23[/C][C]-20.37[/C][C]-2.632[/C][/ROW]
[ROW][C]87[/C][C]-17[/C][C]-16.64[/C][C]-0.3588[/C][/ROW]
[ROW][C]88[/C][C]-24[/C][C]-21.32[/C][C]-2.684[/C][/ROW]
[ROW][C]89[/C][C]-20[/C][C]-17.42[/C][C]-2.583[/C][/ROW]
[ROW][C]90[/C][C]-19[/C][C]-17.46[/C][C]-1.543[/C][/ROW]
[ROW][C]91[/C][C]-18[/C][C]-16.96[/C][C]-1.036[/C][/ROW]
[ROW][C]92[/C][C]-16[/C][C]-14.72[/C][C]-1.284[/C][/ROW]
[ROW][C]93[/C][C]-12[/C][C]-11.55[/C][C]-0.4514[/C][/ROW]
[ROW][C]94[/C][C]-7[/C][C]-8.021[/C][C] 1.021[/C][/ROW]
[ROW][C]95[/C][C]-6[/C][C]-5.553[/C][C]-0.4465[/C][/ROW]
[ROW][C]96[/C][C]-6[/C][C]-6.32[/C][C] 0.3201[/C][/ROW]
[ROW][C]97[/C][C]-5[/C][C]-6.662[/C][C] 1.662[/C][/ROW]
[ROW][C]98[/C][C]-4[/C][C]-2.851[/C][C]-1.149[/C][/ROW]
[ROW][C]99[/C][C]-4[/C][C]-3.779[/C][C]-0.2208[/C][/ROW]
[ROW][C]100[/C][C]-8[/C][C]-5.29[/C][C]-2.71[/C][/ROW]
[ROW][C]101[/C][C]-9[/C][C]-5.747[/C][C]-3.253[/C][/ROW]
[ROW][C]102[/C][C]-6[/C][C]-8.194[/C][C] 2.194[/C][/ROW]
[ROW][C]103[/C][C]-7[/C][C]-6.777[/C][C]-0.2234[/C][/ROW]
[ROW][C]104[/C][C]-10[/C][C]-7.723[/C][C]-2.277[/C][/ROW]
[ROW][C]105[/C][C]-11[/C][C]-12.13[/C][C] 1.131[/C][/ROW]
[ROW][C]106[/C][C]-11[/C][C]-11.66[/C][C] 0.6582[/C][/ROW]
[ROW][C]107[/C][C]-12[/C][C]-12.73[/C][C] 0.7285[/C][/ROW]
[ROW][C]108[/C][C]-14[/C][C]-14.12[/C][C] 0.1153[/C][/ROW]
[ROW][C]109[/C][C]-12[/C][C]-12.71[/C][C] 0.7117[/C][/ROW]
[ROW][C]110[/C][C]-9[/C][C]-12.04[/C][C] 3.036[/C][/ROW]
[ROW][C]111[/C][C]-5[/C][C]-10.46[/C][C] 5.46[/C][/ROW]
[ROW][C]112[/C][C]-6[/C][C]-10.92[/C][C] 4.921[/C][/ROW]
[ROW][C]113[/C][C]-6[/C][C]-10.56[/C][C] 4.559[/C][/ROW]
[ROW][C]114[/C][C]-3[/C][C]-6.764[/C][C] 3.764[/C][/ROW]
[ROW][C]115[/C][C]-2[/C][C]-5.055[/C][C] 3.055[/C][/ROW]
[ROW][C]116[/C][C]-6[/C][C]-5.535[/C][C]-0.4653[/C][/ROW]
[ROW][C]117[/C][C]-6[/C][C]-6.172[/C][C] 0.1722[/C][/ROW]
[ROW][C]118[/C][C]-10[/C][C]-7.478[/C][C]-2.522[/C][/ROW]
[ROW][C]119[/C][C]-8[/C][C]-5.327[/C][C]-2.673[/C][/ROW]
[ROW][C]120[/C][C]-4[/C][C]-3.244[/C][C]-0.7559[/C][/ROW]
[/TABLE]
Source: https://freestatistics.org/blog/index.php?pk=285198&T=4

Globally Unique Identifier (entire table): ba.freestatistics.org/blog/index.php?pk=285198&T=4

As an alternative you can also use a QR Code:  

The GUIDs for individual cells are displayed in the table below:

Multiple Linear Regression - Actuals, Interpolation, and Residuals
Time or IndexActualsInterpolationForecastResidualsPrediction Error
1-5-5.359 0.359
2-1-3.857 2.857
3-2-3.298 1.298
4-5-3.505-1.495
5-4-4.611 0.6109
6-6-4.175-1.825
7-2-2.116 0.1158
8-2 0.4532-2.453
9-2-2.477 0.4769
10-2-1.245-0.7549
11 2 2.278-0.2778
12 1 0.6044 0.3956
13-8-2.713-5.287
14-1 0.1962-1.196
15 1-1.013 2.013
16-1 3.031-4.031
17 2 2.09-0.08968
18 2 0.9789 1.021
19 1 0.6485 0.3515
20-1 0.7328-1.733
21-2-0.1075-1.892
22-2-0.482-1.518
23-1-0.9607-0.03931
24-8-6.459-1.541
25-4-5.576 1.576
26-6-6.87 0.8699
27-3-6.382 3.382
28-3-6.175 3.175
29-7-9.76 2.76
30-9-10.69 1.693
31-11-14.8 3.796
32-13-17.26 4.255
33-11-12.73 1.732
34-9-10.99 1.994
35-17-18.61 1.607
36-22-17.95-4.053
37-25-18.23-6.772
38-20-17.11-2.887
39-24-22.49-1.512
40-24-21.38-2.621
41-22-21.36-0.6363
42-19-19.69 0.6879
43-18-19.25 1.248
44-17-18.89 1.89
45-11-13.56 2.562
46-11-12.77 1.767
47-12-12.41 0.4069
48-10-9.734-0.2662
49-15-10.86-4.138
50-15-12.46-2.539
51-15-11.48-3.518
52-13-11.31-1.69
53-8-7.483-0.5168
54-13-12.29-0.7087
55-9-9.182 0.1821
56-7-7.14 0.1397
57-4-2.857-1.143
58-4-4.279 0.2792
59-2-3.772 1.772
60 0 0.5872-0.5872
61-2-4.595 2.595
62-3-5.381 2.381
63 1-0.9229 1.923
64-2-4.459 2.459
65-1-2.562 1.562
66 1 1.897-0.8969
67-3-2.497-0.5028
68-4-0.5551-3.445
69-9-7.284-1.716
70-9-6.225-2.775
71-7-11.22 4.215
72-14-16.33 2.328
73-12-14.91 2.911
74-16-18.75 2.751
75-20-20.56 0.5592
76-12-17.29 5.29
77-12-14.13 2.135
78-10-11.62 1.622
79-10-9.86-0.1404
80-13-10.41-2.593
81-16-13.08-2.923
82-14-12.33-1.669
83-17-15.27-1.728
84-24-19.59-4.414
85-25-21.28-3.722
86-23-20.37-2.632
87-17-16.64-0.3588
88-24-21.32-2.684
89-20-17.42-2.583
90-19-17.46-1.543
91-18-16.96-1.036
92-16-14.72-1.284
93-12-11.55-0.4514
94-7-8.021 1.021
95-6-5.553-0.4465
96-6-6.32 0.3201
97-5-6.662 1.662
98-4-2.851-1.149
99-4-3.779-0.2208
100-8-5.29-2.71
101-9-5.747-3.253
102-6-8.194 2.194
103-7-6.777-0.2234
104-10-7.723-2.277
105-11-12.13 1.131
106-11-11.66 0.6582
107-12-12.73 0.7285
108-14-14.12 0.1153
109-12-12.71 0.7117
110-9-12.04 3.036
111-5-10.46 5.46
112-6-10.92 4.921
113-6-10.56 4.559
114-3-6.764 3.764
115-2-5.055 3.055
116-6-5.535-0.4653
117-6-6.172 0.1722
118-10-7.478-2.522
119-8-5.327-2.673
120-4-3.244-0.7559


Goldfeld-Quandt test for Heteroskedasticity
p-valuesAlternative Hypothesis
breakpoint indexgreater2-sidedless
12 0.1459 0.2918 0.8541
13 0.08499 0.17 0.915
14 0.2236 0.4473 0.7764
15 0.3599 0.7199 0.6401
16 0.4796 0.9592 0.5204
17 0.3778 0.7557 0.6222
18 0.3054 0.6107 0.6946
19 0.2666 0.5332 0.7334
20 0.1983 0.3966 0.8017
21 0.1758 0.3515 0.8242
22 0.1612 0.3223 0.8388
23 0.1305 0.2609 0.8695
24 0.106 0.212 0.894
25 0.07304 0.1461 0.927
26 0.04837 0.09674 0.9516
27 0.03478 0.06956 0.9652
28 0.03158 0.06317 0.9684
29 0.03386 0.06772 0.9661
30 0.04322 0.08644 0.9568
31 0.03682 0.07365 0.9632
32 0.03539 0.07078 0.9646
33 0.04979 0.09958 0.9502
34 0.04463 0.08927 0.9554
35 0.07514 0.1503 0.9249
36 0.2735 0.547 0.7265
37 0.5934 0.8132 0.4066
38 0.5477 0.9046 0.4523
39 0.5255 0.949 0.4745
40 0.4836 0.9672 0.5164
41 0.4535 0.907 0.5465
42 0.5068 0.9863 0.4932
43 0.5214 0.9571 0.4786
44 0.5829 0.8342 0.4171
45 0.6464 0.7071 0.3536
46 0.6261 0.7478 0.3739
47 0.5746 0.8507 0.4254
48 0.5234 0.9532 0.4766
49 0.626 0.748 0.374
50 0.6694 0.6612 0.3306
51 0.7621 0.4758 0.2379
52 0.8217 0.3567 0.1783
53 0.8038 0.3924 0.1962
54 0.7927 0.4146 0.2073
55 0.7855 0.4291 0.2145
56 0.7671 0.4659 0.2329
57 0.747 0.506 0.253
58 0.7081 0.5838 0.2919
59 0.6771 0.6457 0.3229
60 0.6303 0.7394 0.3697
61 0.6181 0.7638 0.3819
62 0.5969 0.8062 0.4031
63 0.5668 0.8663 0.4332
64 0.6434 0.7132 0.3566
65 0.6496 0.7008 0.3504
66 0.6054 0.7891 0.3946
67 0.5784 0.8432 0.4216
68 0.6169 0.7663 0.3831
69 0.6002 0.7997 0.3998
70 0.658 0.684 0.342
71 0.6832 0.6336 0.3168
72 0.642 0.7161 0.358
73 0.6146 0.7707 0.3854
74 0.737 0.5261 0.263
75 0.7011 0.5978 0.2989
76 0.9069 0.1861 0.09307
77 0.9317 0.1367 0.06835
78 0.9585 0.08295 0.04148
79 0.9497 0.1007 0.05033
80 0.9473 0.1054 0.05269
81 0.9454 0.1092 0.05459
82 0.9357 0.1286 0.06432
83 0.9392 0.1215 0.06076
84 0.9464 0.1071 0.05356
85 0.9408 0.1183 0.05917
86 0.9228 0.1544 0.0772
87 0.9179 0.1643 0.08214
88 0.9044 0.1913 0.09563
89 0.8738 0.2525 0.1262
90 0.8333 0.3335 0.1667
91 0.7838 0.4324 0.2162
92 0.7273 0.5454 0.2727
93 0.7371 0.5258 0.2629
94 0.7091 0.5817 0.2909
95 0.6386 0.7229 0.3614
96 0.5912 0.8177 0.4088
97 0.7972 0.4055 0.2028
98 0.7307 0.5387 0.2693
99 0.6756 0.6488 0.3244
100 0.6593 0.6814 0.3407
101 0.8265 0.3471 0.1735
102 0.8023 0.3954 0.1977
103 0.7551 0.4898 0.2449
104 0.6597 0.6805 0.3403
105 0.8429 0.3143 0.1571
106 0.7469 0.5062 0.2531
107 0.6144 0.7711 0.3856
108 0.4459 0.8917 0.5541

\begin{tabular}{lllllllll}
\hline
Goldfeld-Quandt test for Heteroskedasticity \tabularnewline
p-values & Alternative Hypothesis \tabularnewline
breakpoint index & greater & 2-sided & less \tabularnewline
12 &  0.1459 &  0.2918 &  0.8541 \tabularnewline
13 &  0.08499 &  0.17 &  0.915 \tabularnewline
14 &  0.2236 &  0.4473 &  0.7764 \tabularnewline
15 &  0.3599 &  0.7199 &  0.6401 \tabularnewline
16 &  0.4796 &  0.9592 &  0.5204 \tabularnewline
17 &  0.3778 &  0.7557 &  0.6222 \tabularnewline
18 &  0.3054 &  0.6107 &  0.6946 \tabularnewline
19 &  0.2666 &  0.5332 &  0.7334 \tabularnewline
20 &  0.1983 &  0.3966 &  0.8017 \tabularnewline
21 &  0.1758 &  0.3515 &  0.8242 \tabularnewline
22 &  0.1612 &  0.3223 &  0.8388 \tabularnewline
23 &  0.1305 &  0.2609 &  0.8695 \tabularnewline
24 &  0.106 &  0.212 &  0.894 \tabularnewline
25 &  0.07304 &  0.1461 &  0.927 \tabularnewline
26 &  0.04837 &  0.09674 &  0.9516 \tabularnewline
27 &  0.03478 &  0.06956 &  0.9652 \tabularnewline
28 &  0.03158 &  0.06317 &  0.9684 \tabularnewline
29 &  0.03386 &  0.06772 &  0.9661 \tabularnewline
30 &  0.04322 &  0.08644 &  0.9568 \tabularnewline
31 &  0.03682 &  0.07365 &  0.9632 \tabularnewline
32 &  0.03539 &  0.07078 &  0.9646 \tabularnewline
33 &  0.04979 &  0.09958 &  0.9502 \tabularnewline
34 &  0.04463 &  0.08927 &  0.9554 \tabularnewline
35 &  0.07514 &  0.1503 &  0.9249 \tabularnewline
36 &  0.2735 &  0.547 &  0.7265 \tabularnewline
37 &  0.5934 &  0.8132 &  0.4066 \tabularnewline
38 &  0.5477 &  0.9046 &  0.4523 \tabularnewline
39 &  0.5255 &  0.949 &  0.4745 \tabularnewline
40 &  0.4836 &  0.9672 &  0.5164 \tabularnewline
41 &  0.4535 &  0.907 &  0.5465 \tabularnewline
42 &  0.5068 &  0.9863 &  0.4932 \tabularnewline
43 &  0.5214 &  0.9571 &  0.4786 \tabularnewline
44 &  0.5829 &  0.8342 &  0.4171 \tabularnewline
45 &  0.6464 &  0.7071 &  0.3536 \tabularnewline
46 &  0.6261 &  0.7478 &  0.3739 \tabularnewline
47 &  0.5746 &  0.8507 &  0.4254 \tabularnewline
48 &  0.5234 &  0.9532 &  0.4766 \tabularnewline
49 &  0.626 &  0.748 &  0.374 \tabularnewline
50 &  0.6694 &  0.6612 &  0.3306 \tabularnewline
51 &  0.7621 &  0.4758 &  0.2379 \tabularnewline
52 &  0.8217 &  0.3567 &  0.1783 \tabularnewline
53 &  0.8038 &  0.3924 &  0.1962 \tabularnewline
54 &  0.7927 &  0.4146 &  0.2073 \tabularnewline
55 &  0.7855 &  0.4291 &  0.2145 \tabularnewline
56 &  0.7671 &  0.4659 &  0.2329 \tabularnewline
57 &  0.747 &  0.506 &  0.253 \tabularnewline
58 &  0.7081 &  0.5838 &  0.2919 \tabularnewline
59 &  0.6771 &  0.6457 &  0.3229 \tabularnewline
60 &  0.6303 &  0.7394 &  0.3697 \tabularnewline
61 &  0.6181 &  0.7638 &  0.3819 \tabularnewline
62 &  0.5969 &  0.8062 &  0.4031 \tabularnewline
63 &  0.5668 &  0.8663 &  0.4332 \tabularnewline
64 &  0.6434 &  0.7132 &  0.3566 \tabularnewline
65 &  0.6496 &  0.7008 &  0.3504 \tabularnewline
66 &  0.6054 &  0.7891 &  0.3946 \tabularnewline
67 &  0.5784 &  0.8432 &  0.4216 \tabularnewline
68 &  0.6169 &  0.7663 &  0.3831 \tabularnewline
69 &  0.6002 &  0.7997 &  0.3998 \tabularnewline
70 &  0.658 &  0.684 &  0.342 \tabularnewline
71 &  0.6832 &  0.6336 &  0.3168 \tabularnewline
72 &  0.642 &  0.7161 &  0.358 \tabularnewline
73 &  0.6146 &  0.7707 &  0.3854 \tabularnewline
74 &  0.737 &  0.5261 &  0.263 \tabularnewline
75 &  0.7011 &  0.5978 &  0.2989 \tabularnewline
76 &  0.9069 &  0.1861 &  0.09307 \tabularnewline
77 &  0.9317 &  0.1367 &  0.06835 \tabularnewline
78 &  0.9585 &  0.08295 &  0.04148 \tabularnewline
79 &  0.9497 &  0.1007 &  0.05033 \tabularnewline
80 &  0.9473 &  0.1054 &  0.05269 \tabularnewline
81 &  0.9454 &  0.1092 &  0.05459 \tabularnewline
82 &  0.9357 &  0.1286 &  0.06432 \tabularnewline
83 &  0.9392 &  0.1215 &  0.06076 \tabularnewline
84 &  0.9464 &  0.1071 &  0.05356 \tabularnewline
85 &  0.9408 &  0.1183 &  0.05917 \tabularnewline
86 &  0.9228 &  0.1544 &  0.0772 \tabularnewline
87 &  0.9179 &  0.1643 &  0.08214 \tabularnewline
88 &  0.9044 &  0.1913 &  0.09563 \tabularnewline
89 &  0.8738 &  0.2525 &  0.1262 \tabularnewline
90 &  0.8333 &  0.3335 &  0.1667 \tabularnewline
91 &  0.7838 &  0.4324 &  0.2162 \tabularnewline
92 &  0.7273 &  0.5454 &  0.2727 \tabularnewline
93 &  0.7371 &  0.5258 &  0.2629 \tabularnewline
94 &  0.7091 &  0.5817 &  0.2909 \tabularnewline
95 &  0.6386 &  0.7229 &  0.3614 \tabularnewline
96 &  0.5912 &  0.8177 &  0.4088 \tabularnewline
97 &  0.7972 &  0.4055 &  0.2028 \tabularnewline
98 &  0.7307 &  0.5387 &  0.2693 \tabularnewline
99 &  0.6756 &  0.6488 &  0.3244 \tabularnewline
100 &  0.6593 &  0.6814 &  0.3407 \tabularnewline
101 &  0.8265 &  0.3471 &  0.1735 \tabularnewline
102 &  0.8023 &  0.3954 &  0.1977 \tabularnewline
103 &  0.7551 &  0.4898 &  0.2449 \tabularnewline
104 &  0.6597 &  0.6805 &  0.3403 \tabularnewline
105 &  0.8429 &  0.3143 &  0.1571 \tabularnewline
106 &  0.7469 &  0.5062 &  0.2531 \tabularnewline
107 &  0.6144 &  0.7711 &  0.3856 \tabularnewline
108 &  0.4459 &  0.8917 &  0.5541 \tabularnewline
\hline
\end{tabular}
%Source: https://freestatistics.org/blog/index.php?pk=285198&T=5

[TABLE]
[ROW][C]Goldfeld-Quandt test for Heteroskedasticity[/C][/ROW]
[ROW][C]p-values[/C][C]Alternative Hypothesis[/C][/ROW]
[ROW][C]breakpoint index[/C][C]greater[/C][C]2-sided[/C][C]less[/C][/ROW]
[ROW][C]12[/C][C] 0.1459[/C][C] 0.2918[/C][C] 0.8541[/C][/ROW]
[ROW][C]13[/C][C] 0.08499[/C][C] 0.17[/C][C] 0.915[/C][/ROW]
[ROW][C]14[/C][C] 0.2236[/C][C] 0.4473[/C][C] 0.7764[/C][/ROW]
[ROW][C]15[/C][C] 0.3599[/C][C] 0.7199[/C][C] 0.6401[/C][/ROW]
[ROW][C]16[/C][C] 0.4796[/C][C] 0.9592[/C][C] 0.5204[/C][/ROW]
[ROW][C]17[/C][C] 0.3778[/C][C] 0.7557[/C][C] 0.6222[/C][/ROW]
[ROW][C]18[/C][C] 0.3054[/C][C] 0.6107[/C][C] 0.6946[/C][/ROW]
[ROW][C]19[/C][C] 0.2666[/C][C] 0.5332[/C][C] 0.7334[/C][/ROW]
[ROW][C]20[/C][C] 0.1983[/C][C] 0.3966[/C][C] 0.8017[/C][/ROW]
[ROW][C]21[/C][C] 0.1758[/C][C] 0.3515[/C][C] 0.8242[/C][/ROW]
[ROW][C]22[/C][C] 0.1612[/C][C] 0.3223[/C][C] 0.8388[/C][/ROW]
[ROW][C]23[/C][C] 0.1305[/C][C] 0.2609[/C][C] 0.8695[/C][/ROW]
[ROW][C]24[/C][C] 0.106[/C][C] 0.212[/C][C] 0.894[/C][/ROW]
[ROW][C]25[/C][C] 0.07304[/C][C] 0.1461[/C][C] 0.927[/C][/ROW]
[ROW][C]26[/C][C] 0.04837[/C][C] 0.09674[/C][C] 0.9516[/C][/ROW]
[ROW][C]27[/C][C] 0.03478[/C][C] 0.06956[/C][C] 0.9652[/C][/ROW]
[ROW][C]28[/C][C] 0.03158[/C][C] 0.06317[/C][C] 0.9684[/C][/ROW]
[ROW][C]29[/C][C] 0.03386[/C][C] 0.06772[/C][C] 0.9661[/C][/ROW]
[ROW][C]30[/C][C] 0.04322[/C][C] 0.08644[/C][C] 0.9568[/C][/ROW]
[ROW][C]31[/C][C] 0.03682[/C][C] 0.07365[/C][C] 0.9632[/C][/ROW]
[ROW][C]32[/C][C] 0.03539[/C][C] 0.07078[/C][C] 0.9646[/C][/ROW]
[ROW][C]33[/C][C] 0.04979[/C][C] 0.09958[/C][C] 0.9502[/C][/ROW]
[ROW][C]34[/C][C] 0.04463[/C][C] 0.08927[/C][C] 0.9554[/C][/ROW]
[ROW][C]35[/C][C] 0.07514[/C][C] 0.1503[/C][C] 0.9249[/C][/ROW]
[ROW][C]36[/C][C] 0.2735[/C][C] 0.547[/C][C] 0.7265[/C][/ROW]
[ROW][C]37[/C][C] 0.5934[/C][C] 0.8132[/C][C] 0.4066[/C][/ROW]
[ROW][C]38[/C][C] 0.5477[/C][C] 0.9046[/C][C] 0.4523[/C][/ROW]
[ROW][C]39[/C][C] 0.5255[/C][C] 0.949[/C][C] 0.4745[/C][/ROW]
[ROW][C]40[/C][C] 0.4836[/C][C] 0.9672[/C][C] 0.5164[/C][/ROW]
[ROW][C]41[/C][C] 0.4535[/C][C] 0.907[/C][C] 0.5465[/C][/ROW]
[ROW][C]42[/C][C] 0.5068[/C][C] 0.9863[/C][C] 0.4932[/C][/ROW]
[ROW][C]43[/C][C] 0.5214[/C][C] 0.9571[/C][C] 0.4786[/C][/ROW]
[ROW][C]44[/C][C] 0.5829[/C][C] 0.8342[/C][C] 0.4171[/C][/ROW]
[ROW][C]45[/C][C] 0.6464[/C][C] 0.7071[/C][C] 0.3536[/C][/ROW]
[ROW][C]46[/C][C] 0.6261[/C][C] 0.7478[/C][C] 0.3739[/C][/ROW]
[ROW][C]47[/C][C] 0.5746[/C][C] 0.8507[/C][C] 0.4254[/C][/ROW]
[ROW][C]48[/C][C] 0.5234[/C][C] 0.9532[/C][C] 0.4766[/C][/ROW]
[ROW][C]49[/C][C] 0.626[/C][C] 0.748[/C][C] 0.374[/C][/ROW]
[ROW][C]50[/C][C] 0.6694[/C][C] 0.6612[/C][C] 0.3306[/C][/ROW]
[ROW][C]51[/C][C] 0.7621[/C][C] 0.4758[/C][C] 0.2379[/C][/ROW]
[ROW][C]52[/C][C] 0.8217[/C][C] 0.3567[/C][C] 0.1783[/C][/ROW]
[ROW][C]53[/C][C] 0.8038[/C][C] 0.3924[/C][C] 0.1962[/C][/ROW]
[ROW][C]54[/C][C] 0.7927[/C][C] 0.4146[/C][C] 0.2073[/C][/ROW]
[ROW][C]55[/C][C] 0.7855[/C][C] 0.4291[/C][C] 0.2145[/C][/ROW]
[ROW][C]56[/C][C] 0.7671[/C][C] 0.4659[/C][C] 0.2329[/C][/ROW]
[ROW][C]57[/C][C] 0.747[/C][C] 0.506[/C][C] 0.253[/C][/ROW]
[ROW][C]58[/C][C] 0.7081[/C][C] 0.5838[/C][C] 0.2919[/C][/ROW]
[ROW][C]59[/C][C] 0.6771[/C][C] 0.6457[/C][C] 0.3229[/C][/ROW]
[ROW][C]60[/C][C] 0.6303[/C][C] 0.7394[/C][C] 0.3697[/C][/ROW]
[ROW][C]61[/C][C] 0.6181[/C][C] 0.7638[/C][C] 0.3819[/C][/ROW]
[ROW][C]62[/C][C] 0.5969[/C][C] 0.8062[/C][C] 0.4031[/C][/ROW]
[ROW][C]63[/C][C] 0.5668[/C][C] 0.8663[/C][C] 0.4332[/C][/ROW]
[ROW][C]64[/C][C] 0.6434[/C][C] 0.7132[/C][C] 0.3566[/C][/ROW]
[ROW][C]65[/C][C] 0.6496[/C][C] 0.7008[/C][C] 0.3504[/C][/ROW]
[ROW][C]66[/C][C] 0.6054[/C][C] 0.7891[/C][C] 0.3946[/C][/ROW]
[ROW][C]67[/C][C] 0.5784[/C][C] 0.8432[/C][C] 0.4216[/C][/ROW]
[ROW][C]68[/C][C] 0.6169[/C][C] 0.7663[/C][C] 0.3831[/C][/ROW]
[ROW][C]69[/C][C] 0.6002[/C][C] 0.7997[/C][C] 0.3998[/C][/ROW]
[ROW][C]70[/C][C] 0.658[/C][C] 0.684[/C][C] 0.342[/C][/ROW]
[ROW][C]71[/C][C] 0.6832[/C][C] 0.6336[/C][C] 0.3168[/C][/ROW]
[ROW][C]72[/C][C] 0.642[/C][C] 0.7161[/C][C] 0.358[/C][/ROW]
[ROW][C]73[/C][C] 0.6146[/C][C] 0.7707[/C][C] 0.3854[/C][/ROW]
[ROW][C]74[/C][C] 0.737[/C][C] 0.5261[/C][C] 0.263[/C][/ROW]
[ROW][C]75[/C][C] 0.7011[/C][C] 0.5978[/C][C] 0.2989[/C][/ROW]
[ROW][C]76[/C][C] 0.9069[/C][C] 0.1861[/C][C] 0.09307[/C][/ROW]
[ROW][C]77[/C][C] 0.9317[/C][C] 0.1367[/C][C] 0.06835[/C][/ROW]
[ROW][C]78[/C][C] 0.9585[/C][C] 0.08295[/C][C] 0.04148[/C][/ROW]
[ROW][C]79[/C][C] 0.9497[/C][C] 0.1007[/C][C] 0.05033[/C][/ROW]
[ROW][C]80[/C][C] 0.9473[/C][C] 0.1054[/C][C] 0.05269[/C][/ROW]
[ROW][C]81[/C][C] 0.9454[/C][C] 0.1092[/C][C] 0.05459[/C][/ROW]
[ROW][C]82[/C][C] 0.9357[/C][C] 0.1286[/C][C] 0.06432[/C][/ROW]
[ROW][C]83[/C][C] 0.9392[/C][C] 0.1215[/C][C] 0.06076[/C][/ROW]
[ROW][C]84[/C][C] 0.9464[/C][C] 0.1071[/C][C] 0.05356[/C][/ROW]
[ROW][C]85[/C][C] 0.9408[/C][C] 0.1183[/C][C] 0.05917[/C][/ROW]
[ROW][C]86[/C][C] 0.9228[/C][C] 0.1544[/C][C] 0.0772[/C][/ROW]
[ROW][C]87[/C][C] 0.9179[/C][C] 0.1643[/C][C] 0.08214[/C][/ROW]
[ROW][C]88[/C][C] 0.9044[/C][C] 0.1913[/C][C] 0.09563[/C][/ROW]
[ROW][C]89[/C][C] 0.8738[/C][C] 0.2525[/C][C] 0.1262[/C][/ROW]
[ROW][C]90[/C][C] 0.8333[/C][C] 0.3335[/C][C] 0.1667[/C][/ROW]
[ROW][C]91[/C][C] 0.7838[/C][C] 0.4324[/C][C] 0.2162[/C][/ROW]
[ROW][C]92[/C][C] 0.7273[/C][C] 0.5454[/C][C] 0.2727[/C][/ROW]
[ROW][C]93[/C][C] 0.7371[/C][C] 0.5258[/C][C] 0.2629[/C][/ROW]
[ROW][C]94[/C][C] 0.7091[/C][C] 0.5817[/C][C] 0.2909[/C][/ROW]
[ROW][C]95[/C][C] 0.6386[/C][C] 0.7229[/C][C] 0.3614[/C][/ROW]
[ROW][C]96[/C][C] 0.5912[/C][C] 0.8177[/C][C] 0.4088[/C][/ROW]
[ROW][C]97[/C][C] 0.7972[/C][C] 0.4055[/C][C] 0.2028[/C][/ROW]
[ROW][C]98[/C][C] 0.7307[/C][C] 0.5387[/C][C] 0.2693[/C][/ROW]
[ROW][C]99[/C][C] 0.6756[/C][C] 0.6488[/C][C] 0.3244[/C][/ROW]
[ROW][C]100[/C][C] 0.6593[/C][C] 0.6814[/C][C] 0.3407[/C][/ROW]
[ROW][C]101[/C][C] 0.8265[/C][C] 0.3471[/C][C] 0.1735[/C][/ROW]
[ROW][C]102[/C][C] 0.8023[/C][C] 0.3954[/C][C] 0.1977[/C][/ROW]
[ROW][C]103[/C][C] 0.7551[/C][C] 0.4898[/C][C] 0.2449[/C][/ROW]
[ROW][C]104[/C][C] 0.6597[/C][C] 0.6805[/C][C] 0.3403[/C][/ROW]
[ROW][C]105[/C][C] 0.8429[/C][C] 0.3143[/C][C] 0.1571[/C][/ROW]
[ROW][C]106[/C][C] 0.7469[/C][C] 0.5062[/C][C] 0.2531[/C][/ROW]
[ROW][C]107[/C][C] 0.6144[/C][C] 0.7711[/C][C] 0.3856[/C][/ROW]
[ROW][C]108[/C][C] 0.4459[/C][C] 0.8917[/C][C] 0.5541[/C][/ROW]
[/TABLE]
Source: https://freestatistics.org/blog/index.php?pk=285198&T=5

Globally Unique Identifier (entire table): ba.freestatistics.org/blog/index.php?pk=285198&T=5

As an alternative you can also use a QR Code:  

The GUIDs for individual cells are displayed in the table below:

Goldfeld-Quandt test for Heteroskedasticity
p-valuesAlternative Hypothesis
breakpoint indexgreater2-sidedless
12 0.1459 0.2918 0.8541
13 0.08499 0.17 0.915
14 0.2236 0.4473 0.7764
15 0.3599 0.7199 0.6401
16 0.4796 0.9592 0.5204
17 0.3778 0.7557 0.6222
18 0.3054 0.6107 0.6946
19 0.2666 0.5332 0.7334
20 0.1983 0.3966 0.8017
21 0.1758 0.3515 0.8242
22 0.1612 0.3223 0.8388
23 0.1305 0.2609 0.8695
24 0.106 0.212 0.894
25 0.07304 0.1461 0.927
26 0.04837 0.09674 0.9516
27 0.03478 0.06956 0.9652
28 0.03158 0.06317 0.9684
29 0.03386 0.06772 0.9661
30 0.04322 0.08644 0.9568
31 0.03682 0.07365 0.9632
32 0.03539 0.07078 0.9646
33 0.04979 0.09958 0.9502
34 0.04463 0.08927 0.9554
35 0.07514 0.1503 0.9249
36 0.2735 0.547 0.7265
37 0.5934 0.8132 0.4066
38 0.5477 0.9046 0.4523
39 0.5255 0.949 0.4745
40 0.4836 0.9672 0.5164
41 0.4535 0.907 0.5465
42 0.5068 0.9863 0.4932
43 0.5214 0.9571 0.4786
44 0.5829 0.8342 0.4171
45 0.6464 0.7071 0.3536
46 0.6261 0.7478 0.3739
47 0.5746 0.8507 0.4254
48 0.5234 0.9532 0.4766
49 0.626 0.748 0.374
50 0.6694 0.6612 0.3306
51 0.7621 0.4758 0.2379
52 0.8217 0.3567 0.1783
53 0.8038 0.3924 0.1962
54 0.7927 0.4146 0.2073
55 0.7855 0.4291 0.2145
56 0.7671 0.4659 0.2329
57 0.747 0.506 0.253
58 0.7081 0.5838 0.2919
59 0.6771 0.6457 0.3229
60 0.6303 0.7394 0.3697
61 0.6181 0.7638 0.3819
62 0.5969 0.8062 0.4031
63 0.5668 0.8663 0.4332
64 0.6434 0.7132 0.3566
65 0.6496 0.7008 0.3504
66 0.6054 0.7891 0.3946
67 0.5784 0.8432 0.4216
68 0.6169 0.7663 0.3831
69 0.6002 0.7997 0.3998
70 0.658 0.684 0.342
71 0.6832 0.6336 0.3168
72 0.642 0.7161 0.358
73 0.6146 0.7707 0.3854
74 0.737 0.5261 0.263
75 0.7011 0.5978 0.2989
76 0.9069 0.1861 0.09307
77 0.9317 0.1367 0.06835
78 0.9585 0.08295 0.04148
79 0.9497 0.1007 0.05033
80 0.9473 0.1054 0.05269
81 0.9454 0.1092 0.05459
82 0.9357 0.1286 0.06432
83 0.9392 0.1215 0.06076
84 0.9464 0.1071 0.05356
85 0.9408 0.1183 0.05917
86 0.9228 0.1544 0.0772
87 0.9179 0.1643 0.08214
88 0.9044 0.1913 0.09563
89 0.8738 0.2525 0.1262
90 0.8333 0.3335 0.1667
91 0.7838 0.4324 0.2162
92 0.7273 0.5454 0.2727
93 0.7371 0.5258 0.2629
94 0.7091 0.5817 0.2909
95 0.6386 0.7229 0.3614
96 0.5912 0.8177 0.4088
97 0.7972 0.4055 0.2028
98 0.7307 0.5387 0.2693
99 0.6756 0.6488 0.3244
100 0.6593 0.6814 0.3407
101 0.8265 0.3471 0.1735
102 0.8023 0.3954 0.1977
103 0.7551 0.4898 0.2449
104 0.6597 0.6805 0.3403
105 0.8429 0.3143 0.1571
106 0.7469 0.5062 0.2531
107 0.6144 0.7711 0.3856
108 0.4459 0.8917 0.5541


Meta Analysis of Goldfeld-Quandt test for Heteroskedasticity
Description# significant tests% significant testsOK/NOK
1% type I error level0 0OK
5% type I error level00OK
10% type I error level100.103093NOK

\begin{tabular}{lllllllll}
\hline
Meta Analysis of Goldfeld-Quandt test for Heteroskedasticity \tabularnewline
Description & # significant tests & % significant tests & OK/NOK \tabularnewline
1% type I error level & 0 &  0 & OK \tabularnewline
5% type I error level & 0 & 0 & OK \tabularnewline
10% type I error level & 10 & 0.103093 & NOK \tabularnewline
\hline
\end{tabular}
%Source: https://freestatistics.org/blog/index.php?pk=285198&T=6

[TABLE]
[ROW][C]Meta Analysis of Goldfeld-Quandt test for Heteroskedasticity[/C][/ROW]
[ROW][C]Description[/C][C]# significant tests[/C][C]% significant tests[/C][C]OK/NOK[/C][/ROW]
[ROW][C]1% type I error level[/C][C]0[/C][C] 0[/C][C]OK[/C][/ROW]
[ROW][C]5% type I error level[/C][C]0[/C][C]0[/C][C]OK[/C][/ROW]
[ROW][C]10% type I error level[/C][C]10[/C][C]0.103093[/C][C]NOK[/C][/ROW]
[/TABLE]
Source: https://freestatistics.org/blog/index.php?pk=285198&T=6

Globally Unique Identifier (entire table): ba.freestatistics.org/blog/index.php?pk=285198&T=6

As an alternative you can also use a QR Code:  

The GUIDs for individual cells are displayed in the table below:

Meta Analysis of Goldfeld-Quandt test for Heteroskedasticity
Description# significant tests% significant testsOK/NOK
1% type I error level0 0OK
5% type I error level00OK
10% type I error level100.103093NOK


Parameters (Session):
par1 = 1 ; par2 = Do not include Seasonal Dummies ; par3 = No Linear Trend ;
Parameters (R input):
par1 = 1 ; par2 = Do not include Seasonal Dummies ; par3 = No Linear Trend ; par4 = ; par5 = ;
R code (references can be found in the software module):
par5 <- ''
par4 <- ''
par3 <- 'No Linear Trend'
par2 <- 'Do not include Seasonal Dummies'
par1 <- ''
library(lattice)
library(lmtest)
n25 <- 25 #minimum number of obs. for Goldfeld-Quandt test
mywarning <- ''
par1 <- as.numeric(par1)
if(is.na(par1)) {
par1 <- 1
mywarning = 'Warning: you did not specify the column number of the endogenous series! The first column was selected by default.'
}
if (par4=='') par4 <- 0
par4 <- as.numeric(par4)
if (par5=='') par5 <- 0
par5 <- as.numeric(par5)
x <- na.omit(t(y))
k <- length(x[1,])
n <- length(x[,1])
x1 <- cbind(x[,par1], x[,1:k!=par1])
mycolnames <- c(colnames(x)[par1], colnames(x)[1:k!=par1])
colnames(x1) <- mycolnames #colnames(x)[par1]
x <- x1
if (par3 == 'First Differences'){
x2 <- array(0, dim=c(n-1,k), dimnames=list(1:(n-1), paste('(1-B)',colnames(x),sep='')))
for (i in 1:n-1) {
for (j in 1:k) {
x2[i,j] <- x[i+1,j] - x[i,j]
}
}
x <- x2
}
if(par4 > 0) {
x2 <- array(0, dim=c(n-par4,par4), dimnames=list(1:(n-par4), paste(colnames(x)[par1],'(t-',1:par4,')',sep='')))
for (i in 1:(n-par4)) {
for (j in 1:par4) {
x2[i,j] <- x[i+par4-j,par1]
}
}
x <- cbind(x[(par4+1):n,], x2)
n <- n - par4
}
if (par2 == 'Include Monthly Dummies'){
x2 <- array(0, dim=c(n,11), dimnames=list(1:n, paste('M', seq(1:11), sep ='')))
for (i in 1:11){
x2[seq(i,n,12),i] <- 1
}
x <- cbind(x, x2)
}
if (par2 == 'Include Quarterly Dummies'){
x2 <- array(0, dim=c(n,3), dimnames=list(1:n, paste('Q', seq(1:3), sep ='')))
for (i in 1:3){
x2[seq(i,n,4),i] <- 1
}
x <- cbind(x, x2)
}
k <- length(x[1+par4,])
if (par3 == 'Linear Trend'){
x <- cbind(x, c(1:n))
colnames(x)[k+1] <- 't'
}
x
k <- length(x[1+par4,])
df <- as.data.frame(x)
(mylm <- lm(df))
(mysum <- summary(mylm))
if (n > n25) {
kp3 <- k + 3
nmkm3 <- n - k - 3
gqarr <- array(NA, dim=c(nmkm3-kp3+1,3))
numgqtests <- 0
numsignificant1 <- 0
numsignificant5 <- 0
numsignificant10 <- 0
for (mypoint in kp3:nmkm3) {
j <- 0
numgqtests <- numgqtests + 1
for (myalt in c('greater', 'two.sided', 'less')) {
j <- j + 1
gqarr[mypoint-kp3+1,j] <- gqtest(mylm, point=mypoint, alternative=myalt)$p.value
}
if (gqarr[mypoint-kp3+1,2] < 0.01) numsignificant1 <- numsignificant1 + 1
if (gqarr[mypoint-kp3+1,2] < 0.05) numsignificant5 <- numsignificant5 + 1
if (gqarr[mypoint-kp3+1,2] < 0.10) numsignificant10 <- numsignificant10 + 1
}
gqarr
}
bitmap(file='test0.png')
plot(x[,1], type='l', main='Actuals and Interpolation', ylab='value of Actuals and Interpolation (dots)', xlab='time or index')
points(x[,1]-mysum$resid)
grid()
dev.off()
bitmap(file='test1.png')
plot(mysum$resid, type='b', pch=19, main='Residuals', ylab='value of Residuals', xlab='time or index')
grid()
dev.off()
bitmap(file='test2.png')
hist(mysum$resid, main='Residual Histogram', xlab='values of Residuals')
grid()
dev.off()
bitmap(file='test3.png')
densityplot(~mysum$resid,col='black',main='Residual Density Plot', xlab='values of Residuals')
dev.off()
bitmap(file='test4.png')
qqnorm(mysum$resid, main='Residual Normal Q-Q Plot')
qqline(mysum$resid)
grid()
dev.off()
(myerror <- as.ts(mysum$resid))
bitmap(file='test5.png')
dum <- cbind(lag(myerror,k=1),myerror)
dum
dum1 <- dum[2:length(myerror),]
dum1
z <- as.data.frame(dum1)
z
plot(z,main=paste('Residual Lag plot, lowess, and regression line'), ylab='values of Residuals', xlab='lagged values of Residuals')
lines(lowess(z))
abline(lm(z))
grid()
dev.off()
bitmap(file='test6.png')
acf(mysum$resid, lag.max=length(mysum$resid)/2, main='Residual Autocorrelation Function')
grid()
dev.off()
bitmap(file='test7.png')
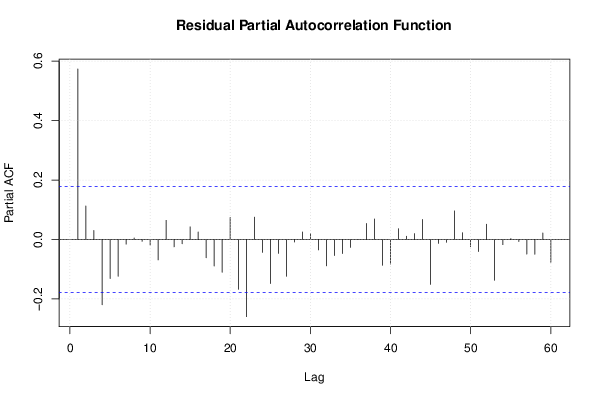
pacf(mysum$resid, lag.max=length(mysum$resid)/2, main='Residual Partial Autocorrelation Function')
grid()
dev.off()
bitmap(file='test8.png')
opar <- par(mfrow = c(2,2), oma = c(0, 0, 1.1, 0))
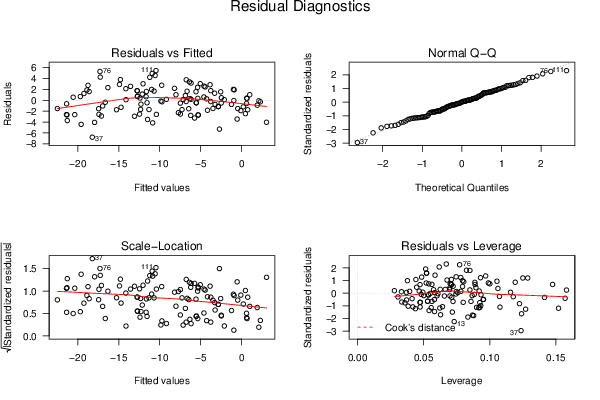
plot(mylm, las = 1, sub='Residual Diagnostics')
par(opar)
dev.off()
if (n > n25) {
bitmap(file='test9.png')
plot(kp3:nmkm3,gqarr[,2], main='Goldfeld-Quandt test',ylab='2-sided p-value',xlab='breakpoint')
grid()
dev.off()
}
load(file='createtable')
a<-table.start()
a<-table.row.start(a)
a<-table.element(a, 'Multiple Linear Regression - Estimated Regression Equation', 1, TRUE)
a<-table.row.end(a)
myeq <- colnames(x)[1]
myeq <- paste(myeq, '[t] = ', sep='')
for (i in 1:k){
if (mysum$coefficients[i,1] > 0) myeq <- paste(myeq, '+', '')
myeq <- paste(myeq, signif(mysum$coefficients[i,1],6), sep=' ')
if (rownames(mysum$coefficients)[i] != '(Intercept)') {
myeq <- paste(myeq, rownames(mysum$coefficients)[i], sep='')
if (rownames(mysum$coefficients)[i] != 't') myeq <- paste(myeq, '[t]', sep='')
}
}
myeq <- paste(myeq, ' + e[t]')
a<-table.row.start(a)
a<-table.element(a, myeq)
a<-table.row.end(a)
a<-table.row.start(a)
a<-table.element(a, mywarning)
a<-table.row.end(a)
a<-table.end(a)
table.save(a,file='mytable1.tab')
a<-table.start()
a<-table.row.start(a)
a<-table.element(a,hyperlink('ols1.htm','Multiple Linear Regression - Ordinary Least Squares',''), 6, TRUE)
a<-table.row.end(a)
a<-table.row.start(a)
a<-table.element(a,'Variable',header=TRUE)
a<-table.element(a,'Parameter',header=TRUE)
a<-table.element(a,'S.D.',header=TRUE)
a<-table.element(a,'T-STAT
H0: parameter = 0',header=TRUE)
a<-table.element(a,'2-tail p-value',header=TRUE)
a<-table.element(a,'1-tail p-value',header=TRUE)
a<-table.row.end(a)
for (i in 1:k){
a<-table.row.start(a)
a<-table.element(a,rownames(mysum$coefficients)[i],header=TRUE)
a<-table.element(a,formatC(signif(mysum$coefficients[i,1],5),format='g',flag='+'))
a<-table.element(a,formatC(signif(mysum$coefficients[i,2],5),format='g',flag=' '))
a<-table.element(a,formatC(signif(mysum$coefficients[i,3],4),format='e',flag='+'))
a<-table.element(a,formatC(signif(mysum$coefficients[i,4],4),format='g',flag=' '))
a<-table.element(a,formatC(signif(mysum$coefficients[i,4]/2,4),format='g',flag=' '))
a<-table.row.end(a)
}
a<-table.end(a)
table.save(a,file='mytable2.tab')
a<-table.start()
a<-table.row.start(a)
a<-table.element(a, 'Multiple Linear Regression - Regression Statistics', 2, TRUE)
a<-table.row.end(a)
a<-table.row.start(a)
a<-table.element(a, 'Multiple R',1,TRUE)
a<-table.element(a,formatC(signif(sqrt(mysum$r.squared),6),format='g',flag=' '))
a<-table.row.end(a)
a<-table.row.start(a)
a<-table.element(a, 'R-squared',1,TRUE)
a<-table.element(a,formatC(signif(mysum$r.squared,6),format='g',flag=' '))
a<-table.row.end(a)
a<-table.row.start(a)
a<-table.element(a, 'Adjusted R-squared',1,TRUE)
a<-table.element(a,formatC(signif(mysum$adj.r.squared,6),format='g',flag=' '))
a<-table.row.end(a)
a<-table.row.start(a)
a<-table.element(a, 'F-TEST (value)',1,TRUE)
a<-table.element(a,formatC(signif(mysum$fstatistic[1],6),format='g',flag=' '))
a<-table.row.end(a)
a<-table.row.start(a)
a<-table.element(a, 'F-TEST (DF numerator)',1,TRUE)
a<-table.element(a, signif(mysum$fstatistic[2],6))
a<-table.row.end(a)
a<-table.row.start(a)
a<-table.element(a, 'F-TEST (DF denominator)',1,TRUE)
a<-table.element(a, signif(mysum$fstatistic[3],6))
a<-table.row.end(a)
a<-table.row.start(a)
a<-table.element(a, 'p-value',1,TRUE)
a<-table.element(a,formatC(signif(1-pf(mysum$fstatistic[1],mysum$fstatistic[2],mysum$fstatistic[3]),6),format='g',flag=' '))
a<-table.row.end(a)
a<-table.row.start(a)
a<-table.element(a, 'Multiple Linear Regression - Residual Statistics', 2, TRUE)
a<-table.row.end(a)
a<-table.row.start(a)
a<-table.element(a, 'Residual Standard Deviation',1,TRUE)
a<-table.element(a,formatC(signif(mysum$sigma,6),format='g',flag=' '))
a<-table.row.end(a)
a<-table.row.start(a)
a<-table.element(a, 'Sum Squared Residuals',1,TRUE)
a<-table.element(a,formatC(signif(sum(myerror*myerror),6),format='g',flag=' '))
a<-table.row.end(a)
a<-table.end(a)
table.save(a,file='mytable3.tab')
if(n < 200) {
a<-table.start()
a<-table.row.start(a)
a<-table.element(a, 'Multiple Linear Regression - Actuals, Interpolation, and Residuals', 4, TRUE)
a<-table.row.end(a)
a<-table.row.start(a)
a<-table.element(a, 'Time or Index', 1, TRUE)
a<-table.element(a, 'Actuals', 1, TRUE)
a<-table.element(a, 'Interpolation
Forecast', 1, TRUE)
a<-table.element(a, 'Residuals
Prediction Error', 1, TRUE)
a<-table.row.end(a)
for (i in 1:n) {
a<-table.row.start(a)
a<-table.element(a,i, 1, TRUE)
a<-table.element(a,formatC(signif(x[i],6),format='g',flag=' '))
a<-table.element(a,formatC(signif(x[i]-mysum$resid[i],6),format='g',flag=' '))
a<-table.element(a,formatC(signif(mysum$resid[i],6),format='g',flag=' '))
a<-table.row.end(a)
}
a<-table.end(a)
table.save(a,file='mytable4.tab')
if (n > n25) {
a<-table.start()
a<-table.row.start(a)
a<-table.element(a,'Goldfeld-Quandt test for Heteroskedasticity',4,TRUE)
a<-table.row.end(a)
a<-table.row.start(a)
a<-table.element(a,'p-values',header=TRUE)
a<-table.element(a,'Alternative Hypothesis',3,header=TRUE)
a<-table.row.end(a)
a<-table.row.start(a)
a<-table.element(a,'breakpoint index',header=TRUE)
a<-table.element(a,'greater',header=TRUE)
a<-table.element(a,'2-sided',header=TRUE)
a<-table.element(a,'less',header=TRUE)
a<-table.row.end(a)
for (mypoint in kp3:nmkm3) {
a<-table.row.start(a)
a<-table.element(a,mypoint,header=TRUE)
a<-table.element(a,formatC(signif(gqarr[mypoint-kp3+1,1],6),format='g',flag=' '))
a<-table.element(a,formatC(signif(gqarr[mypoint-kp3+1,2],6),format='g',flag=' '))
a<-table.element(a,formatC(signif(gqarr[mypoint-kp3+1,3],6),format='g',flag=' '))
a<-table.row.end(a)
}
a<-table.end(a)
table.save(a,file='mytable5.tab')
a<-table.start()
a<-table.row.start(a)
a<-table.element(a,'Meta Analysis of Goldfeld-Quandt test for Heteroskedasticity',4,TRUE)
a<-table.row.end(a)
a<-table.row.start(a)
a<-table.element(a,'Description',header=TRUE)
a<-table.element(a,'# significant tests',header=TRUE)
a<-table.element(a,'% significant tests',header=TRUE)
a<-table.element(a,'OK/NOK',header=TRUE)
a<-table.row.end(a)
a<-table.row.start(a)
a<-table.element(a,'1% type I error level',header=TRUE)
a<-table.element(a,signif(numsignificant1,6))
a<-table.element(a,formatC(signif(numsignificant1/numgqtests,6),format='g',flag=' '))
if (numsignificant1/numgqtests < 0.01) dum <- 'OK' else dum <- 'NOK'
a<-table.element(a,dum)
a<-table.row.end(a)
a<-table.row.start(a)
a<-table.element(a,'5% type I error level',header=TRUE)
a<-table.element(a,signif(numsignificant5,6))
a<-table.element(a,signif(numsignificant5/numgqtests,6))
if (numsignificant5/numgqtests < 0.05) dum <- 'OK' else dum <- 'NOK'
a<-table.element(a,dum)
a<-table.row.end(a)
a<-table.row.start(a)
a<-table.element(a,'10% type I error level',header=TRUE)
a<-table.element(a,signif(numsignificant10,6))
a<-table.element(a,signif(numsignificant10/numgqtests,6))
if (numsignificant10/numgqtests < 0.1) dum <- 'OK' else dum <- 'NOK'
a<-table.element(a,dum)
a<-table.row.end(a)
a<-table.end(a)
table.save(a,file='mytable6.tab')
}
}