Free Statistics

of Irreproducible Research!

Author's title

Author*Unverified author*
R Software Modulerwasp_smp.wasp
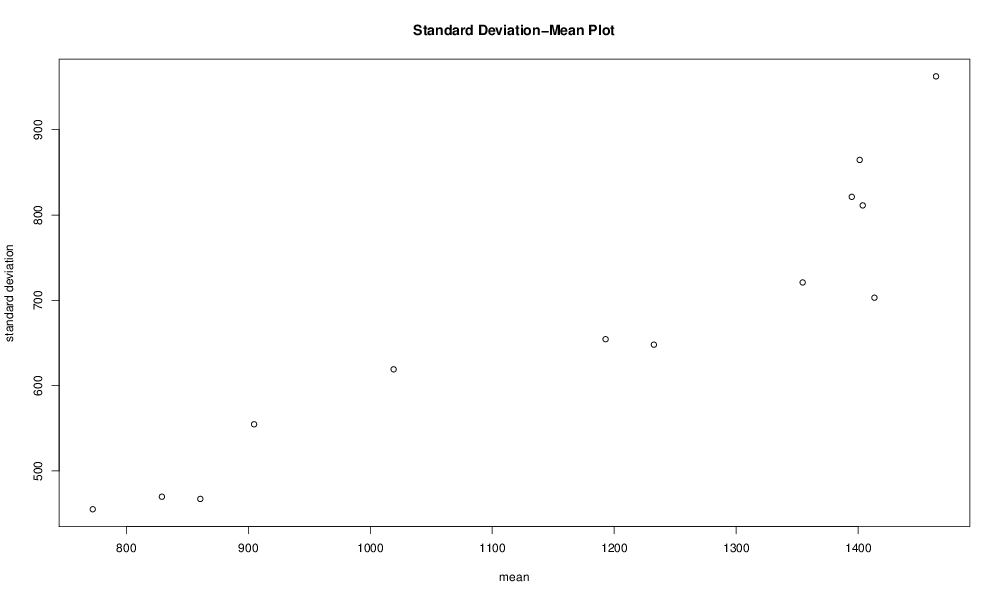
Title produced by softwareStandard Deviation-Mean Plot
Date of computationSat, 05 Dec 2015 15:52:14 +0000
Cite this page as followsStatistical Computations at FreeStatistics.org, Office for Research Development and Education, URL https://freestatistics.org/blog/index.php?v=date/2015/Dec/05/t14493307795e3dsrvnkgluvcy.htm/, Retrieved Fri, 17 May 2024 13:23:54 +0000
Statistical Computations at FreeStatistics.org, Office for Research Development and Education, URL https://freestatistics.org/blog/index.php?pk=285225, Retrieved Fri, 17 May 2024 13:23:54 +0000
QR Codes:

Original text written by user:
IsPrivate?No (this computation is public)
User-defined keywords
Estimated Impact110
Family? (F = Feedback message, R = changed R code, M = changed R Module, P = changed Parameters, D = changed Data)
-       [Standard Deviation-Mean Plot] [Standard deviatio...] [2015-12-05 15:52:14] [76c30f62b7052b57088120e90a652e05] [Current]
Feedback Forum

Post a new message
Dataseries X:
989
1215
2911
2372
2013
2050
1580
1407
903
709
490
206
1101
1189
2877
2489
2145
1837
1613
1296
849
642
475
224
920
1263
2999
2988
2163
2391
1556
1089
976
626
392
203
1052
1034
2353
3075
2309
2009
1464
1099
1035
792
406
187
862
822
2128
2264
1987
1728
1311
1152
945
704
526
361
1035
869
2698
2367
1926
1843
1404
1314
1007
865
587
339
1143
1807
2380
2337
2117
1789
1569
1305
952
810
473
278
993
1038
2257
2284
1747
1515
1233
882
1029
707
391
239
592
692
2127
1854
1468
1535
1203
880
821
604
315
139
528
654
1895
1598
1519
1242
1027
762
735
485
281
131
651
611
1898
1385
1047
1008
843
833
711
444
315
204
473
566
1611
1301
1154
1158
862
801
559
404
223
158
548
647
1757
1326
1308
1175
992
808
758
553
310
146


Summary of computational transaction
Raw Inputview raw input (R code)
Raw Outputview raw output of R engine
Computing time1 seconds
R Server'Herman Ole Andreas Wold' @ wold.wessa.net

\begin{tabular}{lllllllll}
\hline
Summary of computational transaction \tabularnewline
Raw Input & view raw input (R code)  \tabularnewline
Raw Output & view raw output of R engine  \tabularnewline
Computing time & 1 seconds \tabularnewline
R Server & 'Herman Ole Andreas Wold' @ wold.wessa.net \tabularnewline
\hline
\end{tabular}
%Source: https://freestatistics.org/blog/index.php?pk=285225&T=0

[TABLE]
[ROW][C]Summary of computational transaction[/C][/ROW]
[ROW][C]Raw Input[/C][C]view raw input (R code) [/C][/ROW]
[ROW][C]Raw Output[/C][C]view raw output of R engine [/C][/ROW]
[ROW][C]Computing time[/C][C]1 seconds[/C][/ROW]
[ROW][C]R Server[/C][C]'Herman Ole Andreas Wold' @ wold.wessa.net[/C][/ROW]
[/TABLE]
Source: https://freestatistics.org/blog/index.php?pk=285225&T=0

Globally Unique Identifier (entire table): ba.freestatistics.org/blog/index.php?pk=285225&T=0

As an alternative you can also use a QR Code:  

The GUIDs for individual cells are displayed in the table below:

Summary of computational transaction
Raw Inputview raw input (R code)
Raw Outputview raw output of R engine
Computing time1 seconds
R Server'Herman Ole Andreas Wold' @ wold.wessa.net


Standard Deviation-Mean Plot
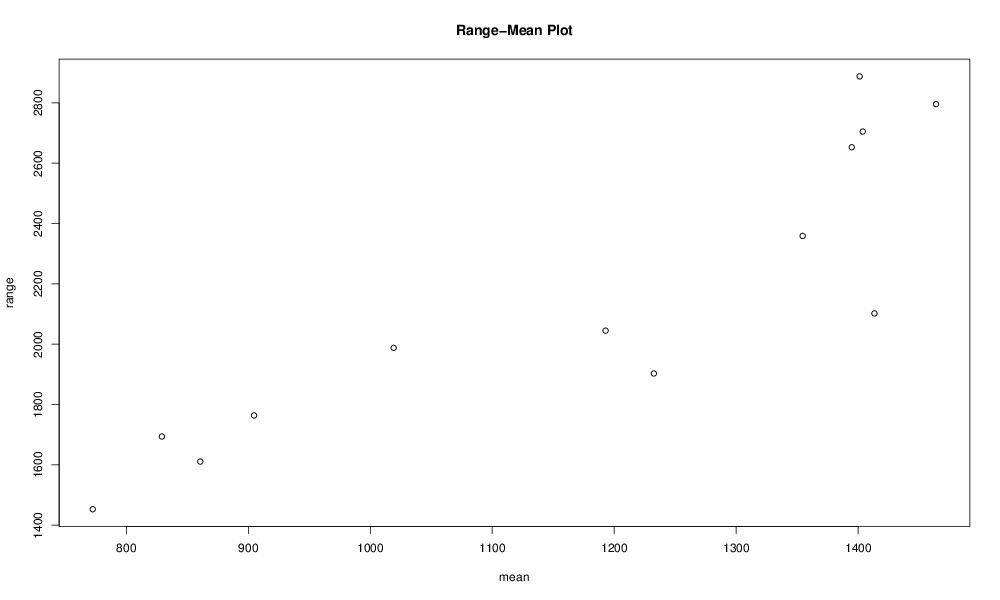
SectionMeanStandard DeviationRange
11403.75811.2743202685962705
21394.75821.3064011350792653
31463.83333333333962.5652122733232796
41401.25864.6085951037462888
51232.5648.0564649921961903
61354.5720.9802039899952359
71413.33333333333703.1065266933512102
81192.91666666667654.4765373019782045
91019.16666666667619.1361773153031988
10904.75554.7422210524291764
11829.166666666667469.8018602334261694
12772.5455.137042299051453
13860.666666666667467.2432368951341611

\begin{tabular}{lllllllll}
\hline
Standard Deviation-Mean Plot \tabularnewline
Section & Mean & Standard Deviation & Range \tabularnewline
1 & 1403.75 & 811.274320268596 & 2705 \tabularnewline
2 & 1394.75 & 821.306401135079 & 2653 \tabularnewline
3 & 1463.83333333333 & 962.565212273323 & 2796 \tabularnewline
4 & 1401.25 & 864.608595103746 & 2888 \tabularnewline
5 & 1232.5 & 648.056464992196 & 1903 \tabularnewline
6 & 1354.5 & 720.980203989995 & 2359 \tabularnewline
7 & 1413.33333333333 & 703.106526693351 & 2102 \tabularnewline
8 & 1192.91666666667 & 654.476537301978 & 2045 \tabularnewline
9 & 1019.16666666667 & 619.136177315303 & 1988 \tabularnewline
10 & 904.75 & 554.742221052429 & 1764 \tabularnewline
11 & 829.166666666667 & 469.801860233426 & 1694 \tabularnewline
12 & 772.5 & 455.13704229905 & 1453 \tabularnewline
13 & 860.666666666667 & 467.243236895134 & 1611 \tabularnewline
\hline
\end{tabular}
%Source: https://freestatistics.org/blog/index.php?pk=285225&T=1

[TABLE]
[ROW][C]Standard Deviation-Mean Plot[/C][/ROW]
[ROW][C]Section[/C][C]Mean[/C][C]Standard Deviation[/C][C]Range[/C][/ROW]
[ROW][C]1[/C][C]1403.75[/C][C]811.274320268596[/C][C]2705[/C][/ROW]
[ROW][C]2[/C][C]1394.75[/C][C]821.306401135079[/C][C]2653[/C][/ROW]
[ROW][C]3[/C][C]1463.83333333333[/C][C]962.565212273323[/C][C]2796[/C][/ROW]
[ROW][C]4[/C][C]1401.25[/C][C]864.608595103746[/C][C]2888[/C][/ROW]
[ROW][C]5[/C][C]1232.5[/C][C]648.056464992196[/C][C]1903[/C][/ROW]
[ROW][C]6[/C][C]1354.5[/C][C]720.980203989995[/C][C]2359[/C][/ROW]
[ROW][C]7[/C][C]1413.33333333333[/C][C]703.106526693351[/C][C]2102[/C][/ROW]
[ROW][C]8[/C][C]1192.91666666667[/C][C]654.476537301978[/C][C]2045[/C][/ROW]
[ROW][C]9[/C][C]1019.16666666667[/C][C]619.136177315303[/C][C]1988[/C][/ROW]
[ROW][C]10[/C][C]904.75[/C][C]554.742221052429[/C][C]1764[/C][/ROW]
[ROW][C]11[/C][C]829.166666666667[/C][C]469.801860233426[/C][C]1694[/C][/ROW]
[ROW][C]12[/C][C]772.5[/C][C]455.13704229905[/C][C]1453[/C][/ROW]
[ROW][C]13[/C][C]860.666666666667[/C][C]467.243236895134[/C][C]1611[/C][/ROW]
[/TABLE]
Source: https://freestatistics.org/blog/index.php?pk=285225&T=1

Globally Unique Identifier (entire table): ba.freestatistics.org/blog/index.php?pk=285225&T=1

As an alternative you can also use a QR Code:  

The GUIDs for individual cells are displayed in the table below:

Standard Deviation-Mean Plot
SectionMeanStandard DeviationRange
11403.75811.2743202685962705
21394.75821.3064011350792653
31463.83333333333962.5652122733232796
41401.25864.6085951037462888
51232.5648.0564649921961903
61354.5720.9802039899952359
71413.33333333333703.1065266933512102
81192.91666666667654.4765373019782045
91019.16666666667619.1361773153031988
10904.75554.7422210524291764
11829.166666666667469.8018602334261694
12772.5455.137042299051453
13860.666666666667467.2432368951341611


Regression: S.E.(k) = alpha + beta * Mean(k)
alpha-8.29702436881219
beta0.581266658627564
S.D.0.0685669183168288
T-STAT8.4773630330255
p-value3.74904018060561e-06

\begin{tabular}{lllllllll}
\hline
Regression: S.E.(k) = alpha + beta * Mean(k) \tabularnewline
alpha & -8.29702436881219 \tabularnewline
beta & 0.581266658627564 \tabularnewline
S.D. & 0.0685669183168288 \tabularnewline
T-STAT & 8.4773630330255 \tabularnewline
p-value & 3.74904018060561e-06 \tabularnewline
\hline
\end{tabular}
%Source: https://freestatistics.org/blog/index.php?pk=285225&T=2

[TABLE]
[ROW][C]Regression: S.E.(k) = alpha + beta * Mean(k)[/C][/ROW]
[ROW][C]alpha[/C][C]-8.29702436881219[/C][/ROW]
[ROW][C]beta[/C][C]0.581266658627564[/C][/ROW]
[ROW][C]S.D.[/C][C]0.0685669183168288[/C][/ROW]
[ROW][C]T-STAT[/C][C]8.4773630330255[/C][/ROW]
[ROW][C]p-value[/C][C]3.74904018060561e-06[/C][/ROW]
[/TABLE]
Source: https://freestatistics.org/blog/index.php?pk=285225&T=2

Globally Unique Identifier (entire table): ba.freestatistics.org/blog/index.php?pk=285225&T=2

As an alternative you can also use a QR Code:  

The GUIDs for individual cells are displayed in the table below:

Regression: S.E.(k) = alpha + beta * Mean(k)
alpha-8.29702436881219
beta0.581266658627564
S.D.0.0685669183168288
T-STAT8.4773630330255
p-value3.74904018060561e-06


Regression: ln S.E.(k) = alpha + beta * ln Mean(k)
alpha-0.462710331982108
beta0.9865408132674
S.D.0.0985244885717622
T-STAT10.0131533547503
p-value7.2965089284736e-07
Lambda0.0134591867325997

\begin{tabular}{lllllllll}
\hline
Regression: ln S.E.(k) = alpha + beta * ln Mean(k) \tabularnewline
alpha & -0.462710331982108 \tabularnewline
beta & 0.9865408132674 \tabularnewline
S.D. & 0.0985244885717622 \tabularnewline
T-STAT & 10.0131533547503 \tabularnewline
p-value & 7.2965089284736e-07 \tabularnewline
Lambda & 0.0134591867325997 \tabularnewline
\hline
\end{tabular}
%Source: https://freestatistics.org/blog/index.php?pk=285225&T=3

[TABLE]
[ROW][C]Regression: ln S.E.(k) = alpha + beta * ln Mean(k)[/C][/ROW]
[ROW][C]alpha[/C][C]-0.462710331982108[/C][/ROW]
[ROW][C]beta[/C][C]0.9865408132674[/C][/ROW]
[ROW][C]S.D.[/C][C]0.0985244885717622[/C][/ROW]
[ROW][C]T-STAT[/C][C]10.0131533547503[/C][/ROW]
[ROW][C]p-value[/C][C]7.2965089284736e-07[/C][/ROW]
[ROW][C]Lambda[/C][C]0.0134591867325997[/C][/ROW]
[/TABLE]
Source: https://freestatistics.org/blog/index.php?pk=285225&T=3

Globally Unique Identifier (entire table): ba.freestatistics.org/blog/index.php?pk=285225&T=3

As an alternative you can also use a QR Code:  

The GUIDs for individual cells are displayed in the table below:

Regression: ln S.E.(k) = alpha + beta * ln Mean(k)
alpha-0.462710331982108
beta0.9865408132674
S.D.0.0985244885717622
T-STAT10.0131533547503
p-value7.2965089284736e-07
Lambda0.0134591867325997


Parameters (Session):
par1 = 12 ;
Parameters (R input):
par1 = 12 ;
R code (references can be found in the software module):
par1 <- as.numeric(par1)
(n <- length(x))
(np <- floor(n / par1))
arr <- array(NA,dim=c(par1,np))
j <- 0
k <- 1
for (i in 1:(np*par1))
{
j = j + 1
arr[j,k] <- x[i]
if (j == par1) {
j = 0
k=k+1
}
}
arr
arr.mean <- array(NA,dim=np)
arr.sd <- array(NA,dim=np)
arr.range <- array(NA,dim=np)
for (j in 1:np)
{
arr.mean[j] <- mean(arr[,j],na.rm=TRUE)
arr.sd[j] <- sd(arr[,j],na.rm=TRUE)
arr.range[j] <- max(arr[,j],na.rm=TRUE) - min(arr[,j],na.rm=TRUE)
}
arr.mean
arr.sd
arr.range
(lm1 <- lm(arr.sd~arr.mean))
(lnlm1 <- lm(log(arr.sd)~log(arr.mean)))
(lm2 <- lm(arr.range~arr.mean))
bitmap(file='test1.png')
plot(arr.mean,arr.sd,main='Standard Deviation-Mean Plot',xlab='mean',ylab='standard deviation')
dev.off()
bitmap(file='test2.png')
plot(arr.mean,arr.range,main='Range-Mean Plot',xlab='mean',ylab='range')
dev.off()
load(file='createtable')
a<-table.start()
a<-table.row.start(a)
a<-table.element(a,'Standard Deviation-Mean Plot',4,TRUE)
a<-table.row.end(a)
a<-table.row.start(a)
a<-table.element(a,'Section',header=TRUE)
a<-table.element(a,'Mean',header=TRUE)
a<-table.element(a,'Standard Deviation',header=TRUE)
a<-table.element(a,'Range',header=TRUE)
a<-table.row.end(a)
for (j in 1:np) {
a<-table.row.start(a)
a<-table.element(a,j,header=TRUE)
a<-table.element(a,arr.mean[j])
a<-table.element(a,arr.sd[j] )
a<-table.element(a,arr.range[j] )
a<-table.row.end(a)
}
a<-table.end(a)
table.save(a,file='mytable.tab')
a<-table.start()
a<-table.row.start(a)
a<-table.element(a,'Regression: S.E.(k) = alpha + beta * Mean(k)',2,TRUE)
a<-table.row.end(a)
a<-table.row.start(a)
a<-table.element(a,'alpha',header=TRUE)
a<-table.element(a,lm1$coefficients[[1]])
a<-table.row.end(a)
a<-table.row.start(a)
a<-table.element(a,'beta',header=TRUE)
a<-table.element(a,lm1$coefficients[[2]])
a<-table.row.end(a)
a<-table.row.start(a)
a<-table.element(a,'S.D.',header=TRUE)
a<-table.element(a,summary(lm1)$coefficients[2,2])
a<-table.row.end(a)
a<-table.row.start(a)
a<-table.element(a,'T-STAT',header=TRUE)
a<-table.element(a,summary(lm1)$coefficients[2,3])
a<-table.row.end(a)
a<-table.row.start(a)
a<-table.element(a,'p-value',header=TRUE)
a<-table.element(a,summary(lm1)$coefficients[2,4])
a<-table.row.end(a)
a<-table.end(a)
table.save(a,file='mytable1.tab')
a<-table.start()
a<-table.row.start(a)
a<-table.element(a,'Regression: ln S.E.(k) = alpha + beta * ln Mean(k)',2,TRUE)
a<-table.row.end(a)
a<-table.row.start(a)
a<-table.element(a,'alpha',header=TRUE)
a<-table.element(a,lnlm1$coefficients[[1]])
a<-table.row.end(a)
a<-table.row.start(a)
a<-table.element(a,'beta',header=TRUE)
a<-table.element(a,lnlm1$coefficients[[2]])
a<-table.row.end(a)
a<-table.row.start(a)
a<-table.element(a,'S.D.',header=TRUE)
a<-table.element(a,summary(lnlm1)$coefficients[2,2])
a<-table.row.end(a)
a<-table.row.start(a)
a<-table.element(a,'T-STAT',header=TRUE)
a<-table.element(a,summary(lnlm1)$coefficients[2,3])
a<-table.row.end(a)
a<-table.row.start(a)
a<-table.element(a,'p-value',header=TRUE)
a<-table.element(a,summary(lnlm1)$coefficients[2,4])
a<-table.row.end(a)
a<-table.row.start(a)
a<-table.element(a,'Lambda',header=TRUE)
a<-table.element(a,1-lnlm1$coefficients[[2]])
a<-table.row.end(a)
a<-table.end(a)
table.save(a,file='mytable2.tab')