Free Statistics

of Irreproducible Research!

Author's title

Author*The author of this computation has been verified*
R Software Modulerwasp_multipleregression.wasp
Title produced by softwareMultiple Regression
Date of computationSun, 06 Dec 2015 20:38:04 +0000
Cite this page as followsStatistical Computations at FreeStatistics.org, Office for Research Development and Education, URL https://freestatistics.org/blog/index.php?v=date/2015/Dec/06/t14494344714hs4b6derp1rxvt.htm/, Retrieved Thu, 16 May 2024 11:38:10 +0000
Statistical Computations at FreeStatistics.org, Office for Research Development and Education, URL https://freestatistics.org/blog/index.php?pk=285319, Retrieved Thu, 16 May 2024 11:38:10 +0000
QR Codes:

Original text written by user:
IsPrivate?No (this computation is public)
User-defined keywordsRegressie 2
Estimated Impact74
Family? (F = Feedback message, R = changed R code, M = changed R Module, P = changed Parameters, D = changed Data)
-       [Multiple Regression] [Paper 2] [2015-12-06 20:38:04] [fb7ef44ef6cdfac67cf9078e3093d323] [Current]
Feedback Forum

Post a new message
Dataseries X:
-5	-6	50	19	-29
-1	-3	53	20	-29
-2	-4	50	21	-29
-5	-7	50	20	-27
-4	-7	51	21	-29
-6	-7	53	19	-24
-2	-3	49	22	-29
-2	0	54	20	-21
-2	-5	57	18	-20
-2	-3	58	16	-26
2	3	56	17	-19
1	2	60	18	-22
-8	-7	55	19	-22
-1	-1	54	18	-15
1	0	52	20	-16
-1	-3	55	21	-22
2	4	56	18	-21
2	2	54	19	-11
1	3	53	19	-10
-1	0	59	19	-6
-2	-10	62	21	-8
-2	-10	63	19	-15
-1	-9	64	19	-16
-8	-22	75	17	-24
-4	-16	77	16	-27
-6	-18	79	16	-33
-3	-14	77	17	-29
-3	-12	82	16	-34
-7	-17	83	15	-37
-9	-23	81	16	-31
-11	-28	78	16	-33
-13	-31	79	16	-25
-11	-21	79	18	-27
-9	-19	73	19	-21
-17	-22	72	16	-32
-22	-22	67	16	-31
-25	-25	67	16	-32
-20	-16	50	18	-30
-24	-22	45	16	-34
-24	-21	39	15	-35
-22	-10	39	15	-37
-19	-7	37	16	-32
-18	-5	30	18	-28
-17	-4	24	16	-26
-11	7	27	19	-24
-11	6	19	19	-27
-12	3	19	18	-26
-10	10	25	17	-27
-15	0	16	19	-27
-15	-2	20	22	-24
-15	-1	25	19	-28
-13	2	34	19	-23
-8	8	39	16	-23
-13	-6	40	18	-29
-9	-4	38	20	-25
-7	4	42	17	-24
-4	7	46	17	-20
-4	3	48	17	-22
-2	3	51	20	-24
0	8	55	21	-27
-2	3	52	19	-25
-3	-3	55	18	-26
1	4	58	20	-24
-2	-5	72	17	-26
-1	-1	70	15	-22
1	5	70	17	-20
-3	0	63	18	-26
-4	-6	66	20	-22
-9	-13	65	19	-29
-9	-15	55	20	-30
-7	-8	57	22	-26
-14	-20	60	20	-30
-12	-10	63	21	-33
-16	-22	65	19	-33
-20	-25	61	22	-31
-12	-10	65	19	-36
-12	-8	63	21	-43
-10	-9	59	19	-40
-10	-5	56	21	-38
-13	-7	54	18	-41
-16	-11	56	18	-38
-14	-11	54	20	-40
-17	-16	58	19	-41
-24	-28	59	19	-45
-25	-27	60	17	-54
-23	-23	57	18	-47
-17	-10	54	17	-44
-24	-22	52	18	-47
-20	-15	50	19	-47
-19	-14	51	17	-45
-18	-12	47	19	-42
-16	-10	51	19	-42
-12	1	46	17	-39
-7	9	44	19	-35
-6	7	39	21	-29
-6	9	43	20	-37
-5	7	46	19	-35
-4	12	43	21	-32
-4	10	34	20	-33
-8	7	36	18	-37
-9	4	34	18	-36
-6	5	38	16	-34
-7	5	32	18	-38
-10	-1	38	19	-33
-11	-5	30	18	-41
-11	-6	17	18	-39
-12	-9	14	17	-40
-14	-15	18	18	-42
-12	-10	18	19	-45
-9	-5	13	18	-39
-5	2	9	19	-44
-6	-1	12	19	-44
-6	0	19	20	-43
-3	4	20	21	-39
-2	8	25	17	-38
-6	-1	26	20	-43
-6	-4	29	21	-46
-10	-10	28	18	-42
-8	-6	30	19	-45
-4	-2	38	20	-46


Summary of computational transaction
Raw Inputview raw input (R code)
Raw Outputview raw output of R engine
Computing time6 seconds
R Server'Herman Ole Andreas Wold' @ wold.wessa.net

\begin{tabular}{lllllllll}
\hline
Summary of computational transaction \tabularnewline
Raw Input & view raw input (R code)  \tabularnewline
Raw Output & view raw output of R engine  \tabularnewline
Computing time & 6 seconds \tabularnewline
R Server & 'Herman Ole Andreas Wold' @ wold.wessa.net \tabularnewline
\hline
\end{tabular}
%Source: https://freestatistics.org/blog/index.php?pk=285319&T=0

[TABLE]
[ROW][C]Summary of computational transaction[/C][/ROW]
[ROW][C]Raw Input[/C][C]view raw input (R code) [/C][/ROW]
[ROW][C]Raw Output[/C][C]view raw output of R engine [/C][/ROW]
[ROW][C]Computing time[/C][C]6 seconds[/C][/ROW]
[ROW][C]R Server[/C][C]'Herman Ole Andreas Wold' @ wold.wessa.net[/C][/ROW]
[/TABLE]
Source: https://freestatistics.org/blog/index.php?pk=285319&T=0

Globally Unique Identifier (entire table): ba.freestatistics.org/blog/index.php?pk=285319&T=0

As an alternative you can also use a QR Code:  

The GUIDs for individual cells are displayed in the table below:

Summary of computational transaction
Raw Inputview raw input (R code)
Raw Outputview raw output of R engine
Computing time6 seconds
R Server'Herman Ole Andreas Wold' @ wold.wessa.net


Multiple Linear Regression - Estimated Regression Equation
consumentenvertrouwen[t] = -4.32771 + 0.344811vooruitz_economie[t] + 0.0655573cons_prijzen_12m[t] + 0.0385856fin_sit_gezinnen[t] + 0.00453854gunstig_sparen[t] + 0.419807`consumentenvertrouwen(t-1)`[t] + 0.0393322`consumentenvertrouwen(t-2)`[t] + 0.0698093`consumentenvertrouwen(t-3)`[t] + 0.0384876`consumentenvertrouwen(t-4)`[t] + 0.143376`consumentenvertrouwen(t-5)`[t] + e[t]

\begin{tabular}{lllllllll}
\hline
Multiple Linear Regression - Estimated Regression Equation \tabularnewline
consumentenvertrouwen[t] =  -4.32771 +  0.344811vooruitz_economie[t] +  0.0655573cons_prijzen_12m[t] +  0.0385856fin_sit_gezinnen[t] +  0.00453854gunstig_sparen[t] +  0.419807`consumentenvertrouwen(t-1)`[t] +  0.0393322`consumentenvertrouwen(t-2)`[t] +  0.0698093`consumentenvertrouwen(t-3)`[t] +  0.0384876`consumentenvertrouwen(t-4)`[t] +  0.143376`consumentenvertrouwen(t-5)`[t]  + e[t] \tabularnewline
 \tabularnewline
\hline
\end{tabular}
%Source: https://freestatistics.org/blog/index.php?pk=285319&T=1

[TABLE]
[ROW][C]Multiple Linear Regression - Estimated Regression Equation[/C][/ROW]
[ROW][C]consumentenvertrouwen[t] =  -4.32771 +  0.344811vooruitz_economie[t] +  0.0655573cons_prijzen_12m[t] +  0.0385856fin_sit_gezinnen[t] +  0.00453854gunstig_sparen[t] +  0.419807`consumentenvertrouwen(t-1)`[t] +  0.0393322`consumentenvertrouwen(t-2)`[t] +  0.0698093`consumentenvertrouwen(t-3)`[t] +  0.0384876`consumentenvertrouwen(t-4)`[t] +  0.143376`consumentenvertrouwen(t-5)`[t]  + e[t][/C][/ROW]
[ROW][C][/C][/ROW]
[/TABLE]
Source: https://freestatistics.org/blog/index.php?pk=285319&T=1

Globally Unique Identifier (entire table): ba.freestatistics.org/blog/index.php?pk=285319&T=1

As an alternative you can also use a QR Code:  

The GUIDs for individual cells are displayed in the table below:

Multiple Linear Regression - Estimated Regression Equation
consumentenvertrouwen[t] = -4.32771 + 0.344811vooruitz_economie[t] + 0.0655573cons_prijzen_12m[t] + 0.0385856fin_sit_gezinnen[t] + 0.00453854gunstig_sparen[t] + 0.419807`consumentenvertrouwen(t-1)`[t] + 0.0393322`consumentenvertrouwen(t-2)`[t] + 0.0698093`consumentenvertrouwen(t-3)`[t] + 0.0384876`consumentenvertrouwen(t-4)`[t] + 0.143376`consumentenvertrouwen(t-5)`[t] + e[t]


Multiple Linear Regression - Ordinary Least Squares
VariableParameterS.D.T-STATH0: parameter = 02-tail p-value1-tail p-value
(Intercept)-4.328 2.986-1.4490e+00 0.1503 0.07514
vooruitz_economie+0.3448 0.03735+9.2310e+00 3.247e-15 1.624e-15
cons_prijzen_12m+0.06556 0.01751+3.7440e+00 0.0002962 0.0001481
fin_sit_gezinnen+0.03859 0.1365+2.8270e-01 0.7779 0.389
gunstig_sparen+0.004538 0.02943+1.5420e-01 0.8777 0.4389
`consumentenvertrouwen(t-1)`+0.4198 0.08008+5.2430e+00 8.248e-07 4.124e-07
`consumentenvertrouwen(t-2)`+0.03933 0.08996+4.3720e-01 0.6629 0.3314
`consumentenvertrouwen(t-3)`+0.06981 0.09076+7.6910e-01 0.4435 0.2218
`consumentenvertrouwen(t-4)`+0.03849 0.09199+4.1840e-01 0.6765 0.3383
`consumentenvertrouwen(t-5)`+0.1434 0.07363+1.9470e+00 0.05419 0.0271

\begin{tabular}{lllllllll}
\hline
Multiple Linear Regression - Ordinary Least Squares \tabularnewline
Variable & Parameter & S.D. & T-STATH0: parameter = 0 & 2-tail p-value & 1-tail p-value \tabularnewline
(Intercept) & -4.328 &  2.986 & -1.4490e+00 &  0.1503 &  0.07514 \tabularnewline
vooruitz_economie & +0.3448 &  0.03735 & +9.2310e+00 &  3.247e-15 &  1.624e-15 \tabularnewline
cons_prijzen_12m & +0.06556 &  0.01751 & +3.7440e+00 &  0.0002962 &  0.0001481 \tabularnewline
fin_sit_gezinnen & +0.03859 &  0.1365 & +2.8270e-01 &  0.7779 &  0.389 \tabularnewline
gunstig_sparen & +0.004538 &  0.02943 & +1.5420e-01 &  0.8777 &  0.4389 \tabularnewline
`consumentenvertrouwen(t-1)` & +0.4198 &  0.08008 & +5.2430e+00 &  8.248e-07 &  4.124e-07 \tabularnewline
`consumentenvertrouwen(t-2)` & +0.03933 &  0.08996 & +4.3720e-01 &  0.6629 &  0.3314 \tabularnewline
`consumentenvertrouwen(t-3)` & +0.06981 &  0.09076 & +7.6910e-01 &  0.4435 &  0.2218 \tabularnewline
`consumentenvertrouwen(t-4)` & +0.03849 &  0.09199 & +4.1840e-01 &  0.6765 &  0.3383 \tabularnewline
`consumentenvertrouwen(t-5)` & +0.1434 &  0.07363 & +1.9470e+00 &  0.05419 &  0.0271 \tabularnewline
\hline
\end{tabular}
%Source: https://freestatistics.org/blog/index.php?pk=285319&T=2

[TABLE]
[ROW][C]Multiple Linear Regression - Ordinary Least Squares[/C][/ROW]
[ROW][C]Variable[/C][C]Parameter[/C][C]S.D.[/C][C]T-STATH0: parameter = 0[/C][C]2-tail p-value[/C][C]1-tail p-value[/C][/ROW]
[ROW][C](Intercept)[/C][C]-4.328[/C][C] 2.986[/C][C]-1.4490e+00[/C][C] 0.1503[/C][C] 0.07514[/C][/ROW]
[ROW][C]vooruitz_economie[/C][C]+0.3448[/C][C] 0.03735[/C][C]+9.2310e+00[/C][C] 3.247e-15[/C][C] 1.624e-15[/C][/ROW]
[ROW][C]cons_prijzen_12m[/C][C]+0.06556[/C][C] 0.01751[/C][C]+3.7440e+00[/C][C] 0.0002962[/C][C] 0.0001481[/C][/ROW]
[ROW][C]fin_sit_gezinnen[/C][C]+0.03859[/C][C] 0.1365[/C][C]+2.8270e-01[/C][C] 0.7779[/C][C] 0.389[/C][/ROW]
[ROW][C]gunstig_sparen[/C][C]+0.004538[/C][C] 0.02943[/C][C]+1.5420e-01[/C][C] 0.8777[/C][C] 0.4389[/C][/ROW]
[ROW][C]`consumentenvertrouwen(t-1)`[/C][C]+0.4198[/C][C] 0.08008[/C][C]+5.2430e+00[/C][C] 8.248e-07[/C][C] 4.124e-07[/C][/ROW]
[ROW][C]`consumentenvertrouwen(t-2)`[/C][C]+0.03933[/C][C] 0.08996[/C][C]+4.3720e-01[/C][C] 0.6629[/C][C] 0.3314[/C][/ROW]
[ROW][C]`consumentenvertrouwen(t-3)`[/C][C]+0.06981[/C][C] 0.09076[/C][C]+7.6910e-01[/C][C] 0.4435[/C][C] 0.2218[/C][/ROW]
[ROW][C]`consumentenvertrouwen(t-4)`[/C][C]+0.03849[/C][C] 0.09199[/C][C]+4.1840e-01[/C][C] 0.6765[/C][C] 0.3383[/C][/ROW]
[ROW][C]`consumentenvertrouwen(t-5)`[/C][C]+0.1434[/C][C] 0.07363[/C][C]+1.9470e+00[/C][C] 0.05419[/C][C] 0.0271[/C][/ROW]
[/TABLE]
Source: https://freestatistics.org/blog/index.php?pk=285319&T=2

Globally Unique Identifier (entire table): ba.freestatistics.org/blog/index.php?pk=285319&T=2

As an alternative you can also use a QR Code:  

The GUIDs for individual cells are displayed in the table below:

Multiple Linear Regression - Ordinary Least Squares
VariableParameterS.D.T-STATH0: parameter = 02-tail p-value1-tail p-value
(Intercept)-4.328 2.986-1.4490e+00 0.1503 0.07514
vooruitz_economie+0.3448 0.03735+9.2310e+00 3.247e-15 1.624e-15
cons_prijzen_12m+0.06556 0.01751+3.7440e+00 0.0002962 0.0001481
fin_sit_gezinnen+0.03859 0.1365+2.8270e-01 0.7779 0.389
gunstig_sparen+0.004538 0.02943+1.5420e-01 0.8777 0.4389
`consumentenvertrouwen(t-1)`+0.4198 0.08008+5.2430e+00 8.248e-07 4.124e-07
`consumentenvertrouwen(t-2)`+0.03933 0.08996+4.3720e-01 0.6629 0.3314
`consumentenvertrouwen(t-3)`+0.06981 0.09076+7.6910e-01 0.4435 0.2218
`consumentenvertrouwen(t-4)`+0.03849 0.09199+4.1840e-01 0.6765 0.3383
`consumentenvertrouwen(t-5)`+0.1434 0.07363+1.9470e+00 0.05419 0.0271


Multiple Linear Regression - Regression Statistics
Multiple R 0.9486
R-squared 0.8998
Adjusted R-squared 0.8912
F-TEST (value) 104.8
F-TEST (DF numerator)9
F-TEST (DF denominator)105
p-value 0
Multiple Linear Regression - Residual Statistics
Residual Standard Deviation 2.323
Sum Squared Residuals 566.5

\begin{tabular}{lllllllll}
\hline
Multiple Linear Regression - Regression Statistics \tabularnewline
Multiple R &  0.9486 \tabularnewline
R-squared &  0.8998 \tabularnewline
Adjusted R-squared &  0.8912 \tabularnewline
F-TEST (value) &  104.8 \tabularnewline
F-TEST (DF numerator) & 9 \tabularnewline
F-TEST (DF denominator) & 105 \tabularnewline
p-value &  0 \tabularnewline
Multiple Linear Regression - Residual Statistics \tabularnewline
Residual Standard Deviation &  2.323 \tabularnewline
Sum Squared Residuals &  566.5 \tabularnewline
\hline
\end{tabular}
%Source: https://freestatistics.org/blog/index.php?pk=285319&T=3

[TABLE]
[ROW][C]Multiple Linear Regression - Regression Statistics[/C][/ROW]
[ROW][C]Multiple R[/C][C] 0.9486[/C][/ROW]
[ROW][C]R-squared[/C][C] 0.8998[/C][/ROW]
[ROW][C]Adjusted R-squared[/C][C] 0.8912[/C][/ROW]
[ROW][C]F-TEST (value)[/C][C] 104.8[/C][/ROW]
[ROW][C]F-TEST (DF numerator)[/C][C]9[/C][/ROW]
[ROW][C]F-TEST (DF denominator)[/C][C]105[/C][/ROW]
[ROW][C]p-value[/C][C] 0[/C][/ROW]
[ROW][C]Multiple Linear Regression - Residual Statistics[/C][/ROW]
[ROW][C]Residual Standard Deviation[/C][C] 2.323[/C][/ROW]
[ROW][C]Sum Squared Residuals[/C][C] 566.5[/C][/ROW]
[/TABLE]
Source: https://freestatistics.org/blog/index.php?pk=285319&T=3

Globally Unique Identifier (entire table): ba.freestatistics.org/blog/index.php?pk=285319&T=3

As an alternative you can also use a QR Code:  

The GUIDs for individual cells are displayed in the table below:

Multiple Linear Regression - Regression Statistics
Multiple R 0.9486
R-squared 0.8998
Adjusted R-squared 0.8912
F-TEST (value) 104.8
F-TEST (DF numerator)9
F-TEST (DF denominator)105
p-value 0
Multiple Linear Regression - Residual Statistics
Residual Standard Deviation 2.323
Sum Squared Residuals 566.5


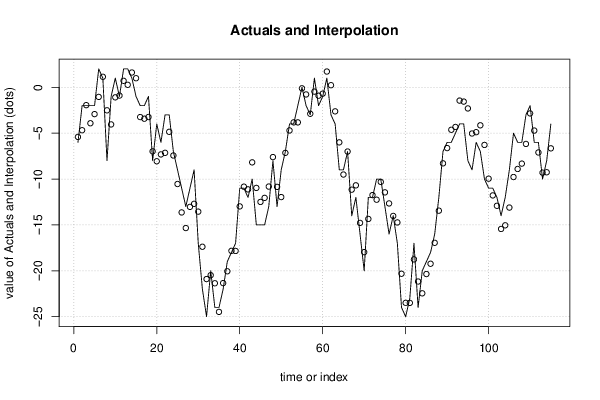
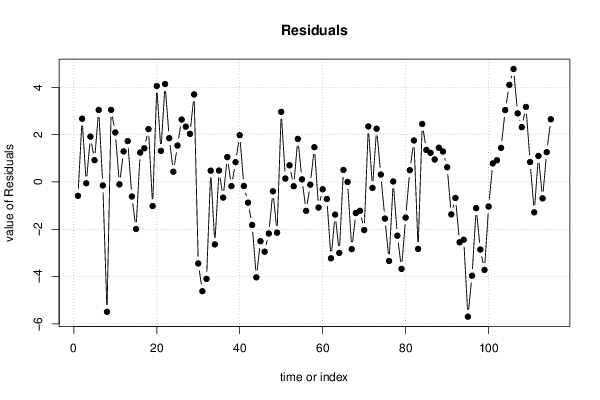
Multiple Linear Regression - Actuals, Interpolation, and Residuals
Time or IndexActualsInterpolationForecastResidualsPrediction Error
1-6-5.414-0.5865
2-2-4.678 2.678
3-2-1.945-0.05475
4-2-3.919 1.919
5-2-2.923 0.9228
6 2-1.047 3.047
7 1 1.148-0.1476
8-8-2.507-5.493
9-1-4.049 3.049
10 1-1.094 2.094
11-1-0.8988-0.1012
12 2 0.7072 1.293
13 2 0.2698 1.73
14 1 1.613-0.6126
15-1 0.989-1.989
16-2-3.245 1.245
17-2-3.426 1.426
18-1-3.238 2.238
19-8-6.983-1.017
20-4-8.06 4.06
21-6-7.315 1.315
22-3-7.143 4.143
23-3-4.853 1.853
24-7-7.435 0.4346
25-9-10.54 1.542
26-11-13.64 2.64
27-13-15.34 2.34
28-11-13.04 2.036
29-9-12.7 3.703
30-17-13.55-3.447
31-22-17.38-4.619
32-25-20.9-4.097
33-20-20.48 0.4792
34-24-21.36-2.64
35-24-24.48 0.4834
36-22-21.34-0.6598
37-19-20.05 1.053
38-18-17.83-0.1741
39-17-17.84 0.8386
40-11-12.98 1.979
41-11-10.83-0.1687
42-12-11.13-0.8746
43-10-8.181-1.819
44-15-10.97-4.033
45-15-12.49-2.505
46-15-12.05-2.948
47-13-10.82-2.18
48-8-7.605-0.3948
49-13-10.86-2.144
50-9-11.97 2.965
51-7-7.147 0.1471
52-4-4.705 0.7052
53-4-3.821-0.1794
54-2-3.823 1.823
55 0-0.1118 0.1118
56-2-0.7801-1.22
57-3-2.887-0.1134
58 1-0.4719 1.472
59-2-0.9182-1.082
60-1-0.6913-0.3087
61 1 1.72-0.7197
62-3 0.2281-3.228
63-4-2.621-1.379
64-9-6-3
65-9-9.509 0.5086
66-7-7.002 0.002133
67-14-11.16-2.84
68-12-10.69-1.314
69-16-14.78-1.217
70-20-17.97-2.033
71-12-14.35 2.35
72-12-11.75-0.2487
73-10-12.25 2.254
74-10-10.31 0.3143
75-13-11.45-1.549
76-16-12.66-3.341
77-14-14.02 0.02209
78-17-14.73-2.272
79-24-20.32-3.676
80-25-23.49-1.506
81-23-23.5 0.4991
82-17-18.76 1.755
83-24-21.17-2.829
84-20-22.45 2.455
85-19-20.36 1.356
86-18-19.23 1.232
87-16-16.95 0.951
88-12-13.45 1.45
89-7-8.288 1.288
90-6-6.623 0.6231
91-6-4.63-1.37
92-5-4.323-0.6765
93-4-1.45-2.55
94-4-1.558-2.442
95-8-2.304-5.696
96-9-5.036-3.964
97-6-4.892-1.108
98-7-4.143-2.857
99-10-6.282-3.718
100-11-9.962-1.038
101-11-11.79 0.7857
102-12-12.92 0.9171
103-14-15.44 1.443
104-12-15.04 3.041
105-9-13.11 4.109
106-5-9.781 4.781
107-6-8.902 2.902
108-6-8.318 2.318
109-3-6.175 3.175
110-2-2.844 0.8439
111-6-4.716-1.284
112-6-7.102 1.102
113-10-9.306-0.6935
114-8-9.261 1.261
115-4-6.652 2.652

\begin{tabular}{lllllllll}
\hline
Multiple Linear Regression - Actuals, Interpolation, and Residuals \tabularnewline
Time or Index & Actuals & InterpolationForecast & ResidualsPrediction Error \tabularnewline
1 & -6 & -5.414 & -0.5865 \tabularnewline
2 & -2 & -4.678 &  2.678 \tabularnewline
3 & -2 & -1.945 & -0.05475 \tabularnewline
4 & -2 & -3.919 &  1.919 \tabularnewline
5 & -2 & -2.923 &  0.9228 \tabularnewline
6 &  2 & -1.047 &  3.047 \tabularnewline
7 &  1 &  1.148 & -0.1476 \tabularnewline
8 & -8 & -2.507 & -5.493 \tabularnewline
9 & -1 & -4.049 &  3.049 \tabularnewline
10 &  1 & -1.094 &  2.094 \tabularnewline
11 & -1 & -0.8988 & -0.1012 \tabularnewline
12 &  2 &  0.7072 &  1.293 \tabularnewline
13 &  2 &  0.2698 &  1.73 \tabularnewline
14 &  1 &  1.613 & -0.6126 \tabularnewline
15 & -1 &  0.989 & -1.989 \tabularnewline
16 & -2 & -3.245 &  1.245 \tabularnewline
17 & -2 & -3.426 &  1.426 \tabularnewline
18 & -1 & -3.238 &  2.238 \tabularnewline
19 & -8 & -6.983 & -1.017 \tabularnewline
20 & -4 & -8.06 &  4.06 \tabularnewline
21 & -6 & -7.315 &  1.315 \tabularnewline
22 & -3 & -7.143 &  4.143 \tabularnewline
23 & -3 & -4.853 &  1.853 \tabularnewline
24 & -7 & -7.435 &  0.4346 \tabularnewline
25 & -9 & -10.54 &  1.542 \tabularnewline
26 & -11 & -13.64 &  2.64 \tabularnewline
27 & -13 & -15.34 &  2.34 \tabularnewline
28 & -11 & -13.04 &  2.036 \tabularnewline
29 & -9 & -12.7 &  3.703 \tabularnewline
30 & -17 & -13.55 & -3.447 \tabularnewline
31 & -22 & -17.38 & -4.619 \tabularnewline
32 & -25 & -20.9 & -4.097 \tabularnewline
33 & -20 & -20.48 &  0.4792 \tabularnewline
34 & -24 & -21.36 & -2.64 \tabularnewline
35 & -24 & -24.48 &  0.4834 \tabularnewline
36 & -22 & -21.34 & -0.6598 \tabularnewline
37 & -19 & -20.05 &  1.053 \tabularnewline
38 & -18 & -17.83 & -0.1741 \tabularnewline
39 & -17 & -17.84 &  0.8386 \tabularnewline
40 & -11 & -12.98 &  1.979 \tabularnewline
41 & -11 & -10.83 & -0.1687 \tabularnewline
42 & -12 & -11.13 & -0.8746 \tabularnewline
43 & -10 & -8.181 & -1.819 \tabularnewline
44 & -15 & -10.97 & -4.033 \tabularnewline
45 & -15 & -12.49 & -2.505 \tabularnewline
46 & -15 & -12.05 & -2.948 \tabularnewline
47 & -13 & -10.82 & -2.18 \tabularnewline
48 & -8 & -7.605 & -0.3948 \tabularnewline
49 & -13 & -10.86 & -2.144 \tabularnewline
50 & -9 & -11.97 &  2.965 \tabularnewline
51 & -7 & -7.147 &  0.1471 \tabularnewline
52 & -4 & -4.705 &  0.7052 \tabularnewline
53 & -4 & -3.821 & -0.1794 \tabularnewline
54 & -2 & -3.823 &  1.823 \tabularnewline
55 &  0 & -0.1118 &  0.1118 \tabularnewline
56 & -2 & -0.7801 & -1.22 \tabularnewline
57 & -3 & -2.887 & -0.1134 \tabularnewline
58 &  1 & -0.4719 &  1.472 \tabularnewline
59 & -2 & -0.9182 & -1.082 \tabularnewline
60 & -1 & -0.6913 & -0.3087 \tabularnewline
61 &  1 &  1.72 & -0.7197 \tabularnewline
62 & -3 &  0.2281 & -3.228 \tabularnewline
63 & -4 & -2.621 & -1.379 \tabularnewline
64 & -9 & -6 & -3 \tabularnewline
65 & -9 & -9.509 &  0.5086 \tabularnewline
66 & -7 & -7.002 &  0.002133 \tabularnewline
67 & -14 & -11.16 & -2.84 \tabularnewline
68 & -12 & -10.69 & -1.314 \tabularnewline
69 & -16 & -14.78 & -1.217 \tabularnewline
70 & -20 & -17.97 & -2.033 \tabularnewline
71 & -12 & -14.35 &  2.35 \tabularnewline
72 & -12 & -11.75 & -0.2487 \tabularnewline
73 & -10 & -12.25 &  2.254 \tabularnewline
74 & -10 & -10.31 &  0.3143 \tabularnewline
75 & -13 & -11.45 & -1.549 \tabularnewline
76 & -16 & -12.66 & -3.341 \tabularnewline
77 & -14 & -14.02 &  0.02209 \tabularnewline
78 & -17 & -14.73 & -2.272 \tabularnewline
79 & -24 & -20.32 & -3.676 \tabularnewline
80 & -25 & -23.49 & -1.506 \tabularnewline
81 & -23 & -23.5 &  0.4991 \tabularnewline
82 & -17 & -18.76 &  1.755 \tabularnewline
83 & -24 & -21.17 & -2.829 \tabularnewline
84 & -20 & -22.45 &  2.455 \tabularnewline
85 & -19 & -20.36 &  1.356 \tabularnewline
86 & -18 & -19.23 &  1.232 \tabularnewline
87 & -16 & -16.95 &  0.951 \tabularnewline
88 & -12 & -13.45 &  1.45 \tabularnewline
89 & -7 & -8.288 &  1.288 \tabularnewline
90 & -6 & -6.623 &  0.6231 \tabularnewline
91 & -6 & -4.63 & -1.37 \tabularnewline
92 & -5 & -4.323 & -0.6765 \tabularnewline
93 & -4 & -1.45 & -2.55 \tabularnewline
94 & -4 & -1.558 & -2.442 \tabularnewline
95 & -8 & -2.304 & -5.696 \tabularnewline
96 & -9 & -5.036 & -3.964 \tabularnewline
97 & -6 & -4.892 & -1.108 \tabularnewline
98 & -7 & -4.143 & -2.857 \tabularnewline
99 & -10 & -6.282 & -3.718 \tabularnewline
100 & -11 & -9.962 & -1.038 \tabularnewline
101 & -11 & -11.79 &  0.7857 \tabularnewline
102 & -12 & -12.92 &  0.9171 \tabularnewline
103 & -14 & -15.44 &  1.443 \tabularnewline
104 & -12 & -15.04 &  3.041 \tabularnewline
105 & -9 & -13.11 &  4.109 \tabularnewline
106 & -5 & -9.781 &  4.781 \tabularnewline
107 & -6 & -8.902 &  2.902 \tabularnewline
108 & -6 & -8.318 &  2.318 \tabularnewline
109 & -3 & -6.175 &  3.175 \tabularnewline
110 & -2 & -2.844 &  0.8439 \tabularnewline
111 & -6 & -4.716 & -1.284 \tabularnewline
112 & -6 & -7.102 &  1.102 \tabularnewline
113 & -10 & -9.306 & -0.6935 \tabularnewline
114 & -8 & -9.261 &  1.261 \tabularnewline
115 & -4 & -6.652 &  2.652 \tabularnewline
\hline
\end{tabular}
%Source: https://freestatistics.org/blog/index.php?pk=285319&T=4

[TABLE]
[ROW][C]Multiple Linear Regression - Actuals, Interpolation, and Residuals[/C][/ROW]
[ROW][C]Time or Index[/C][C]Actuals[/C][C]InterpolationForecast[/C][C]ResidualsPrediction Error[/C][/ROW]
[ROW][C]1[/C][C]-6[/C][C]-5.414[/C][C]-0.5865[/C][/ROW]
[ROW][C]2[/C][C]-2[/C][C]-4.678[/C][C] 2.678[/C][/ROW]
[ROW][C]3[/C][C]-2[/C][C]-1.945[/C][C]-0.05475[/C][/ROW]
[ROW][C]4[/C][C]-2[/C][C]-3.919[/C][C] 1.919[/C][/ROW]
[ROW][C]5[/C][C]-2[/C][C]-2.923[/C][C] 0.9228[/C][/ROW]
[ROW][C]6[/C][C] 2[/C][C]-1.047[/C][C] 3.047[/C][/ROW]
[ROW][C]7[/C][C] 1[/C][C] 1.148[/C][C]-0.1476[/C][/ROW]
[ROW][C]8[/C][C]-8[/C][C]-2.507[/C][C]-5.493[/C][/ROW]
[ROW][C]9[/C][C]-1[/C][C]-4.049[/C][C] 3.049[/C][/ROW]
[ROW][C]10[/C][C] 1[/C][C]-1.094[/C][C] 2.094[/C][/ROW]
[ROW][C]11[/C][C]-1[/C][C]-0.8988[/C][C]-0.1012[/C][/ROW]
[ROW][C]12[/C][C] 2[/C][C] 0.7072[/C][C] 1.293[/C][/ROW]
[ROW][C]13[/C][C] 2[/C][C] 0.2698[/C][C] 1.73[/C][/ROW]
[ROW][C]14[/C][C] 1[/C][C] 1.613[/C][C]-0.6126[/C][/ROW]
[ROW][C]15[/C][C]-1[/C][C] 0.989[/C][C]-1.989[/C][/ROW]
[ROW][C]16[/C][C]-2[/C][C]-3.245[/C][C] 1.245[/C][/ROW]
[ROW][C]17[/C][C]-2[/C][C]-3.426[/C][C] 1.426[/C][/ROW]
[ROW][C]18[/C][C]-1[/C][C]-3.238[/C][C] 2.238[/C][/ROW]
[ROW][C]19[/C][C]-8[/C][C]-6.983[/C][C]-1.017[/C][/ROW]
[ROW][C]20[/C][C]-4[/C][C]-8.06[/C][C] 4.06[/C][/ROW]
[ROW][C]21[/C][C]-6[/C][C]-7.315[/C][C] 1.315[/C][/ROW]
[ROW][C]22[/C][C]-3[/C][C]-7.143[/C][C] 4.143[/C][/ROW]
[ROW][C]23[/C][C]-3[/C][C]-4.853[/C][C] 1.853[/C][/ROW]
[ROW][C]24[/C][C]-7[/C][C]-7.435[/C][C] 0.4346[/C][/ROW]
[ROW][C]25[/C][C]-9[/C][C]-10.54[/C][C] 1.542[/C][/ROW]
[ROW][C]26[/C][C]-11[/C][C]-13.64[/C][C] 2.64[/C][/ROW]
[ROW][C]27[/C][C]-13[/C][C]-15.34[/C][C] 2.34[/C][/ROW]
[ROW][C]28[/C][C]-11[/C][C]-13.04[/C][C] 2.036[/C][/ROW]
[ROW][C]29[/C][C]-9[/C][C]-12.7[/C][C] 3.703[/C][/ROW]
[ROW][C]30[/C][C]-17[/C][C]-13.55[/C][C]-3.447[/C][/ROW]
[ROW][C]31[/C][C]-22[/C][C]-17.38[/C][C]-4.619[/C][/ROW]
[ROW][C]32[/C][C]-25[/C][C]-20.9[/C][C]-4.097[/C][/ROW]
[ROW][C]33[/C][C]-20[/C][C]-20.48[/C][C] 0.4792[/C][/ROW]
[ROW][C]34[/C][C]-24[/C][C]-21.36[/C][C]-2.64[/C][/ROW]
[ROW][C]35[/C][C]-24[/C][C]-24.48[/C][C] 0.4834[/C][/ROW]
[ROW][C]36[/C][C]-22[/C][C]-21.34[/C][C]-0.6598[/C][/ROW]
[ROW][C]37[/C][C]-19[/C][C]-20.05[/C][C] 1.053[/C][/ROW]
[ROW][C]38[/C][C]-18[/C][C]-17.83[/C][C]-0.1741[/C][/ROW]
[ROW][C]39[/C][C]-17[/C][C]-17.84[/C][C] 0.8386[/C][/ROW]
[ROW][C]40[/C][C]-11[/C][C]-12.98[/C][C] 1.979[/C][/ROW]
[ROW][C]41[/C][C]-11[/C][C]-10.83[/C][C]-0.1687[/C][/ROW]
[ROW][C]42[/C][C]-12[/C][C]-11.13[/C][C]-0.8746[/C][/ROW]
[ROW][C]43[/C][C]-10[/C][C]-8.181[/C][C]-1.819[/C][/ROW]
[ROW][C]44[/C][C]-15[/C][C]-10.97[/C][C]-4.033[/C][/ROW]
[ROW][C]45[/C][C]-15[/C][C]-12.49[/C][C]-2.505[/C][/ROW]
[ROW][C]46[/C][C]-15[/C][C]-12.05[/C][C]-2.948[/C][/ROW]
[ROW][C]47[/C][C]-13[/C][C]-10.82[/C][C]-2.18[/C][/ROW]
[ROW][C]48[/C][C]-8[/C][C]-7.605[/C][C]-0.3948[/C][/ROW]
[ROW][C]49[/C][C]-13[/C][C]-10.86[/C][C]-2.144[/C][/ROW]
[ROW][C]50[/C][C]-9[/C][C]-11.97[/C][C] 2.965[/C][/ROW]
[ROW][C]51[/C][C]-7[/C][C]-7.147[/C][C] 0.1471[/C][/ROW]
[ROW][C]52[/C][C]-4[/C][C]-4.705[/C][C] 0.7052[/C][/ROW]
[ROW][C]53[/C][C]-4[/C][C]-3.821[/C][C]-0.1794[/C][/ROW]
[ROW][C]54[/C][C]-2[/C][C]-3.823[/C][C] 1.823[/C][/ROW]
[ROW][C]55[/C][C] 0[/C][C]-0.1118[/C][C] 0.1118[/C][/ROW]
[ROW][C]56[/C][C]-2[/C][C]-0.7801[/C][C]-1.22[/C][/ROW]
[ROW][C]57[/C][C]-3[/C][C]-2.887[/C][C]-0.1134[/C][/ROW]
[ROW][C]58[/C][C] 1[/C][C]-0.4719[/C][C] 1.472[/C][/ROW]
[ROW][C]59[/C][C]-2[/C][C]-0.9182[/C][C]-1.082[/C][/ROW]
[ROW][C]60[/C][C]-1[/C][C]-0.6913[/C][C]-0.3087[/C][/ROW]
[ROW][C]61[/C][C] 1[/C][C] 1.72[/C][C]-0.7197[/C][/ROW]
[ROW][C]62[/C][C]-3[/C][C] 0.2281[/C][C]-3.228[/C][/ROW]
[ROW][C]63[/C][C]-4[/C][C]-2.621[/C][C]-1.379[/C][/ROW]
[ROW][C]64[/C][C]-9[/C][C]-6[/C][C]-3[/C][/ROW]
[ROW][C]65[/C][C]-9[/C][C]-9.509[/C][C] 0.5086[/C][/ROW]
[ROW][C]66[/C][C]-7[/C][C]-7.002[/C][C] 0.002133[/C][/ROW]
[ROW][C]67[/C][C]-14[/C][C]-11.16[/C][C]-2.84[/C][/ROW]
[ROW][C]68[/C][C]-12[/C][C]-10.69[/C][C]-1.314[/C][/ROW]
[ROW][C]69[/C][C]-16[/C][C]-14.78[/C][C]-1.217[/C][/ROW]
[ROW][C]70[/C][C]-20[/C][C]-17.97[/C][C]-2.033[/C][/ROW]
[ROW][C]71[/C][C]-12[/C][C]-14.35[/C][C] 2.35[/C][/ROW]
[ROW][C]72[/C][C]-12[/C][C]-11.75[/C][C]-0.2487[/C][/ROW]
[ROW][C]73[/C][C]-10[/C][C]-12.25[/C][C] 2.254[/C][/ROW]
[ROW][C]74[/C][C]-10[/C][C]-10.31[/C][C] 0.3143[/C][/ROW]
[ROW][C]75[/C][C]-13[/C][C]-11.45[/C][C]-1.549[/C][/ROW]
[ROW][C]76[/C][C]-16[/C][C]-12.66[/C][C]-3.341[/C][/ROW]
[ROW][C]77[/C][C]-14[/C][C]-14.02[/C][C] 0.02209[/C][/ROW]
[ROW][C]78[/C][C]-17[/C][C]-14.73[/C][C]-2.272[/C][/ROW]
[ROW][C]79[/C][C]-24[/C][C]-20.32[/C][C]-3.676[/C][/ROW]
[ROW][C]80[/C][C]-25[/C][C]-23.49[/C][C]-1.506[/C][/ROW]
[ROW][C]81[/C][C]-23[/C][C]-23.5[/C][C] 0.4991[/C][/ROW]
[ROW][C]82[/C][C]-17[/C][C]-18.76[/C][C] 1.755[/C][/ROW]
[ROW][C]83[/C][C]-24[/C][C]-21.17[/C][C]-2.829[/C][/ROW]
[ROW][C]84[/C][C]-20[/C][C]-22.45[/C][C] 2.455[/C][/ROW]
[ROW][C]85[/C][C]-19[/C][C]-20.36[/C][C] 1.356[/C][/ROW]
[ROW][C]86[/C][C]-18[/C][C]-19.23[/C][C] 1.232[/C][/ROW]
[ROW][C]87[/C][C]-16[/C][C]-16.95[/C][C] 0.951[/C][/ROW]
[ROW][C]88[/C][C]-12[/C][C]-13.45[/C][C] 1.45[/C][/ROW]
[ROW][C]89[/C][C]-7[/C][C]-8.288[/C][C] 1.288[/C][/ROW]
[ROW][C]90[/C][C]-6[/C][C]-6.623[/C][C] 0.6231[/C][/ROW]
[ROW][C]91[/C][C]-6[/C][C]-4.63[/C][C]-1.37[/C][/ROW]
[ROW][C]92[/C][C]-5[/C][C]-4.323[/C][C]-0.6765[/C][/ROW]
[ROW][C]93[/C][C]-4[/C][C]-1.45[/C][C]-2.55[/C][/ROW]
[ROW][C]94[/C][C]-4[/C][C]-1.558[/C][C]-2.442[/C][/ROW]
[ROW][C]95[/C][C]-8[/C][C]-2.304[/C][C]-5.696[/C][/ROW]
[ROW][C]96[/C][C]-9[/C][C]-5.036[/C][C]-3.964[/C][/ROW]
[ROW][C]97[/C][C]-6[/C][C]-4.892[/C][C]-1.108[/C][/ROW]
[ROW][C]98[/C][C]-7[/C][C]-4.143[/C][C]-2.857[/C][/ROW]
[ROW][C]99[/C][C]-10[/C][C]-6.282[/C][C]-3.718[/C][/ROW]
[ROW][C]100[/C][C]-11[/C][C]-9.962[/C][C]-1.038[/C][/ROW]
[ROW][C]101[/C][C]-11[/C][C]-11.79[/C][C] 0.7857[/C][/ROW]
[ROW][C]102[/C][C]-12[/C][C]-12.92[/C][C] 0.9171[/C][/ROW]
[ROW][C]103[/C][C]-14[/C][C]-15.44[/C][C] 1.443[/C][/ROW]
[ROW][C]104[/C][C]-12[/C][C]-15.04[/C][C] 3.041[/C][/ROW]
[ROW][C]105[/C][C]-9[/C][C]-13.11[/C][C] 4.109[/C][/ROW]
[ROW][C]106[/C][C]-5[/C][C]-9.781[/C][C] 4.781[/C][/ROW]
[ROW][C]107[/C][C]-6[/C][C]-8.902[/C][C] 2.902[/C][/ROW]
[ROW][C]108[/C][C]-6[/C][C]-8.318[/C][C] 2.318[/C][/ROW]
[ROW][C]109[/C][C]-3[/C][C]-6.175[/C][C] 3.175[/C][/ROW]
[ROW][C]110[/C][C]-2[/C][C]-2.844[/C][C] 0.8439[/C][/ROW]
[ROW][C]111[/C][C]-6[/C][C]-4.716[/C][C]-1.284[/C][/ROW]
[ROW][C]112[/C][C]-6[/C][C]-7.102[/C][C] 1.102[/C][/ROW]
[ROW][C]113[/C][C]-10[/C][C]-9.306[/C][C]-0.6935[/C][/ROW]
[ROW][C]114[/C][C]-8[/C][C]-9.261[/C][C] 1.261[/C][/ROW]
[ROW][C]115[/C][C]-4[/C][C]-6.652[/C][C] 2.652[/C][/ROW]
[/TABLE]
Source: https://freestatistics.org/blog/index.php?pk=285319&T=4

Globally Unique Identifier (entire table): ba.freestatistics.org/blog/index.php?pk=285319&T=4

As an alternative you can also use a QR Code:  

The GUIDs for individual cells are displayed in the table below:

Multiple Linear Regression - Actuals, Interpolation, and Residuals
Time or IndexActualsInterpolationForecastResidualsPrediction Error
1-6-5.414-0.5865
2-2-4.678 2.678
3-2-1.945-0.05475
4-2-3.919 1.919
5-2-2.923 0.9228
6 2-1.047 3.047
7 1 1.148-0.1476
8-8-2.507-5.493
9-1-4.049 3.049
10 1-1.094 2.094
11-1-0.8988-0.1012
12 2 0.7072 1.293
13 2 0.2698 1.73
14 1 1.613-0.6126
15-1 0.989-1.989
16-2-3.245 1.245
17-2-3.426 1.426
18-1-3.238 2.238
19-8-6.983-1.017
20-4-8.06 4.06
21-6-7.315 1.315
22-3-7.143 4.143
23-3-4.853 1.853
24-7-7.435 0.4346
25-9-10.54 1.542
26-11-13.64 2.64
27-13-15.34 2.34
28-11-13.04 2.036
29-9-12.7 3.703
30-17-13.55-3.447
31-22-17.38-4.619
32-25-20.9-4.097
33-20-20.48 0.4792
34-24-21.36-2.64
35-24-24.48 0.4834
36-22-21.34-0.6598
37-19-20.05 1.053
38-18-17.83-0.1741
39-17-17.84 0.8386
40-11-12.98 1.979
41-11-10.83-0.1687
42-12-11.13-0.8746
43-10-8.181-1.819
44-15-10.97-4.033
45-15-12.49-2.505
46-15-12.05-2.948
47-13-10.82-2.18
48-8-7.605-0.3948
49-13-10.86-2.144
50-9-11.97 2.965
51-7-7.147 0.1471
52-4-4.705 0.7052
53-4-3.821-0.1794
54-2-3.823 1.823
55 0-0.1118 0.1118
56-2-0.7801-1.22
57-3-2.887-0.1134
58 1-0.4719 1.472
59-2-0.9182-1.082
60-1-0.6913-0.3087
61 1 1.72-0.7197
62-3 0.2281-3.228
63-4-2.621-1.379
64-9-6-3
65-9-9.509 0.5086
66-7-7.002 0.002133
67-14-11.16-2.84
68-12-10.69-1.314
69-16-14.78-1.217
70-20-17.97-2.033
71-12-14.35 2.35
72-12-11.75-0.2487
73-10-12.25 2.254
74-10-10.31 0.3143
75-13-11.45-1.549
76-16-12.66-3.341
77-14-14.02 0.02209
78-17-14.73-2.272
79-24-20.32-3.676
80-25-23.49-1.506
81-23-23.5 0.4991
82-17-18.76 1.755
83-24-21.17-2.829
84-20-22.45 2.455
85-19-20.36 1.356
86-18-19.23 1.232
87-16-16.95 0.951
88-12-13.45 1.45
89-7-8.288 1.288
90-6-6.623 0.6231
91-6-4.63-1.37
92-5-4.323-0.6765
93-4-1.45-2.55
94-4-1.558-2.442
95-8-2.304-5.696
96-9-5.036-3.964
97-6-4.892-1.108
98-7-4.143-2.857
99-10-6.282-3.718
100-11-9.962-1.038
101-11-11.79 0.7857
102-12-12.92 0.9171
103-14-15.44 1.443
104-12-15.04 3.041
105-9-13.11 4.109
106-5-9.781 4.781
107-6-8.902 2.902
108-6-8.318 2.318
109-3-6.175 3.175
110-2-2.844 0.8439
111-6-4.716-1.284
112-6-7.102 1.102
113-10-9.306-0.6935
114-8-9.261 1.261
115-4-6.652 2.652


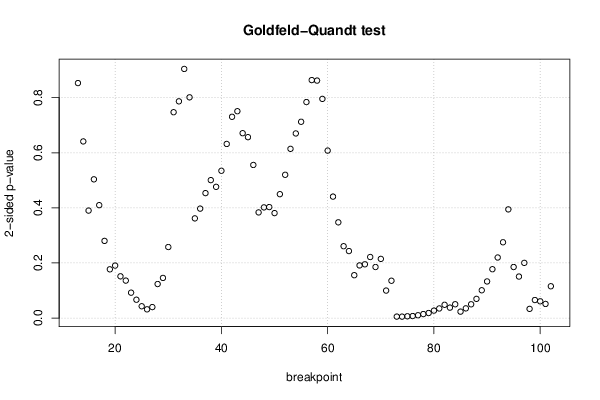
Goldfeld-Quandt test for Heteroskedasticity
p-valuesAlternative Hypothesis
breakpoint indexgreater2-sidedless
13 0.4266 0.8531 0.5734
14 0.3206 0.6412 0.6794
15 0.195 0.39 0.805
16 0.2518 0.5035 0.7482
17 0.2049 0.4098 0.7951
18 0.14 0.28 0.86
19 0.08841 0.1768 0.9116
20 0.09522 0.1904 0.9048
21 0.0757 0.1514 0.9243
22 0.06794 0.1359 0.9321
23 0.04602 0.09204 0.954
24 0.0332 0.06639 0.9668
25 0.02134 0.04268 0.9787
26 0.01578 0.03156 0.9842
27 0.01981 0.03962 0.9802
28 0.06169 0.1234 0.9383
29 0.07274 0.1455 0.9273
30 0.1289 0.2578 0.8711
31 0.3736 0.7473 0.6264
32 0.6066 0.7868 0.3934
33 0.5478 0.9044 0.4522
34 0.5993 0.8014 0.4007
35 0.8191 0.3618 0.1809
36 0.8014 0.3972 0.1986
37 0.7733 0.4535 0.2267
38 0.7497 0.5007 0.2503
39 0.7619 0.4763 0.2381
40 0.7327 0.5346 0.2673
41 0.684 0.632 0.316
42 0.6347 0.7306 0.3653
43 0.6245 0.7509 0.3755
44 0.6644 0.6711 0.3356
45 0.6717 0.6567 0.3283
46 0.7221 0.5557 0.2779
47 0.8083 0.3835 0.1917
48 0.7992 0.4017 0.2008
49 0.7986 0.4028 0.2014
50 0.8095 0.3809 0.1905
51 0.7752 0.4497 0.2248
52 0.74 0.5201 0.26
53 0.6928 0.6143 0.3072
54 0.6649 0.6702 0.3351
55 0.6437 0.7126 0.3563
56 0.6079 0.7841 0.3921
57 0.568 0.864 0.432
58 0.5689 0.8622 0.4311
59 0.6022 0.7957 0.3978
60 0.696 0.6079 0.304
61 0.7796 0.4408 0.2204
62 0.8263 0.3475 0.1737
63 0.8696 0.2607 0.1304
64 0.8784 0.2431 0.1216
65 0.9223 0.1555 0.07773
66 0.9045 0.191 0.09549
67 0.9024 0.1951 0.09755
68 0.8893 0.2215 0.1107
69 0.9074 0.1851 0.09257
70 0.8927 0.2147 0.1073
71 0.9502 0.09962 0.04981
72 0.9323 0.1353 0.06766
73 0.9975 0.005061 0.00253
74 0.9975 0.00491 0.002455
75 0.9969 0.006248 0.003124
76 0.9964 0.007122 0.003561
77 0.995 0.01008 0.005041
78 0.9929 0.01427 0.007137
79 0.9909 0.01814 0.009069
80 0.9865 0.02693 0.01347
81 0.9827 0.03462 0.01731
82 0.976 0.04797 0.02399
83 0.9812 0.03766 0.01883
84 0.975 0.05 0.025
85 0.9885 0.02306 0.01153
86 0.9825 0.03506 0.01753
87 0.9751 0.04986 0.02493
88 0.9653 0.06947 0.03474
89 0.9496 0.1008 0.05038
90 0.9336 0.1328 0.06639
91 0.9114 0.1772 0.08859
92 0.8902 0.2197 0.1098
93 0.8625 0.275 0.1375
94 0.8028 0.3944 0.1972
95 0.9074 0.1851 0.09256
96 0.9247 0.1505 0.07526
97 0.8999 0.2002 0.1001
98 0.9834 0.03321 0.01661
99 0.9674 0.06529 0.03265
100 0.9696 0.06073 0.03037
101 0.9745 0.05105 0.02552
102 0.9424 0.1153 0.05764

\begin{tabular}{lllllllll}
\hline
Goldfeld-Quandt test for Heteroskedasticity \tabularnewline
p-values & Alternative Hypothesis \tabularnewline
breakpoint index & greater & 2-sided & less \tabularnewline
13 &  0.4266 &  0.8531 &  0.5734 \tabularnewline
14 &  0.3206 &  0.6412 &  0.6794 \tabularnewline
15 &  0.195 &  0.39 &  0.805 \tabularnewline
16 &  0.2518 &  0.5035 &  0.7482 \tabularnewline
17 &  0.2049 &  0.4098 &  0.7951 \tabularnewline
18 &  0.14 &  0.28 &  0.86 \tabularnewline
19 &  0.08841 &  0.1768 &  0.9116 \tabularnewline
20 &  0.09522 &  0.1904 &  0.9048 \tabularnewline
21 &  0.0757 &  0.1514 &  0.9243 \tabularnewline
22 &  0.06794 &  0.1359 &  0.9321 \tabularnewline
23 &  0.04602 &  0.09204 &  0.954 \tabularnewline
24 &  0.0332 &  0.06639 &  0.9668 \tabularnewline
25 &  0.02134 &  0.04268 &  0.9787 \tabularnewline
26 &  0.01578 &  0.03156 &  0.9842 \tabularnewline
27 &  0.01981 &  0.03962 &  0.9802 \tabularnewline
28 &  0.06169 &  0.1234 &  0.9383 \tabularnewline
29 &  0.07274 &  0.1455 &  0.9273 \tabularnewline
30 &  0.1289 &  0.2578 &  0.8711 \tabularnewline
31 &  0.3736 &  0.7473 &  0.6264 \tabularnewline
32 &  0.6066 &  0.7868 &  0.3934 \tabularnewline
33 &  0.5478 &  0.9044 &  0.4522 \tabularnewline
34 &  0.5993 &  0.8014 &  0.4007 \tabularnewline
35 &  0.8191 &  0.3618 &  0.1809 \tabularnewline
36 &  0.8014 &  0.3972 &  0.1986 \tabularnewline
37 &  0.7733 &  0.4535 &  0.2267 \tabularnewline
38 &  0.7497 &  0.5007 &  0.2503 \tabularnewline
39 &  0.7619 &  0.4763 &  0.2381 \tabularnewline
40 &  0.7327 &  0.5346 &  0.2673 \tabularnewline
41 &  0.684 &  0.632 &  0.316 \tabularnewline
42 &  0.6347 &  0.7306 &  0.3653 \tabularnewline
43 &  0.6245 &  0.7509 &  0.3755 \tabularnewline
44 &  0.6644 &  0.6711 &  0.3356 \tabularnewline
45 &  0.6717 &  0.6567 &  0.3283 \tabularnewline
46 &  0.7221 &  0.5557 &  0.2779 \tabularnewline
47 &  0.8083 &  0.3835 &  0.1917 \tabularnewline
48 &  0.7992 &  0.4017 &  0.2008 \tabularnewline
49 &  0.7986 &  0.4028 &  0.2014 \tabularnewline
50 &  0.8095 &  0.3809 &  0.1905 \tabularnewline
51 &  0.7752 &  0.4497 &  0.2248 \tabularnewline
52 &  0.74 &  0.5201 &  0.26 \tabularnewline
53 &  0.6928 &  0.6143 &  0.3072 \tabularnewline
54 &  0.6649 &  0.6702 &  0.3351 \tabularnewline
55 &  0.6437 &  0.7126 &  0.3563 \tabularnewline
56 &  0.6079 &  0.7841 &  0.3921 \tabularnewline
57 &  0.568 &  0.864 &  0.432 \tabularnewline
58 &  0.5689 &  0.8622 &  0.4311 \tabularnewline
59 &  0.6022 &  0.7957 &  0.3978 \tabularnewline
60 &  0.696 &  0.6079 &  0.304 \tabularnewline
61 &  0.7796 &  0.4408 &  0.2204 \tabularnewline
62 &  0.8263 &  0.3475 &  0.1737 \tabularnewline
63 &  0.8696 &  0.2607 &  0.1304 \tabularnewline
64 &  0.8784 &  0.2431 &  0.1216 \tabularnewline
65 &  0.9223 &  0.1555 &  0.07773 \tabularnewline
66 &  0.9045 &  0.191 &  0.09549 \tabularnewline
67 &  0.9024 &  0.1951 &  0.09755 \tabularnewline
68 &  0.8893 &  0.2215 &  0.1107 \tabularnewline
69 &  0.9074 &  0.1851 &  0.09257 \tabularnewline
70 &  0.8927 &  0.2147 &  0.1073 \tabularnewline
71 &  0.9502 &  0.09962 &  0.04981 \tabularnewline
72 &  0.9323 &  0.1353 &  0.06766 \tabularnewline
73 &  0.9975 &  0.005061 &  0.00253 \tabularnewline
74 &  0.9975 &  0.00491 &  0.002455 \tabularnewline
75 &  0.9969 &  0.006248 &  0.003124 \tabularnewline
76 &  0.9964 &  0.007122 &  0.003561 \tabularnewline
77 &  0.995 &  0.01008 &  0.005041 \tabularnewline
78 &  0.9929 &  0.01427 &  0.007137 \tabularnewline
79 &  0.9909 &  0.01814 &  0.009069 \tabularnewline
80 &  0.9865 &  0.02693 &  0.01347 \tabularnewline
81 &  0.9827 &  0.03462 &  0.01731 \tabularnewline
82 &  0.976 &  0.04797 &  0.02399 \tabularnewline
83 &  0.9812 &  0.03766 &  0.01883 \tabularnewline
84 &  0.975 &  0.05 &  0.025 \tabularnewline
85 &  0.9885 &  0.02306 &  0.01153 \tabularnewline
86 &  0.9825 &  0.03506 &  0.01753 \tabularnewline
87 &  0.9751 &  0.04986 &  0.02493 \tabularnewline
88 &  0.9653 &  0.06947 &  0.03474 \tabularnewline
89 &  0.9496 &  0.1008 &  0.05038 \tabularnewline
90 &  0.9336 &  0.1328 &  0.06639 \tabularnewline
91 &  0.9114 &  0.1772 &  0.08859 \tabularnewline
92 &  0.8902 &  0.2197 &  0.1098 \tabularnewline
93 &  0.8625 &  0.275 &  0.1375 \tabularnewline
94 &  0.8028 &  0.3944 &  0.1972 \tabularnewline
95 &  0.9074 &  0.1851 &  0.09256 \tabularnewline
96 &  0.9247 &  0.1505 &  0.07526 \tabularnewline
97 &  0.8999 &  0.2002 &  0.1001 \tabularnewline
98 &  0.9834 &  0.03321 &  0.01661 \tabularnewline
99 &  0.9674 &  0.06529 &  0.03265 \tabularnewline
100 &  0.9696 &  0.06073 &  0.03037 \tabularnewline
101 &  0.9745 &  0.05105 &  0.02552 \tabularnewline
102 &  0.9424 &  0.1153 &  0.05764 \tabularnewline
\hline
\end{tabular}
%Source: https://freestatistics.org/blog/index.php?pk=285319&T=5

[TABLE]
[ROW][C]Goldfeld-Quandt test for Heteroskedasticity[/C][/ROW]
[ROW][C]p-values[/C][C]Alternative Hypothesis[/C][/ROW]
[ROW][C]breakpoint index[/C][C]greater[/C][C]2-sided[/C][C]less[/C][/ROW]
[ROW][C]13[/C][C] 0.4266[/C][C] 0.8531[/C][C] 0.5734[/C][/ROW]
[ROW][C]14[/C][C] 0.3206[/C][C] 0.6412[/C][C] 0.6794[/C][/ROW]
[ROW][C]15[/C][C] 0.195[/C][C] 0.39[/C][C] 0.805[/C][/ROW]
[ROW][C]16[/C][C] 0.2518[/C][C] 0.5035[/C][C] 0.7482[/C][/ROW]
[ROW][C]17[/C][C] 0.2049[/C][C] 0.4098[/C][C] 0.7951[/C][/ROW]
[ROW][C]18[/C][C] 0.14[/C][C] 0.28[/C][C] 0.86[/C][/ROW]
[ROW][C]19[/C][C] 0.08841[/C][C] 0.1768[/C][C] 0.9116[/C][/ROW]
[ROW][C]20[/C][C] 0.09522[/C][C] 0.1904[/C][C] 0.9048[/C][/ROW]
[ROW][C]21[/C][C] 0.0757[/C][C] 0.1514[/C][C] 0.9243[/C][/ROW]
[ROW][C]22[/C][C] 0.06794[/C][C] 0.1359[/C][C] 0.9321[/C][/ROW]
[ROW][C]23[/C][C] 0.04602[/C][C] 0.09204[/C][C] 0.954[/C][/ROW]
[ROW][C]24[/C][C] 0.0332[/C][C] 0.06639[/C][C] 0.9668[/C][/ROW]
[ROW][C]25[/C][C] 0.02134[/C][C] 0.04268[/C][C] 0.9787[/C][/ROW]
[ROW][C]26[/C][C] 0.01578[/C][C] 0.03156[/C][C] 0.9842[/C][/ROW]
[ROW][C]27[/C][C] 0.01981[/C][C] 0.03962[/C][C] 0.9802[/C][/ROW]
[ROW][C]28[/C][C] 0.06169[/C][C] 0.1234[/C][C] 0.9383[/C][/ROW]
[ROW][C]29[/C][C] 0.07274[/C][C] 0.1455[/C][C] 0.9273[/C][/ROW]
[ROW][C]30[/C][C] 0.1289[/C][C] 0.2578[/C][C] 0.8711[/C][/ROW]
[ROW][C]31[/C][C] 0.3736[/C][C] 0.7473[/C][C] 0.6264[/C][/ROW]
[ROW][C]32[/C][C] 0.6066[/C][C] 0.7868[/C][C] 0.3934[/C][/ROW]
[ROW][C]33[/C][C] 0.5478[/C][C] 0.9044[/C][C] 0.4522[/C][/ROW]
[ROW][C]34[/C][C] 0.5993[/C][C] 0.8014[/C][C] 0.4007[/C][/ROW]
[ROW][C]35[/C][C] 0.8191[/C][C] 0.3618[/C][C] 0.1809[/C][/ROW]
[ROW][C]36[/C][C] 0.8014[/C][C] 0.3972[/C][C] 0.1986[/C][/ROW]
[ROW][C]37[/C][C] 0.7733[/C][C] 0.4535[/C][C] 0.2267[/C][/ROW]
[ROW][C]38[/C][C] 0.7497[/C][C] 0.5007[/C][C] 0.2503[/C][/ROW]
[ROW][C]39[/C][C] 0.7619[/C][C] 0.4763[/C][C] 0.2381[/C][/ROW]
[ROW][C]40[/C][C] 0.7327[/C][C] 0.5346[/C][C] 0.2673[/C][/ROW]
[ROW][C]41[/C][C] 0.684[/C][C] 0.632[/C][C] 0.316[/C][/ROW]
[ROW][C]42[/C][C] 0.6347[/C][C] 0.7306[/C][C] 0.3653[/C][/ROW]
[ROW][C]43[/C][C] 0.6245[/C][C] 0.7509[/C][C] 0.3755[/C][/ROW]
[ROW][C]44[/C][C] 0.6644[/C][C] 0.6711[/C][C] 0.3356[/C][/ROW]
[ROW][C]45[/C][C] 0.6717[/C][C] 0.6567[/C][C] 0.3283[/C][/ROW]
[ROW][C]46[/C][C] 0.7221[/C][C] 0.5557[/C][C] 0.2779[/C][/ROW]
[ROW][C]47[/C][C] 0.8083[/C][C] 0.3835[/C][C] 0.1917[/C][/ROW]
[ROW][C]48[/C][C] 0.7992[/C][C] 0.4017[/C][C] 0.2008[/C][/ROW]
[ROW][C]49[/C][C] 0.7986[/C][C] 0.4028[/C][C] 0.2014[/C][/ROW]
[ROW][C]50[/C][C] 0.8095[/C][C] 0.3809[/C][C] 0.1905[/C][/ROW]
[ROW][C]51[/C][C] 0.7752[/C][C] 0.4497[/C][C] 0.2248[/C][/ROW]
[ROW][C]52[/C][C] 0.74[/C][C] 0.5201[/C][C] 0.26[/C][/ROW]
[ROW][C]53[/C][C] 0.6928[/C][C] 0.6143[/C][C] 0.3072[/C][/ROW]
[ROW][C]54[/C][C] 0.6649[/C][C] 0.6702[/C][C] 0.3351[/C][/ROW]
[ROW][C]55[/C][C] 0.6437[/C][C] 0.7126[/C][C] 0.3563[/C][/ROW]
[ROW][C]56[/C][C] 0.6079[/C][C] 0.7841[/C][C] 0.3921[/C][/ROW]
[ROW][C]57[/C][C] 0.568[/C][C] 0.864[/C][C] 0.432[/C][/ROW]
[ROW][C]58[/C][C] 0.5689[/C][C] 0.8622[/C][C] 0.4311[/C][/ROW]
[ROW][C]59[/C][C] 0.6022[/C][C] 0.7957[/C][C] 0.3978[/C][/ROW]
[ROW][C]60[/C][C] 0.696[/C][C] 0.6079[/C][C] 0.304[/C][/ROW]
[ROW][C]61[/C][C] 0.7796[/C][C] 0.4408[/C][C] 0.2204[/C][/ROW]
[ROW][C]62[/C][C] 0.8263[/C][C] 0.3475[/C][C] 0.1737[/C][/ROW]
[ROW][C]63[/C][C] 0.8696[/C][C] 0.2607[/C][C] 0.1304[/C][/ROW]
[ROW][C]64[/C][C] 0.8784[/C][C] 0.2431[/C][C] 0.1216[/C][/ROW]
[ROW][C]65[/C][C] 0.9223[/C][C] 0.1555[/C][C] 0.07773[/C][/ROW]
[ROW][C]66[/C][C] 0.9045[/C][C] 0.191[/C][C] 0.09549[/C][/ROW]
[ROW][C]67[/C][C] 0.9024[/C][C] 0.1951[/C][C] 0.09755[/C][/ROW]
[ROW][C]68[/C][C] 0.8893[/C][C] 0.2215[/C][C] 0.1107[/C][/ROW]
[ROW][C]69[/C][C] 0.9074[/C][C] 0.1851[/C][C] 0.09257[/C][/ROW]
[ROW][C]70[/C][C] 0.8927[/C][C] 0.2147[/C][C] 0.1073[/C][/ROW]
[ROW][C]71[/C][C] 0.9502[/C][C] 0.09962[/C][C] 0.04981[/C][/ROW]
[ROW][C]72[/C][C] 0.9323[/C][C] 0.1353[/C][C] 0.06766[/C][/ROW]
[ROW][C]73[/C][C] 0.9975[/C][C] 0.005061[/C][C] 0.00253[/C][/ROW]
[ROW][C]74[/C][C] 0.9975[/C][C] 0.00491[/C][C] 0.002455[/C][/ROW]
[ROW][C]75[/C][C] 0.9969[/C][C] 0.006248[/C][C] 0.003124[/C][/ROW]
[ROW][C]76[/C][C] 0.9964[/C][C] 0.007122[/C][C] 0.003561[/C][/ROW]
[ROW][C]77[/C][C] 0.995[/C][C] 0.01008[/C][C] 0.005041[/C][/ROW]
[ROW][C]78[/C][C] 0.9929[/C][C] 0.01427[/C][C] 0.007137[/C][/ROW]
[ROW][C]79[/C][C] 0.9909[/C][C] 0.01814[/C][C] 0.009069[/C][/ROW]
[ROW][C]80[/C][C] 0.9865[/C][C] 0.02693[/C][C] 0.01347[/C][/ROW]
[ROW][C]81[/C][C] 0.9827[/C][C] 0.03462[/C][C] 0.01731[/C][/ROW]
[ROW][C]82[/C][C] 0.976[/C][C] 0.04797[/C][C] 0.02399[/C][/ROW]
[ROW][C]83[/C][C] 0.9812[/C][C] 0.03766[/C][C] 0.01883[/C][/ROW]
[ROW][C]84[/C][C] 0.975[/C][C] 0.05[/C][C] 0.025[/C][/ROW]
[ROW][C]85[/C][C] 0.9885[/C][C] 0.02306[/C][C] 0.01153[/C][/ROW]
[ROW][C]86[/C][C] 0.9825[/C][C] 0.03506[/C][C] 0.01753[/C][/ROW]
[ROW][C]87[/C][C] 0.9751[/C][C] 0.04986[/C][C] 0.02493[/C][/ROW]
[ROW][C]88[/C][C] 0.9653[/C][C] 0.06947[/C][C] 0.03474[/C][/ROW]
[ROW][C]89[/C][C] 0.9496[/C][C] 0.1008[/C][C] 0.05038[/C][/ROW]
[ROW][C]90[/C][C] 0.9336[/C][C] 0.1328[/C][C] 0.06639[/C][/ROW]
[ROW][C]91[/C][C] 0.9114[/C][C] 0.1772[/C][C] 0.08859[/C][/ROW]
[ROW][C]92[/C][C] 0.8902[/C][C] 0.2197[/C][C] 0.1098[/C][/ROW]
[ROW][C]93[/C][C] 0.8625[/C][C] 0.275[/C][C] 0.1375[/C][/ROW]
[ROW][C]94[/C][C] 0.8028[/C][C] 0.3944[/C][C] 0.1972[/C][/ROW]
[ROW][C]95[/C][C] 0.9074[/C][C] 0.1851[/C][C] 0.09256[/C][/ROW]
[ROW][C]96[/C][C] 0.9247[/C][C] 0.1505[/C][C] 0.07526[/C][/ROW]
[ROW][C]97[/C][C] 0.8999[/C][C] 0.2002[/C][C] 0.1001[/C][/ROW]
[ROW][C]98[/C][C] 0.9834[/C][C] 0.03321[/C][C] 0.01661[/C][/ROW]
[ROW][C]99[/C][C] 0.9674[/C][C] 0.06529[/C][C] 0.03265[/C][/ROW]
[ROW][C]100[/C][C] 0.9696[/C][C] 0.06073[/C][C] 0.03037[/C][/ROW]
[ROW][C]101[/C][C] 0.9745[/C][C] 0.05105[/C][C] 0.02552[/C][/ROW]
[ROW][C]102[/C][C] 0.9424[/C][C] 0.1153[/C][C] 0.05764[/C][/ROW]
[/TABLE]
Source: https://freestatistics.org/blog/index.php?pk=285319&T=5

Globally Unique Identifier (entire table): ba.freestatistics.org/blog/index.php?pk=285319&T=5

As an alternative you can also use a QR Code:  

The GUIDs for individual cells are displayed in the table below:

Goldfeld-Quandt test for Heteroskedasticity
p-valuesAlternative Hypothesis
breakpoint indexgreater2-sidedless
13 0.4266 0.8531 0.5734
14 0.3206 0.6412 0.6794
15 0.195 0.39 0.805
16 0.2518 0.5035 0.7482
17 0.2049 0.4098 0.7951
18 0.14 0.28 0.86
19 0.08841 0.1768 0.9116
20 0.09522 0.1904 0.9048
21 0.0757 0.1514 0.9243
22 0.06794 0.1359 0.9321
23 0.04602 0.09204 0.954
24 0.0332 0.06639 0.9668
25 0.02134 0.04268 0.9787
26 0.01578 0.03156 0.9842
27 0.01981 0.03962 0.9802
28 0.06169 0.1234 0.9383
29 0.07274 0.1455 0.9273
30 0.1289 0.2578 0.8711
31 0.3736 0.7473 0.6264
32 0.6066 0.7868 0.3934
33 0.5478 0.9044 0.4522
34 0.5993 0.8014 0.4007
35 0.8191 0.3618 0.1809
36 0.8014 0.3972 0.1986
37 0.7733 0.4535 0.2267
38 0.7497 0.5007 0.2503
39 0.7619 0.4763 0.2381
40 0.7327 0.5346 0.2673
41 0.684 0.632 0.316
42 0.6347 0.7306 0.3653
43 0.6245 0.7509 0.3755
44 0.6644 0.6711 0.3356
45 0.6717 0.6567 0.3283
46 0.7221 0.5557 0.2779
47 0.8083 0.3835 0.1917
48 0.7992 0.4017 0.2008
49 0.7986 0.4028 0.2014
50 0.8095 0.3809 0.1905
51 0.7752 0.4497 0.2248
52 0.74 0.5201 0.26
53 0.6928 0.6143 0.3072
54 0.6649 0.6702 0.3351
55 0.6437 0.7126 0.3563
56 0.6079 0.7841 0.3921
57 0.568 0.864 0.432
58 0.5689 0.8622 0.4311
59 0.6022 0.7957 0.3978
60 0.696 0.6079 0.304
61 0.7796 0.4408 0.2204
62 0.8263 0.3475 0.1737
63 0.8696 0.2607 0.1304
64 0.8784 0.2431 0.1216
65 0.9223 0.1555 0.07773
66 0.9045 0.191 0.09549
67 0.9024 0.1951 0.09755
68 0.8893 0.2215 0.1107
69 0.9074 0.1851 0.09257
70 0.8927 0.2147 0.1073
71 0.9502 0.09962 0.04981
72 0.9323 0.1353 0.06766
73 0.9975 0.005061 0.00253
74 0.9975 0.00491 0.002455
75 0.9969 0.006248 0.003124
76 0.9964 0.007122 0.003561
77 0.995 0.01008 0.005041
78 0.9929 0.01427 0.007137
79 0.9909 0.01814 0.009069
80 0.9865 0.02693 0.01347
81 0.9827 0.03462 0.01731
82 0.976 0.04797 0.02399
83 0.9812 0.03766 0.01883
84 0.975 0.05 0.025
85 0.9885 0.02306 0.01153
86 0.9825 0.03506 0.01753
87 0.9751 0.04986 0.02493
88 0.9653 0.06947 0.03474
89 0.9496 0.1008 0.05038
90 0.9336 0.1328 0.06639
91 0.9114 0.1772 0.08859
92 0.8902 0.2197 0.1098
93 0.8625 0.275 0.1375
94 0.8028 0.3944 0.1972
95 0.9074 0.1851 0.09256
96 0.9247 0.1505 0.07526
97 0.8999 0.2002 0.1001
98 0.9834 0.03321 0.01661
99 0.9674 0.06529 0.03265
100 0.9696 0.06073 0.03037
101 0.9745 0.05105 0.02552
102 0.9424 0.1153 0.05764


Meta Analysis of Goldfeld-Quandt test for Heteroskedasticity
Description# significant tests% significant testsOK/NOK
1% type I error level4 0.04444NOK
5% type I error level190.211111NOK
10% type I error level260.288889NOK

\begin{tabular}{lllllllll}
\hline
Meta Analysis of Goldfeld-Quandt test for Heteroskedasticity \tabularnewline
Description & # significant tests & % significant tests & OK/NOK \tabularnewline
1% type I error level & 4 &  0.04444 & NOK \tabularnewline
5% type I error level & 19 & 0.211111 & NOK \tabularnewline
10% type I error level & 26 & 0.288889 & NOK \tabularnewline
\hline
\end{tabular}
%Source: https://freestatistics.org/blog/index.php?pk=285319&T=6

[TABLE]
[ROW][C]Meta Analysis of Goldfeld-Quandt test for Heteroskedasticity[/C][/ROW]
[ROW][C]Description[/C][C]# significant tests[/C][C]% significant tests[/C][C]OK/NOK[/C][/ROW]
[ROW][C]1% type I error level[/C][C]4[/C][C] 0.04444[/C][C]NOK[/C][/ROW]
[ROW][C]5% type I error level[/C][C]19[/C][C]0.211111[/C][C]NOK[/C][/ROW]
[ROW][C]10% type I error level[/C][C]26[/C][C]0.288889[/C][C]NOK[/C][/ROW]
[/TABLE]
Source: https://freestatistics.org/blog/index.php?pk=285319&T=6

Globally Unique Identifier (entire table): ba.freestatistics.org/blog/index.php?pk=285319&T=6

As an alternative you can also use a QR Code:  

The GUIDs for individual cells are displayed in the table below:

Meta Analysis of Goldfeld-Quandt test for Heteroskedasticity
Description# significant tests% significant testsOK/NOK
1% type I error level4 0.04444NOK
5% type I error level190.211111NOK
10% type I error level260.288889NOK


Parameters (Session):
par1 = 1 ; par2 = Do not include Seasonal Dummies ; par3 = No Linear Trend ; par4 = 5 ; par5 = 0 ;
Parameters (R input):
par1 = 1 ; par2 = Do not include Seasonal Dummies ; par3 = No Linear Trend ; par4 = 5 ; par5 = 0 ;
R code (references can be found in the software module):
par5 <- '0'
par4 <- '10'
par3 <- 'No Linear Trend'
par2 <- 'Do not include Seasonal Dummies'
par1 <- '1'
library(lattice)
library(lmtest)
n25 <- 25 #minimum number of obs. for Goldfeld-Quandt test
mywarning <- ''
par1 <- as.numeric(par1)
if(is.na(par1)) {
par1 <- 1
mywarning = 'Warning: you did not specify the column number of the endogenous series! The first column was selected by default.'
}
if (par4=='') par4 <- 0
par4 <- as.numeric(par4)
if (par5=='') par5 <- 0
par5 <- as.numeric(par5)
x <- na.omit(t(y))
k <- length(x[1,])
n <- length(x[,1])
x1 <- cbind(x[,par1], x[,1:k!=par1])
mycolnames <- c(colnames(x)[par1], colnames(x)[1:k!=par1])
colnames(x1) <- mycolnames #colnames(x)[par1]
x <- x1
if (par3 == 'First Differences'){
(n <- n -1)
x2 <- array(0, dim=c(n,k), dimnames=list(1:n, paste('(1-B)',colnames(x),sep='')))
for (i in 1:n) {
for (j in 1:k) {
x2[i,j] <- x[i+1,j] - x[i,j]
}
}
x <- x2
}
if (par3 == 'Seasonal Differences (s=12)'){
(n <- n - 12)
x2 <- array(0, dim=c(n,k), dimnames=list(1:n, paste('(1-B12)',colnames(x),sep='')))
for (i in 1:n) {
for (j in 1:k) {
x2[i,j] <- x[i+12,j] - x[i,j]
}
}
x <- x2
}
if (par3 == 'First and Seasonal Differences (s=12)'){
(n <- n -1)
x2 <- array(0, dim=c(n,k), dimnames=list(1:n, paste('(1-B)',colnames(x),sep='')))
for (i in 1:n) {
for (j in 1:k) {
x2[i,j] <- x[i+1,j] - x[i,j]
}
}
x <- x2
(n <- n - 12)
x2 <- array(0, dim=c(n,k), dimnames=list(1:n, paste('(1-B12)',colnames(x),sep='')))
for (i in 1:n) {
for (j in 1:k) {
x2[i,j] <- x[i+12,j] - x[i,j]
}
}
x <- x2
}
if(par4 > 0) {
x2 <- array(0, dim=c(n-par4,par4), dimnames=list(1:(n-par4), paste(colnames(x)[par1],'(t-',1:par4,')',sep='')))
for (i in 1:(n-par4)) {
for (j in 1:par4) {
x2[i,j] <- x[i+par4-j,par1]
}
}
x <- cbind(x[(par4+1):n,], x2)
n <- n - par4
}
if(par5 > 0) {
x2 <- array(0, dim=c(n-par5*12,par5), dimnames=list(1:(n-par5*12), paste(colnames(x)[par1],'(t-',1:par5,'s)',sep='')))
for (i in 1:(n-par5*12)) {
for (j in 1:par5) {
x2[i,j] <- x[i+par5*12-j*12,par1]
}
}
x <- cbind(x[(par5*12+1):n,], x2)
n <- n - par5*12
}
if (par2 == 'Include Monthly Dummies'){
x2 <- array(0, dim=c(n,11), dimnames=list(1:n, paste('M', seq(1:11), sep ='')))
for (i in 1:11){
x2[seq(i,n,12),i] <- 1
}
x <- cbind(x, x2)
}
if (par2 == 'Include Quarterly Dummies'){
x2 <- array(0, dim=c(n,3), dimnames=list(1:n, paste('Q', seq(1:3), sep ='')))
for (i in 1:3){
x2[seq(i,n,4),i] <- 1
}
x <- cbind(x, x2)
}
(k <- length(x[n,]))
if (par3 == 'Linear Trend'){
x <- cbind(x, c(1:n))
colnames(x)[k+1] <- 't'
}
x
(k <- length(x[n,]))
head(x)
df <- as.data.frame(x)
(mylm <- lm(df))
(mysum <- summary(mylm))
if (n > n25) {
kp3 <- k + 3
nmkm3 <- n - k - 3
gqarr <- array(NA, dim=c(nmkm3-kp3+1,3))
numgqtests <- 0
numsignificant1 <- 0
numsignificant5 <- 0
numsignificant10 <- 0
for (mypoint in kp3:nmkm3) {
j <- 0
numgqtests <- numgqtests + 1
for (myalt in c('greater', 'two.sided', 'less')) {
j <- j + 1
gqarr[mypoint-kp3+1,j] <- gqtest(mylm, point=mypoint, alternative=myalt)$p.value
}
if (gqarr[mypoint-kp3+1,2] < 0.01) numsignificant1 <- numsignificant1 + 1
if (gqarr[mypoint-kp3+1,2] < 0.05) numsignificant5 <- numsignificant5 + 1
if (gqarr[mypoint-kp3+1,2] < 0.10) numsignificant10 <- numsignificant10 + 1
}
gqarr
}
bitmap(file='test0.png')
plot(x[,1], type='l', main='Actuals and Interpolation', ylab='value of Actuals and Interpolation (dots)', xlab='time or index')
points(x[,1]-mysum$resid)
grid()
dev.off()
bitmap(file='test1.png')
plot(mysum$resid, type='b', pch=19, main='Residuals', ylab='value of Residuals', xlab='time or index')
grid()
dev.off()
bitmap(file='test2.png')
hist(mysum$resid, main='Residual Histogram', xlab='values of Residuals')
grid()
dev.off()
bitmap(file='test3.png')
densityplot(~mysum$resid,col='black',main='Residual Density Plot', xlab='values of Residuals')
dev.off()
bitmap(file='test4.png')
qqnorm(mysum$resid, main='Residual Normal Q-Q Plot')
qqline(mysum$resid)
grid()
dev.off()
(myerror <- as.ts(mysum$resid))
bitmap(file='test5.png')
dum <- cbind(lag(myerror,k=1),myerror)
dum
dum1 <- dum[2:length(myerror),]
dum1
z <- as.data.frame(dum1)
z
plot(z,main=paste('Residual Lag plot, lowess, and regression line'), ylab='values of Residuals', xlab='lagged values of Residuals')
lines(lowess(z))
abline(lm(z))
grid()
dev.off()
bitmap(file='test6.png')
acf(mysum$resid, lag.max=length(mysum$resid)/2, main='Residual Autocorrelation Function')
grid()
dev.off()
bitmap(file='test7.png')
pacf(mysum$resid, lag.max=length(mysum$resid)/2, main='Residual Partial Autocorrelation Function')
grid()
dev.off()
bitmap(file='test8.png')
opar <- par(mfrow = c(2,2), oma = c(0, 0, 1.1, 0))
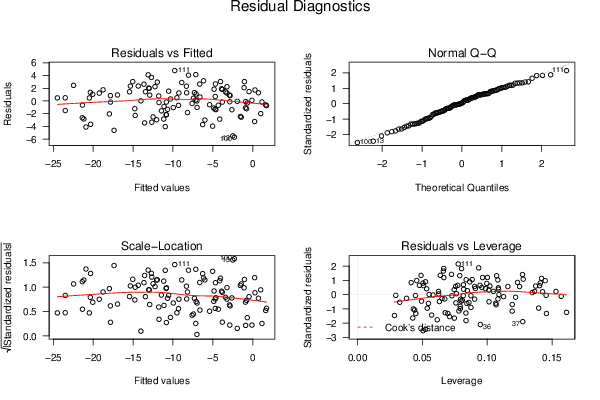
plot(mylm, las = 1, sub='Residual Diagnostics')
par(opar)
dev.off()
if (n > n25) {
bitmap(file='test9.png')
plot(kp3:nmkm3,gqarr[,2], main='Goldfeld-Quandt test',ylab='2-sided p-value',xlab='breakpoint')
grid()
dev.off()
}
load(file='createtable')
a<-table.start()
a<-table.row.start(a)
a<-table.element(a, 'Multiple Linear Regression - Estimated Regression Equation', 1, TRUE)
a<-table.row.end(a)
myeq <- colnames(x)[1]
myeq <- paste(myeq, '[t] = ', sep='')
for (i in 1:k){
if (mysum$coefficients[i,1] > 0) myeq <- paste(myeq, '+', '')
myeq <- paste(myeq, signif(mysum$coefficients[i,1],6), sep=' ')
if (rownames(mysum$coefficients)[i] != '(Intercept)') {
myeq <- paste(myeq, rownames(mysum$coefficients)[i], sep='')
if (rownames(mysum$coefficients)[i] != 't') myeq <- paste(myeq, '[t]', sep='')
}
}
myeq <- paste(myeq, ' + e[t]')
a<-table.row.start(a)
a<-table.element(a, myeq)
a<-table.row.end(a)
a<-table.row.start(a)
a<-table.element(a, mywarning)
a<-table.row.end(a)
a<-table.end(a)
table.save(a,file='mytable1.tab')
a<-table.start()
a<-table.row.start(a)
a<-table.element(a,hyperlink('ols1.htm','Multiple Linear Regression - Ordinary Least Squares',''), 6, TRUE)
a<-table.row.end(a)
a<-table.row.start(a)
a<-table.element(a,'Variable',header=TRUE)
a<-table.element(a,'Parameter',header=TRUE)
a<-table.element(a,'S.D.',header=TRUE)
a<-table.element(a,'T-STAT
H0: parameter = 0',header=TRUE)
a<-table.element(a,'2-tail p-value',header=TRUE)
a<-table.element(a,'1-tail p-value',header=TRUE)
a<-table.row.end(a)
for (i in 1:k){
a<-table.row.start(a)
a<-table.element(a,rownames(mysum$coefficients)[i],header=TRUE)
a<-table.element(a,formatC(signif(mysum$coefficients[i,1],5),format='g',flag='+'))
a<-table.element(a,formatC(signif(mysum$coefficients[i,2],5),format='g',flag=' '))
a<-table.element(a,formatC(signif(mysum$coefficients[i,3],4),format='e',flag='+'))
a<-table.element(a,formatC(signif(mysum$coefficients[i,4],4),format='g',flag=' '))
a<-table.element(a,formatC(signif(mysum$coefficients[i,4]/2,4),format='g',flag=' '))
a<-table.row.end(a)
}
a<-table.end(a)
table.save(a,file='mytable2.tab')
a<-table.start()
a<-table.row.start(a)
a<-table.element(a, 'Multiple Linear Regression - Regression Statistics', 2, TRUE)
a<-table.row.end(a)
a<-table.row.start(a)
a<-table.element(a, 'Multiple R',1,TRUE)
a<-table.element(a,formatC(signif(sqrt(mysum$r.squared),6),format='g',flag=' '))
a<-table.row.end(a)
a<-table.row.start(a)
a<-table.element(a, 'R-squared',1,TRUE)
a<-table.element(a,formatC(signif(mysum$r.squared,6),format='g',flag=' '))
a<-table.row.end(a)
a<-table.row.start(a)
a<-table.element(a, 'Adjusted R-squared',1,TRUE)
a<-table.element(a,formatC(signif(mysum$adj.r.squared,6),format='g',flag=' '))
a<-table.row.end(a)
a<-table.row.start(a)
a<-table.element(a, 'F-TEST (value)',1,TRUE)
a<-table.element(a,formatC(signif(mysum$fstatistic[1],6),format='g',flag=' '))
a<-table.row.end(a)
a<-table.row.start(a)
a<-table.element(a, 'F-TEST (DF numerator)',1,TRUE)
a<-table.element(a, signif(mysum$fstatistic[2],6))
a<-table.row.end(a)
a<-table.row.start(a)
a<-table.element(a, 'F-TEST (DF denominator)',1,TRUE)
a<-table.element(a, signif(mysum$fstatistic[3],6))
a<-table.row.end(a)
a<-table.row.start(a)
a<-table.element(a, 'p-value',1,TRUE)
a<-table.element(a,formatC(signif(1-pf(mysum$fstatistic[1],mysum$fstatistic[2],mysum$fstatistic[3]),6),format='g',flag=' '))
a<-table.row.end(a)
a<-table.row.start(a)
a<-table.element(a, 'Multiple Linear Regression - Residual Statistics', 2, TRUE)
a<-table.row.end(a)
a<-table.row.start(a)
a<-table.element(a, 'Residual Standard Deviation',1,TRUE)
a<-table.element(a,formatC(signif(mysum$sigma,6),format='g',flag=' '))
a<-table.row.end(a)
a<-table.row.start(a)
a<-table.element(a, 'Sum Squared Residuals',1,TRUE)
a<-table.element(a,formatC(signif(sum(myerror*myerror),6),format='g',flag=' '))
a<-table.row.end(a)
a<-table.end(a)
table.save(a,file='mytable3.tab')
if(n < 200) {
a<-table.start()
a<-table.row.start(a)
a<-table.element(a, 'Multiple Linear Regression - Actuals, Interpolation, and Residuals', 4, TRUE)
a<-table.row.end(a)
a<-table.row.start(a)
a<-table.element(a, 'Time or Index', 1, TRUE)
a<-table.element(a, 'Actuals', 1, TRUE)
a<-table.element(a, 'Interpolation
Forecast', 1, TRUE)
a<-table.element(a, 'Residuals
Prediction Error', 1, TRUE)
a<-table.row.end(a)
for (i in 1:n) {
a<-table.row.start(a)
a<-table.element(a,i, 1, TRUE)
a<-table.element(a,formatC(signif(x[i],6),format='g',flag=' '))
a<-table.element(a,formatC(signif(x[i]-mysum$resid[i],6),format='g',flag=' '))
a<-table.element(a,formatC(signif(mysum$resid[i],6),format='g',flag=' '))
a<-table.row.end(a)
}
a<-table.end(a)
table.save(a,file='mytable4.tab')
if (n > n25) {
a<-table.start()
a<-table.row.start(a)
a<-table.element(a,'Goldfeld-Quandt test for Heteroskedasticity',4,TRUE)
a<-table.row.end(a)
a<-table.row.start(a)
a<-table.element(a,'p-values',header=TRUE)
a<-table.element(a,'Alternative Hypothesis',3,header=TRUE)
a<-table.row.end(a)
a<-table.row.start(a)
a<-table.element(a,'breakpoint index',header=TRUE)
a<-table.element(a,'greater',header=TRUE)
a<-table.element(a,'2-sided',header=TRUE)
a<-table.element(a,'less',header=TRUE)
a<-table.row.end(a)
for (mypoint in kp3:nmkm3) {
a<-table.row.start(a)
a<-table.element(a,mypoint,header=TRUE)
a<-table.element(a,formatC(signif(gqarr[mypoint-kp3+1,1],6),format='g',flag=' '))
a<-table.element(a,formatC(signif(gqarr[mypoint-kp3+1,2],6),format='g',flag=' '))
a<-table.element(a,formatC(signif(gqarr[mypoint-kp3+1,3],6),format='g',flag=' '))
a<-table.row.end(a)
}
a<-table.end(a)
table.save(a,file='mytable5.tab')
a<-table.start()
a<-table.row.start(a)
a<-table.element(a,'Meta Analysis of Goldfeld-Quandt test for Heteroskedasticity',4,TRUE)
a<-table.row.end(a)
a<-table.row.start(a)
a<-table.element(a,'Description',header=TRUE)
a<-table.element(a,'# significant tests',header=TRUE)
a<-table.element(a,'% significant tests',header=TRUE)
a<-table.element(a,'OK/NOK',header=TRUE)
a<-table.row.end(a)
a<-table.row.start(a)
a<-table.element(a,'1% type I error level',header=TRUE)
a<-table.element(a,signif(numsignificant1,6))
a<-table.element(a,formatC(signif(numsignificant1/numgqtests,6),format='g',flag=' '))
if (numsignificant1/numgqtests < 0.01) dum <- 'OK' else dum <- 'NOK'
a<-table.element(a,dum)
a<-table.row.end(a)
a<-table.row.start(a)
a<-table.element(a,'5% type I error level',header=TRUE)
a<-table.element(a,signif(numsignificant5,6))
a<-table.element(a,signif(numsignificant5/numgqtests,6))
if (numsignificant5/numgqtests < 0.05) dum <- 'OK' else dum <- 'NOK'
a<-table.element(a,dum)
a<-table.row.end(a)
a<-table.row.start(a)
a<-table.element(a,'10% type I error level',header=TRUE)
a<-table.element(a,signif(numsignificant10,6))
a<-table.element(a,signif(numsignificant10/numgqtests,6))
if (numsignificant10/numgqtests < 0.1) dum <- 'OK' else dum <- 'NOK'
a<-table.element(a,dum)
a<-table.row.end(a)
a<-table.end(a)
table.save(a,file='mytable6.tab')
}
}