Free Statistics

of Irreproducible Research!

Author's title

Author*The author of this computation has been verified*
R Software Modulerwasp_multipleregression.wasp
Title produced by softwareMultiple Regression
Date of computationMon, 07 Dec 2015 10:13:07 +0000
Cite this page as followsStatistical Computations at FreeStatistics.org, Office for Research Development and Education, URL https://freestatistics.org/blog/index.php?v=date/2015/Dec/07/t1449483257zohezfxm4e8ypml.htm/, Retrieved Thu, 16 May 2024 12:32:33 +0000
Statistical Computations at FreeStatistics.org, Office for Research Development and Education, URL https://freestatistics.org/blog/index.php?pk=285338, Retrieved Thu, 16 May 2024 12:32:33 +0000
QR Codes:

Original text written by user:
IsPrivate?No (this computation is public)
User-defined keywords
Estimated Impact107
Family? (F = Feedback message, R = changed R code, M = changed R Module, P = changed Parameters, D = changed Data)
-       [Multiple Regression] [Multiple Regressi...] [2015-12-07 10:13:07] [6b467dc9c4b5eae42d9a994c430e0089] [Current]
Feedback Forum

Post a new message
Dataseries X:
189
229
249
289
260
431
660
777
915
613
485
277
244
296
319
370
313
556
831
960
1152
759
607
371
298
378
373
443
374
660
1004
1153
1388
904
715
441


Summary of computational transaction
Raw Inputview raw input (R code)
Raw Outputview raw output of R engine
Computing time4 seconds
R Server'Sir Maurice George Kendall' @ kendall.wessa.net

\begin{tabular}{lllllllll}
\hline
Summary of computational transaction \tabularnewline
Raw Input & view raw input (R code)  \tabularnewline
Raw Output & view raw output of R engine  \tabularnewline
Computing time & 4 seconds \tabularnewline
R Server & 'Sir Maurice George Kendall' @ kendall.wessa.net \tabularnewline
\hline
\end{tabular}
%Source: https://freestatistics.org/blog/index.php?pk=285338&T=0

[TABLE]
[ROW][C]Summary of computational transaction[/C][/ROW]
[ROW][C]Raw Input[/C][C]view raw input (R code) [/C][/ROW]
[ROW][C]Raw Output[/C][C]view raw output of R engine [/C][/ROW]
[ROW][C]Computing time[/C][C]4 seconds[/C][/ROW]
[ROW][C]R Server[/C][C]'Sir Maurice George Kendall' @ kendall.wessa.net[/C][/ROW]
[/TABLE]
Source: https://freestatistics.org/blog/index.php?pk=285338&T=0

Globally Unique Identifier (entire table): ba.freestatistics.org/blog/index.php?pk=285338&T=0

As an alternative you can also use a QR Code:  

The GUIDs for individual cells are displayed in the table below:

Summary of computational transaction
Raw Inputview raw input (R code)
Raw Outputview raw output of R engine
Computing time4 seconds
R Server'Sir Maurice George Kendall' @ kendall.wessa.net


Multiple Linear Regression - Estimated Regression Equation
Monthly_Sales[t] = + 133.25 -14.0312M1[t] + 33.7292M2[t] + 36.8229M3[t] + 80.9167M4[t] + 19.6771M5[t] + 243.437M6[t] + 516.531M7[t] + 638.625M8[t] + 817.385M9[t] + 414.812M10[t] + 248.906M11[t] + 9.57292t + e[t]
Warning: you did not specify the column number of the endogenous series! The first column was selected by default.

\begin{tabular}{lllllllll}
\hline
Multiple Linear Regression - Estimated Regression Equation \tabularnewline
Monthly_Sales[t] =  +  133.25 -14.0312M1[t] +  33.7292M2[t] +  36.8229M3[t] +  80.9167M4[t] +  19.6771M5[t] +  243.437M6[t] +  516.531M7[t] +  638.625M8[t] +  817.385M9[t] +  414.812M10[t] +  248.906M11[t] +  9.57292t  + e[t] \tabularnewline
Warning: you did not specify the column number of the endogenous series! The first column was selected by default. \tabularnewline
\hline
\end{tabular}
%Source: https://freestatistics.org/blog/index.php?pk=285338&T=1

[TABLE]
[ROW][C]Multiple Linear Regression - Estimated Regression Equation[/C][/ROW]
[ROW][C]Monthly_Sales[t] =  +  133.25 -14.0312M1[t] +  33.7292M2[t] +  36.8229M3[t] +  80.9167M4[t] +  19.6771M5[t] +  243.437M6[t] +  516.531M7[t] +  638.625M8[t] +  817.385M9[t] +  414.812M10[t] +  248.906M11[t] +  9.57292t  + e[t][/C][/ROW]
[ROW][C]Warning: you did not specify the column number of the endogenous series! The first column was selected by default.[/C][/ROW]
[/TABLE]
Source: https://freestatistics.org/blog/index.php?pk=285338&T=1

Globally Unique Identifier (entire table): ba.freestatistics.org/blog/index.php?pk=285338&T=1

As an alternative you can also use a QR Code:  

The GUIDs for individual cells are displayed in the table below:

Multiple Linear Regression - Estimated Regression Equation
Monthly_Sales[t] = + 133.25 -14.0312M1[t] + 33.7292M2[t] + 36.8229M3[t] + 80.9167M4[t] + 19.6771M5[t] + 243.437M6[t] + 516.531M7[t] + 638.625M8[t] + 817.385M9[t] + 414.812M10[t] + 248.906M11[t] + 9.57292t + e[t]
Warning: you did not specify the column number of the endogenous series! The first column was selected by default.


Multiple Linear Regression - Ordinary Least Squares
VariableParameterS.D.T-STATH0: parameter = 02-tail p-value1-tail p-value
(Intercept)+133.2 40.88+3.2600e+00 0.00345 0.001725
M1-14.03 48.43-2.8970e-01 0.7746 0.3873
M2+33.73 48.22+6.9950e-01 0.4912 0.2456
M3+36.82 48.03+7.6670e-01 0.4511 0.2255
M4+80.92 47.86+1.6910e+00 0.1044 0.05219
M5+19.68 47.7+4.1250e-01 0.6838 0.3419
M6+243.4 47.57+5.1170e+00 3.489e-05 1.745e-05
M7+516.5 47.46+1.0880e+01 1.512e-10 7.559e-11
M8+638.6 47.37+1.3480e+01 2.091e-12 1.046e-12
M9+817.4 47.3+1.7280e+01 1.137e-14 5.685e-15
M10+414.8 47.25+8.7800e+00 8.386e-09 4.193e-09
M11+248.9 47.22+5.2720e+00 2.383e-05 1.192e-05
t+9.573 0.9834+9.7340e+00 1.268e-09 6.339e-10

\begin{tabular}{lllllllll}
\hline
Multiple Linear Regression - Ordinary Least Squares \tabularnewline
Variable & Parameter & S.D. & T-STATH0: parameter = 0 & 2-tail p-value & 1-tail p-value \tabularnewline
(Intercept) & +133.2 &  40.88 & +3.2600e+00 &  0.00345 &  0.001725 \tabularnewline
M1 & -14.03 &  48.43 & -2.8970e-01 &  0.7746 &  0.3873 \tabularnewline
M2 & +33.73 &  48.22 & +6.9950e-01 &  0.4912 &  0.2456 \tabularnewline
M3 & +36.82 &  48.03 & +7.6670e-01 &  0.4511 &  0.2255 \tabularnewline
M4 & +80.92 &  47.86 & +1.6910e+00 &  0.1044 &  0.05219 \tabularnewline
M5 & +19.68 &  47.7 & +4.1250e-01 &  0.6838 &  0.3419 \tabularnewline
M6 & +243.4 &  47.57 & +5.1170e+00 &  3.489e-05 &  1.745e-05 \tabularnewline
M7 & +516.5 &  47.46 & +1.0880e+01 &  1.512e-10 &  7.559e-11 \tabularnewline
M8 & +638.6 &  47.37 & +1.3480e+01 &  2.091e-12 &  1.046e-12 \tabularnewline
M9 & +817.4 &  47.3 & +1.7280e+01 &  1.137e-14 &  5.685e-15 \tabularnewline
M10 & +414.8 &  47.25 & +8.7800e+00 &  8.386e-09 &  4.193e-09 \tabularnewline
M11 & +248.9 &  47.22 & +5.2720e+00 &  2.383e-05 &  1.192e-05 \tabularnewline
t & +9.573 &  0.9834 & +9.7340e+00 &  1.268e-09 &  6.339e-10 \tabularnewline
\hline
\end{tabular}
%Source: https://freestatistics.org/blog/index.php?pk=285338&T=2

[TABLE]
[ROW][C]Multiple Linear Regression - Ordinary Least Squares[/C][/ROW]
[ROW][C]Variable[/C][C]Parameter[/C][C]S.D.[/C][C]T-STATH0: parameter = 0[/C][C]2-tail p-value[/C][C]1-tail p-value[/C][/ROW]
[ROW][C](Intercept)[/C][C]+133.2[/C][C] 40.88[/C][C]+3.2600e+00[/C][C] 0.00345[/C][C] 0.001725[/C][/ROW]
[ROW][C]M1[/C][C]-14.03[/C][C] 48.43[/C][C]-2.8970e-01[/C][C] 0.7746[/C][C] 0.3873[/C][/ROW]
[ROW][C]M2[/C][C]+33.73[/C][C] 48.22[/C][C]+6.9950e-01[/C][C] 0.4912[/C][C] 0.2456[/C][/ROW]
[ROW][C]M3[/C][C]+36.82[/C][C] 48.03[/C][C]+7.6670e-01[/C][C] 0.4511[/C][C] 0.2255[/C][/ROW]
[ROW][C]M4[/C][C]+80.92[/C][C] 47.86[/C][C]+1.6910e+00[/C][C] 0.1044[/C][C] 0.05219[/C][/ROW]
[ROW][C]M5[/C][C]+19.68[/C][C] 47.7[/C][C]+4.1250e-01[/C][C] 0.6838[/C][C] 0.3419[/C][/ROW]
[ROW][C]M6[/C][C]+243.4[/C][C] 47.57[/C][C]+5.1170e+00[/C][C] 3.489e-05[/C][C] 1.745e-05[/C][/ROW]
[ROW][C]M7[/C][C]+516.5[/C][C] 47.46[/C][C]+1.0880e+01[/C][C] 1.512e-10[/C][C] 7.559e-11[/C][/ROW]
[ROW][C]M8[/C][C]+638.6[/C][C] 47.37[/C][C]+1.3480e+01[/C][C] 2.091e-12[/C][C] 1.046e-12[/C][/ROW]
[ROW][C]M9[/C][C]+817.4[/C][C] 47.3[/C][C]+1.7280e+01[/C][C] 1.137e-14[/C][C] 5.685e-15[/C][/ROW]
[ROW][C]M10[/C][C]+414.8[/C][C] 47.25[/C][C]+8.7800e+00[/C][C] 8.386e-09[/C][C] 4.193e-09[/C][/ROW]
[ROW][C]M11[/C][C]+248.9[/C][C] 47.22[/C][C]+5.2720e+00[/C][C] 2.383e-05[/C][C] 1.192e-05[/C][/ROW]
[ROW][C]t[/C][C]+9.573[/C][C] 0.9834[/C][C]+9.7340e+00[/C][C] 1.268e-09[/C][C] 6.339e-10[/C][/ROW]
[/TABLE]
Source: https://freestatistics.org/blog/index.php?pk=285338&T=2

Globally Unique Identifier (entire table): ba.freestatistics.org/blog/index.php?pk=285338&T=2

As an alternative you can also use a QR Code:  

The GUIDs for individual cells are displayed in the table below:

Multiple Linear Regression - Ordinary Least Squares
VariableParameterS.D.T-STATH0: parameter = 02-tail p-value1-tail p-value
(Intercept)+133.2 40.88+3.2600e+00 0.00345 0.001725
M1-14.03 48.43-2.8970e-01 0.7746 0.3873
M2+33.73 48.22+6.9950e-01 0.4912 0.2456
M3+36.82 48.03+7.6670e-01 0.4511 0.2255
M4+80.92 47.86+1.6910e+00 0.1044 0.05219
M5+19.68 47.7+4.1250e-01 0.6838 0.3419
M6+243.4 47.57+5.1170e+00 3.489e-05 1.745e-05
M7+516.5 47.46+1.0880e+01 1.512e-10 7.559e-11
M8+638.6 47.37+1.3480e+01 2.091e-12 1.046e-12
M9+817.4 47.3+1.7280e+01 1.137e-14 5.685e-15
M10+414.8 47.25+8.7800e+00 8.386e-09 4.193e-09
M11+248.9 47.22+5.2720e+00 2.383e-05 1.192e-05
t+9.573 0.9834+9.7340e+00 1.268e-09 6.339e-10


Multiple Linear Regression - Regression Statistics
Multiple R 0.9885
R-squared 0.9772
Adjusted R-squared 0.9653
F-TEST (value) 82.04
F-TEST (DF numerator)12
F-TEST (DF denominator)23
p-value 6.661e-16
Multiple Linear Regression - Residual Statistics
Residual Standard Deviation 57.81
Sum Squared Residuals 7.688e+04

\begin{tabular}{lllllllll}
\hline
Multiple Linear Regression - Regression Statistics \tabularnewline
Multiple R &  0.9885 \tabularnewline
R-squared &  0.9772 \tabularnewline
Adjusted R-squared &  0.9653 \tabularnewline
F-TEST (value) &  82.04 \tabularnewline
F-TEST (DF numerator) & 12 \tabularnewline
F-TEST (DF denominator) & 23 \tabularnewline
p-value &  6.661e-16 \tabularnewline
Multiple Linear Regression - Residual Statistics \tabularnewline
Residual Standard Deviation &  57.81 \tabularnewline
Sum Squared Residuals &  7.688e+04 \tabularnewline
\hline
\end{tabular}
%Source: https://freestatistics.org/blog/index.php?pk=285338&T=3

[TABLE]
[ROW][C]Multiple Linear Regression - Regression Statistics[/C][/ROW]
[ROW][C]Multiple R[/C][C] 0.9885[/C][/ROW]
[ROW][C]R-squared[/C][C] 0.9772[/C][/ROW]
[ROW][C]Adjusted R-squared[/C][C] 0.9653[/C][/ROW]
[ROW][C]F-TEST (value)[/C][C] 82.04[/C][/ROW]
[ROW][C]F-TEST (DF numerator)[/C][C]12[/C][/ROW]
[ROW][C]F-TEST (DF denominator)[/C][C]23[/C][/ROW]
[ROW][C]p-value[/C][C] 6.661e-16[/C][/ROW]
[ROW][C]Multiple Linear Regression - Residual Statistics[/C][/ROW]
[ROW][C]Residual Standard Deviation[/C][C] 57.81[/C][/ROW]
[ROW][C]Sum Squared Residuals[/C][C] 7.688e+04[/C][/ROW]
[/TABLE]
Source: https://freestatistics.org/blog/index.php?pk=285338&T=3

Globally Unique Identifier (entire table): ba.freestatistics.org/blog/index.php?pk=285338&T=3

As an alternative you can also use a QR Code:  

The GUIDs for individual cells are displayed in the table below:

Multiple Linear Regression - Regression Statistics
Multiple R 0.9885
R-squared 0.9772
Adjusted R-squared 0.9653
F-TEST (value) 82.04
F-TEST (DF numerator)12
F-TEST (DF denominator)23
p-value 6.661e-16
Multiple Linear Regression - Residual Statistics
Residual Standard Deviation 57.81
Sum Squared Residuals 7.688e+04


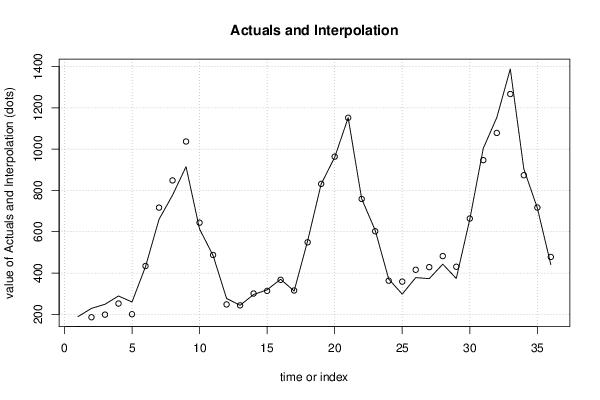
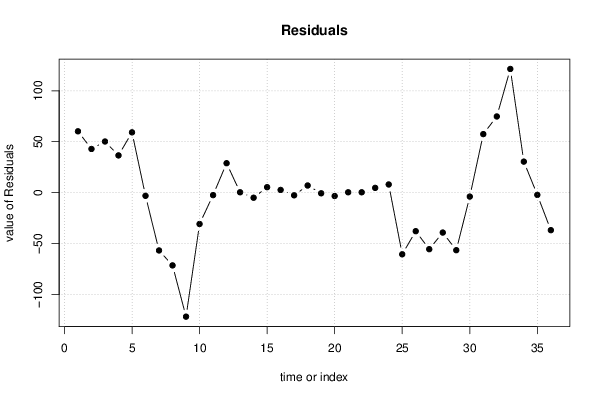
Multiple Linear Regression - Actuals, Interpolation, and Residuals
Time or IndexActualsInterpolationForecastResidualsPrediction Error
1 189 128.8 60.21
2 229 186.1 42.88
3 249 198.8 50.21
4 289 252.5 36.54
5 260 200.8 59.21
6 431 434.1-3.125
7 660 716.8-56.79
8 777 848.5-71.46
9 915 1037-121.8
10 613 643.8-30.79
11 485 487.5-2.458
12 277 248.1 28.88
13 244 243.7 0.3333
14 296 301-5
15 319 313.7 5.333
16 370 367.3 2.667
17 313 315.7-2.667
18 556 549 7
19 831 831.7-0.6667
20 960 963.3-3.333
21 1152 1152 0.3333
22 759 758.7 0.3333
23 607 602.3 4.667
24 371 363 8
25 298 358.5-60.54
26 378 415.9-37.88
27 373 428.5-55.54
28 443 482.2-39.21
29 374 430.5-56.54
30 660 663.9-3.875
31 1004 946.5 57.46
32 1153 1078 74.79
33 1388 1267 121.5
34 904 873.5 30.46
35 715 717.2-2.208
36 441 477.9-36.88

\begin{tabular}{lllllllll}
\hline
Multiple Linear Regression - Actuals, Interpolation, and Residuals \tabularnewline
Time or Index & Actuals & InterpolationForecast & ResidualsPrediction Error \tabularnewline
1 &  189 &  128.8 &  60.21 \tabularnewline
2 &  229 &  186.1 &  42.88 \tabularnewline
3 &  249 &  198.8 &  50.21 \tabularnewline
4 &  289 &  252.5 &  36.54 \tabularnewline
5 &  260 &  200.8 &  59.21 \tabularnewline
6 &  431 &  434.1 & -3.125 \tabularnewline
7 &  660 &  716.8 & -56.79 \tabularnewline
8 &  777 &  848.5 & -71.46 \tabularnewline
9 &  915 &  1037 & -121.8 \tabularnewline
10 &  613 &  643.8 & -30.79 \tabularnewline
11 &  485 &  487.5 & -2.458 \tabularnewline
12 &  277 &  248.1 &  28.88 \tabularnewline
13 &  244 &  243.7 &  0.3333 \tabularnewline
14 &  296 &  301 & -5 \tabularnewline
15 &  319 &  313.7 &  5.333 \tabularnewline
16 &  370 &  367.3 &  2.667 \tabularnewline
17 &  313 &  315.7 & -2.667 \tabularnewline
18 &  556 &  549 &  7 \tabularnewline
19 &  831 &  831.7 & -0.6667 \tabularnewline
20 &  960 &  963.3 & -3.333 \tabularnewline
21 &  1152 &  1152 &  0.3333 \tabularnewline
22 &  759 &  758.7 &  0.3333 \tabularnewline
23 &  607 &  602.3 &  4.667 \tabularnewline
24 &  371 &  363 &  8 \tabularnewline
25 &  298 &  358.5 & -60.54 \tabularnewline
26 &  378 &  415.9 & -37.88 \tabularnewline
27 &  373 &  428.5 & -55.54 \tabularnewline
28 &  443 &  482.2 & -39.21 \tabularnewline
29 &  374 &  430.5 & -56.54 \tabularnewline
30 &  660 &  663.9 & -3.875 \tabularnewline
31 &  1004 &  946.5 &  57.46 \tabularnewline
32 &  1153 &  1078 &  74.79 \tabularnewline
33 &  1388 &  1267 &  121.5 \tabularnewline
34 &  904 &  873.5 &  30.46 \tabularnewline
35 &  715 &  717.2 & -2.208 \tabularnewline
36 &  441 &  477.9 & -36.88 \tabularnewline
\hline
\end{tabular}
%Source: https://freestatistics.org/blog/index.php?pk=285338&T=4

[TABLE]
[ROW][C]Multiple Linear Regression - Actuals, Interpolation, and Residuals[/C][/ROW]
[ROW][C]Time or Index[/C][C]Actuals[/C][C]InterpolationForecast[/C][C]ResidualsPrediction Error[/C][/ROW]
[ROW][C]1[/C][C] 189[/C][C] 128.8[/C][C] 60.21[/C][/ROW]
[ROW][C]2[/C][C] 229[/C][C] 186.1[/C][C] 42.88[/C][/ROW]
[ROW][C]3[/C][C] 249[/C][C] 198.8[/C][C] 50.21[/C][/ROW]
[ROW][C]4[/C][C] 289[/C][C] 252.5[/C][C] 36.54[/C][/ROW]
[ROW][C]5[/C][C] 260[/C][C] 200.8[/C][C] 59.21[/C][/ROW]
[ROW][C]6[/C][C] 431[/C][C] 434.1[/C][C]-3.125[/C][/ROW]
[ROW][C]7[/C][C] 660[/C][C] 716.8[/C][C]-56.79[/C][/ROW]
[ROW][C]8[/C][C] 777[/C][C] 848.5[/C][C]-71.46[/C][/ROW]
[ROW][C]9[/C][C] 915[/C][C] 1037[/C][C]-121.8[/C][/ROW]
[ROW][C]10[/C][C] 613[/C][C] 643.8[/C][C]-30.79[/C][/ROW]
[ROW][C]11[/C][C] 485[/C][C] 487.5[/C][C]-2.458[/C][/ROW]
[ROW][C]12[/C][C] 277[/C][C] 248.1[/C][C] 28.88[/C][/ROW]
[ROW][C]13[/C][C] 244[/C][C] 243.7[/C][C] 0.3333[/C][/ROW]
[ROW][C]14[/C][C] 296[/C][C] 301[/C][C]-5[/C][/ROW]
[ROW][C]15[/C][C] 319[/C][C] 313.7[/C][C] 5.333[/C][/ROW]
[ROW][C]16[/C][C] 370[/C][C] 367.3[/C][C] 2.667[/C][/ROW]
[ROW][C]17[/C][C] 313[/C][C] 315.7[/C][C]-2.667[/C][/ROW]
[ROW][C]18[/C][C] 556[/C][C] 549[/C][C] 7[/C][/ROW]
[ROW][C]19[/C][C] 831[/C][C] 831.7[/C][C]-0.6667[/C][/ROW]
[ROW][C]20[/C][C] 960[/C][C] 963.3[/C][C]-3.333[/C][/ROW]
[ROW][C]21[/C][C] 1152[/C][C] 1152[/C][C] 0.3333[/C][/ROW]
[ROW][C]22[/C][C] 759[/C][C] 758.7[/C][C] 0.3333[/C][/ROW]
[ROW][C]23[/C][C] 607[/C][C] 602.3[/C][C] 4.667[/C][/ROW]
[ROW][C]24[/C][C] 371[/C][C] 363[/C][C] 8[/C][/ROW]
[ROW][C]25[/C][C] 298[/C][C] 358.5[/C][C]-60.54[/C][/ROW]
[ROW][C]26[/C][C] 378[/C][C] 415.9[/C][C]-37.88[/C][/ROW]
[ROW][C]27[/C][C] 373[/C][C] 428.5[/C][C]-55.54[/C][/ROW]
[ROW][C]28[/C][C] 443[/C][C] 482.2[/C][C]-39.21[/C][/ROW]
[ROW][C]29[/C][C] 374[/C][C] 430.5[/C][C]-56.54[/C][/ROW]
[ROW][C]30[/C][C] 660[/C][C] 663.9[/C][C]-3.875[/C][/ROW]
[ROW][C]31[/C][C] 1004[/C][C] 946.5[/C][C] 57.46[/C][/ROW]
[ROW][C]32[/C][C] 1153[/C][C] 1078[/C][C] 74.79[/C][/ROW]
[ROW][C]33[/C][C] 1388[/C][C] 1267[/C][C] 121.5[/C][/ROW]
[ROW][C]34[/C][C] 904[/C][C] 873.5[/C][C] 30.46[/C][/ROW]
[ROW][C]35[/C][C] 715[/C][C] 717.2[/C][C]-2.208[/C][/ROW]
[ROW][C]36[/C][C] 441[/C][C] 477.9[/C][C]-36.88[/C][/ROW]
[/TABLE]
Source: https://freestatistics.org/blog/index.php?pk=285338&T=4

Globally Unique Identifier (entire table): ba.freestatistics.org/blog/index.php?pk=285338&T=4

As an alternative you can also use a QR Code:  

The GUIDs for individual cells are displayed in the table below:

Multiple Linear Regression - Actuals, Interpolation, and Residuals
Time or IndexActualsInterpolationForecastResidualsPrediction Error
1 189 128.8 60.21
2 229 186.1 42.88
3 249 198.8 50.21
4 289 252.5 36.54
5 260 200.8 59.21
6 431 434.1-3.125
7 660 716.8-56.79
8 777 848.5-71.46
9 915 1037-121.8
10 613 643.8-30.79
11 485 487.5-2.458
12 277 248.1 28.88
13 244 243.7 0.3333
14 296 301-5
15 319 313.7 5.333
16 370 367.3 2.667
17 313 315.7-2.667
18 556 549 7
19 831 831.7-0.6667
20 960 963.3-3.333
21 1152 1152 0.3333
22 759 758.7 0.3333
23 607 602.3 4.667
24 371 363 8
25 298 358.5-60.54
26 378 415.9-37.88
27 373 428.5-55.54
28 443 482.2-39.21
29 374 430.5-56.54
30 660 663.9-3.875
31 1004 946.5 57.46
32 1153 1078 74.79
33 1388 1267 121.5
34 904 873.5 30.46
35 715 717.2-2.208
36 441 477.9-36.88


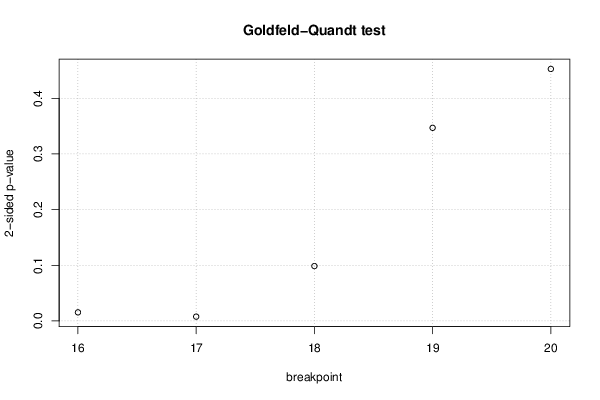
Goldfeld-Quandt test for Heteroskedasticity
p-valuesAlternative Hypothesis
breakpoint indexgreater2-sidedless
16 0.007695 0.01539 0.9923
17 0.00384 0.00768 0.9962
18 0.04926 0.09852 0.9507
19 0.1735 0.3469 0.8265
20 0.2264 0.4527 0.7736

\begin{tabular}{lllllllll}
\hline
Goldfeld-Quandt test for Heteroskedasticity \tabularnewline
p-values & Alternative Hypothesis \tabularnewline
breakpoint index & greater & 2-sided & less \tabularnewline
16 &  0.007695 &  0.01539 &  0.9923 \tabularnewline
17 &  0.00384 &  0.00768 &  0.9962 \tabularnewline
18 &  0.04926 &  0.09852 &  0.9507 \tabularnewline
19 &  0.1735 &  0.3469 &  0.8265 \tabularnewline
20 &  0.2264 &  0.4527 &  0.7736 \tabularnewline
\hline
\end{tabular}
%Source: https://freestatistics.org/blog/index.php?pk=285338&T=5

[TABLE]
[ROW][C]Goldfeld-Quandt test for Heteroskedasticity[/C][/ROW]
[ROW][C]p-values[/C][C]Alternative Hypothesis[/C][/ROW]
[ROW][C]breakpoint index[/C][C]greater[/C][C]2-sided[/C][C]less[/C][/ROW]
[ROW][C]16[/C][C] 0.007695[/C][C] 0.01539[/C][C] 0.9923[/C][/ROW]
[ROW][C]17[/C][C] 0.00384[/C][C] 0.00768[/C][C] 0.9962[/C][/ROW]
[ROW][C]18[/C][C] 0.04926[/C][C] 0.09852[/C][C] 0.9507[/C][/ROW]
[ROW][C]19[/C][C] 0.1735[/C][C] 0.3469[/C][C] 0.8265[/C][/ROW]
[ROW][C]20[/C][C] 0.2264[/C][C] 0.4527[/C][C] 0.7736[/C][/ROW]
[/TABLE]
Source: https://freestatistics.org/blog/index.php?pk=285338&T=5

Globally Unique Identifier (entire table): ba.freestatistics.org/blog/index.php?pk=285338&T=5

As an alternative you can also use a QR Code:  

The GUIDs for individual cells are displayed in the table below:

Goldfeld-Quandt test for Heteroskedasticity
p-valuesAlternative Hypothesis
breakpoint indexgreater2-sidedless
16 0.007695 0.01539 0.9923
17 0.00384 0.00768 0.9962
18 0.04926 0.09852 0.9507
19 0.1735 0.3469 0.8265
20 0.2264 0.4527 0.7736


Meta Analysis of Goldfeld-Quandt test for Heteroskedasticity
Description# significant tests% significant testsOK/NOK
1% type I error level1 0.2NOK
5% type I error level20.4NOK
10% type I error level30.6NOK

\begin{tabular}{lllllllll}
\hline
Meta Analysis of Goldfeld-Quandt test for Heteroskedasticity \tabularnewline
Description & # significant tests & % significant tests & OK/NOK \tabularnewline
1% type I error level & 1 &  0.2 & NOK \tabularnewline
5% type I error level & 2 & 0.4 & NOK \tabularnewline
10% type I error level & 3 & 0.6 & NOK \tabularnewline
\hline
\end{tabular}
%Source: https://freestatistics.org/blog/index.php?pk=285338&T=6

[TABLE]
[ROW][C]Meta Analysis of Goldfeld-Quandt test for Heteroskedasticity[/C][/ROW]
[ROW][C]Description[/C][C]# significant tests[/C][C]% significant tests[/C][C]OK/NOK[/C][/ROW]
[ROW][C]1% type I error level[/C][C]1[/C][C] 0.2[/C][C]NOK[/C][/ROW]
[ROW][C]5% type I error level[/C][C]2[/C][C]0.4[/C][C]NOK[/C][/ROW]
[ROW][C]10% type I error level[/C][C]3[/C][C]0.6[/C][C]NOK[/C][/ROW]
[/TABLE]
Source: https://freestatistics.org/blog/index.php?pk=285338&T=6

Globally Unique Identifier (entire table): ba.freestatistics.org/blog/index.php?pk=285338&T=6

As an alternative you can also use a QR Code:  

The GUIDs for individual cells are displayed in the table below:

Meta Analysis of Goldfeld-Quandt test for Heteroskedasticity
Description# significant tests% significant testsOK/NOK
1% type I error level1 0.2NOK
5% type I error level20.4NOK
10% type I error level30.6NOK


Parameters (Session):
par2 = Include Monthly Dummies ; par3 = Linear Trend ;
Parameters (R input):
par1 = ; par2 = Include Monthly Dummies ; par3 = Linear Trend ; par4 = ; par5 = ;
R code (references can be found in the software module):
library(lattice)
library(lmtest)
n25 <- 25 #minimum number of obs. for Goldfeld-Quandt test
mywarning <- ''
par1 <- as.numeric(par1)
if(is.na(par1)) {
par1 <- 1
mywarning = 'Warning: you did not specify the column number of the endogenous series! The first column was selected by default.'
}
if (par4=='') par4 <- 0
par4 <- as.numeric(par4)
if (par5=='') par5 <- 0
par5 <- as.numeric(par5)
x <- na.omit(t(y))
k <- length(x[1,])
n <- length(x[,1])
x1 <- cbind(x[,par1], x[,1:k!=par1])
mycolnames <- c(colnames(x)[par1], colnames(x)[1:k!=par1])
colnames(x1) <- mycolnames #colnames(x)[par1]
x <- x1
if (par3 == 'First Differences'){
(n <- n -1)
x2 <- array(0, dim=c(n,k), dimnames=list(1:n, paste('(1-B)',colnames(x),sep='')))
for (i in 1:n) {
for (j in 1:k) {
x2[i,j] <- x[i+1,j] - x[i,j]
}
}
x <- x2
}
if (par3 == 'Seasonal Differences (s=12)'){
(n <- n - 12)
x2 <- array(0, dim=c(n,k), dimnames=list(1:n, paste('(1-B12)',colnames(x),sep='')))
for (i in 1:n) {
for (j in 1:k) {
x2[i,j] <- x[i+12,j] - x[i,j]
}
}
x <- x2
}
if (par3 == 'First and Seasonal Differences (s=12)'){
(n <- n -1)
x2 <- array(0, dim=c(n,k), dimnames=list(1:n, paste('(1-B)',colnames(x),sep='')))
for (i in 1:n) {
for (j in 1:k) {
x2[i,j] <- x[i+1,j] - x[i,j]
}
}
x <- x2
(n <- n - 12)
x2 <- array(0, dim=c(n,k), dimnames=list(1:n, paste('(1-B12)',colnames(x),sep='')))
for (i in 1:n) {
for (j in 1:k) {
x2[i,j] <- x[i+12,j] - x[i,j]
}
}
x <- x2
}
if(par4 > 0) {
x2 <- array(0, dim=c(n-par4,par4), dimnames=list(1:(n-par4), paste(colnames(x)[par1],'(t-',1:par4,')',sep='')))
for (i in 1:(n-par4)) {
for (j in 1:par4) {
x2[i,j] <- x[i+par4-j,par1]
}
}
x <- cbind(x[(par4+1):n,], x2)
n <- n - par4
}
if(par5 > 0) {
x2 <- array(0, dim=c(n-par5*12,par5), dimnames=list(1:(n-par5*12), paste(colnames(x)[par1],'(t-',1:par5,'s)',sep='')))
for (i in 1:(n-par5*12)) {
for (j in 1:par5) {
x2[i,j] <- x[i+par5*12-j*12,par1]
}
}
x <- cbind(x[(par5*12+1):n,], x2)
n <- n - par5*12
}
if (par2 == 'Include Monthly Dummies'){
x2 <- array(0, dim=c(n,11), dimnames=list(1:n, paste('M', seq(1:11), sep ='')))
for (i in 1:11){
x2[seq(i,n,12),i] <- 1
}
x <- cbind(x, x2)
}
if (par2 == 'Include Quarterly Dummies'){
x2 <- array(0, dim=c(n,3), dimnames=list(1:n, paste('Q', seq(1:3), sep ='')))
for (i in 1:3){
x2[seq(i,n,4),i] <- 1
}
x <- cbind(x, x2)
}
(k <- length(x[n,]))
if (par3 == 'Linear Trend'){
x <- cbind(x, c(1:n))
colnames(x)[k+1] <- 't'
}
x
(k <- length(x[n,]))
head(x)
df <- as.data.frame(x)
(mylm <- lm(df))
(mysum <- summary(mylm))
if (n > n25) {
kp3 <- k + 3
nmkm3 <- n - k - 3
gqarr <- array(NA, dim=c(nmkm3-kp3+1,3))
numgqtests <- 0
numsignificant1 <- 0
numsignificant5 <- 0
numsignificant10 <- 0
for (mypoint in kp3:nmkm3) {
j <- 0
numgqtests <- numgqtests + 1
for (myalt in c('greater', 'two.sided', 'less')) {
j <- j + 1
gqarr[mypoint-kp3+1,j] <- gqtest(mylm, point=mypoint, alternative=myalt)$p.value
}
if (gqarr[mypoint-kp3+1,2] < 0.01) numsignificant1 <- numsignificant1 + 1
if (gqarr[mypoint-kp3+1,2] < 0.05) numsignificant5 <- numsignificant5 + 1
if (gqarr[mypoint-kp3+1,2] < 0.10) numsignificant10 <- numsignificant10 + 1
}
gqarr
}
bitmap(file='test0.png')
plot(x[,1], type='l', main='Actuals and Interpolation', ylab='value of Actuals and Interpolation (dots)', xlab='time or index')
points(x[,1]-mysum$resid)
grid()
dev.off()
bitmap(file='test1.png')
plot(mysum$resid, type='b', pch=19, main='Residuals', ylab='value of Residuals', xlab='time or index')
grid()
dev.off()
bitmap(file='test2.png')
hist(mysum$resid, main='Residual Histogram', xlab='values of Residuals')
grid()
dev.off()
bitmap(file='test3.png')
densityplot(~mysum$resid,col='black',main='Residual Density Plot', xlab='values of Residuals')
dev.off()
bitmap(file='test4.png')
qqnorm(mysum$resid, main='Residual Normal Q-Q Plot')
qqline(mysum$resid)
grid()
dev.off()
(myerror <- as.ts(mysum$resid))
bitmap(file='test5.png')
dum <- cbind(lag(myerror,k=1),myerror)
dum
dum1 <- dum[2:length(myerror),]
dum1
z <- as.data.frame(dum1)
z
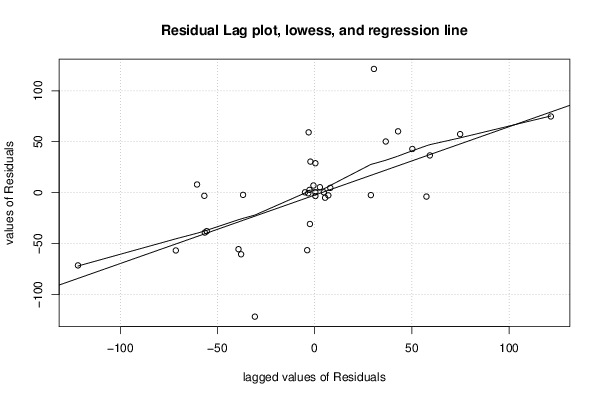
plot(z,main=paste('Residual Lag plot, lowess, and regression line'), ylab='values of Residuals', xlab='lagged values of Residuals')
lines(lowess(z))
abline(lm(z))
grid()
dev.off()
bitmap(file='test6.png')
acf(mysum$resid, lag.max=length(mysum$resid)/2, main='Residual Autocorrelation Function')
grid()
dev.off()
bitmap(file='test7.png')
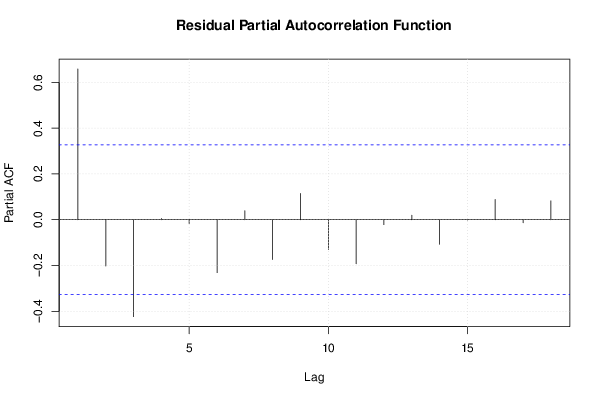
pacf(mysum$resid, lag.max=length(mysum$resid)/2, main='Residual Partial Autocorrelation Function')
grid()
dev.off()
bitmap(file='test8.png')
opar <- par(mfrow = c(2,2), oma = c(0, 0, 1.1, 0))
plot(mylm, las = 1, sub='Residual Diagnostics')
par(opar)
dev.off()
if (n > n25) {
bitmap(file='test9.png')
plot(kp3:nmkm3,gqarr[,2], main='Goldfeld-Quandt test',ylab='2-sided p-value',xlab='breakpoint')
grid()
dev.off()
}
load(file='createtable')
a<-table.start()
a<-table.row.start(a)
a<-table.element(a, 'Multiple Linear Regression - Estimated Regression Equation', 1, TRUE)
a<-table.row.end(a)
myeq <- colnames(x)[1]
myeq <- paste(myeq, '[t] = ', sep='')
for (i in 1:k){
if (mysum$coefficients[i,1] > 0) myeq <- paste(myeq, '+', '')
myeq <- paste(myeq, signif(mysum$coefficients[i,1],6), sep=' ')
if (rownames(mysum$coefficients)[i] != '(Intercept)') {
myeq <- paste(myeq, rownames(mysum$coefficients)[i], sep='')
if (rownames(mysum$coefficients)[i] != 't') myeq <- paste(myeq, '[t]', sep='')
}
}
myeq <- paste(myeq, ' + e[t]')
a<-table.row.start(a)
a<-table.element(a, myeq)
a<-table.row.end(a)
a<-table.row.start(a)
a<-table.element(a, mywarning)
a<-table.row.end(a)
a<-table.end(a)
table.save(a,file='mytable1.tab')
a<-table.start()
a<-table.row.start(a)
a<-table.element(a,hyperlink('ols1.htm','Multiple Linear Regression - Ordinary Least Squares',''), 6, TRUE)
a<-table.row.end(a)
a<-table.row.start(a)
a<-table.element(a,'Variable',header=TRUE)
a<-table.element(a,'Parameter',header=TRUE)
a<-table.element(a,'S.D.',header=TRUE)
a<-table.element(a,'T-STAT
H0: parameter = 0',header=TRUE)
a<-table.element(a,'2-tail p-value',header=TRUE)
a<-table.element(a,'1-tail p-value',header=TRUE)
a<-table.row.end(a)
for (i in 1:k){
a<-table.row.start(a)
a<-table.element(a,rownames(mysum$coefficients)[i],header=TRUE)
a<-table.element(a,formatC(signif(mysum$coefficients[i,1],5),format='g',flag='+'))
a<-table.element(a,formatC(signif(mysum$coefficients[i,2],5),format='g',flag=' '))
a<-table.element(a,formatC(signif(mysum$coefficients[i,3],4),format='e',flag='+'))
a<-table.element(a,formatC(signif(mysum$coefficients[i,4],4),format='g',flag=' '))
a<-table.element(a,formatC(signif(mysum$coefficients[i,4]/2,4),format='g',flag=' '))
a<-table.row.end(a)
}
a<-table.end(a)
table.save(a,file='mytable2.tab')
a<-table.start()
a<-table.row.start(a)
a<-table.element(a, 'Multiple Linear Regression - Regression Statistics', 2, TRUE)
a<-table.row.end(a)
a<-table.row.start(a)
a<-table.element(a, 'Multiple R',1,TRUE)
a<-table.element(a,formatC(signif(sqrt(mysum$r.squared),6),format='g',flag=' '))
a<-table.row.end(a)
a<-table.row.start(a)
a<-table.element(a, 'R-squared',1,TRUE)
a<-table.element(a,formatC(signif(mysum$r.squared,6),format='g',flag=' '))
a<-table.row.end(a)
a<-table.row.start(a)
a<-table.element(a, 'Adjusted R-squared',1,TRUE)
a<-table.element(a,formatC(signif(mysum$adj.r.squared,6),format='g',flag=' '))
a<-table.row.end(a)
a<-table.row.start(a)
a<-table.element(a, 'F-TEST (value)',1,TRUE)
a<-table.element(a,formatC(signif(mysum$fstatistic[1],6),format='g',flag=' '))
a<-table.row.end(a)
a<-table.row.start(a)
a<-table.element(a, 'F-TEST (DF numerator)',1,TRUE)
a<-table.element(a, signif(mysum$fstatistic[2],6))
a<-table.row.end(a)
a<-table.row.start(a)
a<-table.element(a, 'F-TEST (DF denominator)',1,TRUE)
a<-table.element(a, signif(mysum$fstatistic[3],6))
a<-table.row.end(a)
a<-table.row.start(a)
a<-table.element(a, 'p-value',1,TRUE)
a<-table.element(a,formatC(signif(1-pf(mysum$fstatistic[1],mysum$fstatistic[2],mysum$fstatistic[3]),6),format='g',flag=' '))
a<-table.row.end(a)
a<-table.row.start(a)
a<-table.element(a, 'Multiple Linear Regression - Residual Statistics', 2, TRUE)
a<-table.row.end(a)
a<-table.row.start(a)
a<-table.element(a, 'Residual Standard Deviation',1,TRUE)
a<-table.element(a,formatC(signif(mysum$sigma,6),format='g',flag=' '))
a<-table.row.end(a)
a<-table.row.start(a)
a<-table.element(a, 'Sum Squared Residuals',1,TRUE)
a<-table.element(a,formatC(signif(sum(myerror*myerror),6),format='g',flag=' '))
a<-table.row.end(a)
a<-table.end(a)
table.save(a,file='mytable3.tab')
if(n < 200) {
a<-table.start()
a<-table.row.start(a)
a<-table.element(a, 'Multiple Linear Regression - Actuals, Interpolation, and Residuals', 4, TRUE)
a<-table.row.end(a)
a<-table.row.start(a)
a<-table.element(a, 'Time or Index', 1, TRUE)
a<-table.element(a, 'Actuals', 1, TRUE)
a<-table.element(a, 'Interpolation
Forecast', 1, TRUE)
a<-table.element(a, 'Residuals
Prediction Error', 1, TRUE)
a<-table.row.end(a)
for (i in 1:n) {
a<-table.row.start(a)
a<-table.element(a,i, 1, TRUE)
a<-table.element(a,formatC(signif(x[i],6),format='g',flag=' '))
a<-table.element(a,formatC(signif(x[i]-mysum$resid[i],6),format='g',flag=' '))
a<-table.element(a,formatC(signif(mysum$resid[i],6),format='g',flag=' '))
a<-table.row.end(a)
}
a<-table.end(a)
table.save(a,file='mytable4.tab')
if (n > n25) {
a<-table.start()
a<-table.row.start(a)
a<-table.element(a,'Goldfeld-Quandt test for Heteroskedasticity',4,TRUE)
a<-table.row.end(a)
a<-table.row.start(a)
a<-table.element(a,'p-values',header=TRUE)
a<-table.element(a,'Alternative Hypothesis',3,header=TRUE)
a<-table.row.end(a)
a<-table.row.start(a)
a<-table.element(a,'breakpoint index',header=TRUE)
a<-table.element(a,'greater',header=TRUE)
a<-table.element(a,'2-sided',header=TRUE)
a<-table.element(a,'less',header=TRUE)
a<-table.row.end(a)
for (mypoint in kp3:nmkm3) {
a<-table.row.start(a)
a<-table.element(a,mypoint,header=TRUE)
a<-table.element(a,formatC(signif(gqarr[mypoint-kp3+1,1],6),format='g',flag=' '))
a<-table.element(a,formatC(signif(gqarr[mypoint-kp3+1,2],6),format='g',flag=' '))
a<-table.element(a,formatC(signif(gqarr[mypoint-kp3+1,3],6),format='g',flag=' '))
a<-table.row.end(a)
}
a<-table.end(a)
table.save(a,file='mytable5.tab')
a<-table.start()
a<-table.row.start(a)
a<-table.element(a,'Meta Analysis of Goldfeld-Quandt test for Heteroskedasticity',4,TRUE)
a<-table.row.end(a)
a<-table.row.start(a)
a<-table.element(a,'Description',header=TRUE)
a<-table.element(a,'# significant tests',header=TRUE)
a<-table.element(a,'% significant tests',header=TRUE)
a<-table.element(a,'OK/NOK',header=TRUE)
a<-table.row.end(a)
a<-table.row.start(a)
a<-table.element(a,'1% type I error level',header=TRUE)
a<-table.element(a,signif(numsignificant1,6))
a<-table.element(a,formatC(signif(numsignificant1/numgqtests,6),format='g',flag=' '))
if (numsignificant1/numgqtests < 0.01) dum <- 'OK' else dum <- 'NOK'
a<-table.element(a,dum)
a<-table.row.end(a)
a<-table.row.start(a)
a<-table.element(a,'5% type I error level',header=TRUE)
a<-table.element(a,signif(numsignificant5,6))
a<-table.element(a,signif(numsignificant5/numgqtests,6))
if (numsignificant5/numgqtests < 0.05) dum <- 'OK' else dum <- 'NOK'
a<-table.element(a,dum)
a<-table.row.end(a)
a<-table.row.start(a)
a<-table.element(a,'10% type I error level',header=TRUE)
a<-table.element(a,signif(numsignificant10,6))
a<-table.element(a,signif(numsignificant10/numgqtests,6))
if (numsignificant10/numgqtests < 0.1) dum <- 'OK' else dum <- 'NOK'
a<-table.element(a,dum)
a<-table.row.end(a)
a<-table.end(a)
table.save(a,file='mytable6.tab')
}
}