Free Statistics
of Irreproducible Research!
Description of Statistical Computation | |||||||||||||||||||||||||||||||||||||||||||||||||||||||||||||||||||||||||||||||||||||||||||||||||||||
|---|---|---|---|---|---|---|---|---|---|---|---|---|---|---|---|---|---|---|---|---|---|---|---|---|---|---|---|---|---|---|---|---|---|---|---|---|---|---|---|---|---|---|---|---|---|---|---|---|---|---|---|---|---|---|---|---|---|---|---|---|---|---|---|---|---|---|---|---|---|---|---|---|---|---|---|---|---|---|---|---|---|---|---|---|---|---|---|---|---|---|---|---|---|---|---|---|---|---|---|---|---|
| Author's title | |||||||||||||||||||||||||||||||||||||||||||||||||||||||||||||||||||||||||||||||||||||||||||||||||||||
| Author | *The author of this computation has been verified* | ||||||||||||||||||||||||||||||||||||||||||||||||||||||||||||||||||||||||||||||||||||||||||||||||||||
| R Software Module | rwasp_notchedbox1.wasp | ||||||||||||||||||||||||||||||||||||||||||||||||||||||||||||||||||||||||||||||||||||||||||||||||||||
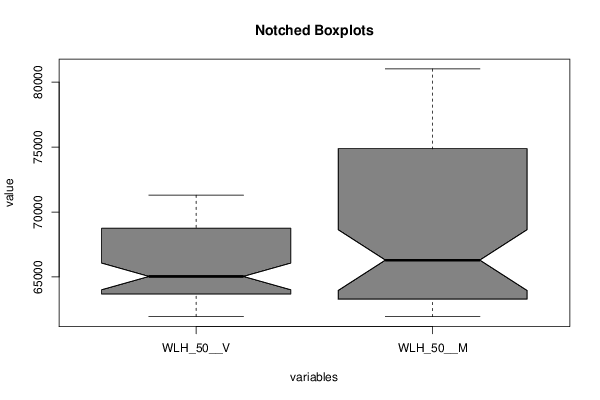
| Title produced by software | Notched Boxplots | ||||||||||||||||||||||||||||||||||||||||||||||||||||||||||||||||||||||||||||||||||||||||||||||||||||
| Date of computation | Mon, 07 Dec 2015 14:12:43 +0000 | ||||||||||||||||||||||||||||||||||||||||||||||||||||||||||||||||||||||||||||||||||||||||||||||||||||
| Cite this page as follows | Statistical Computations at FreeStatistics.org, Office for Research Development and Education, URL https://freestatistics.org/blog/index.php?v=date/2015/Dec/07/t1449497577q3mpalkx69zb0p0.htm/, Retrieved Thu, 16 May 2024 14:11:32 +0000 | ||||||||||||||||||||||||||||||||||||||||||||||||||||||||||||||||||||||||||||||||||||||||||||||||||||
| Statistical Computations at FreeStatistics.org, Office for Research Development and Education, URL https://freestatistics.org/blog/index.php?pk=285392, Retrieved Thu, 16 May 2024 14:11:32 +0000 | |||||||||||||||||||||||||||||||||||||||||||||||||||||||||||||||||||||||||||||||||||||||||||||||||||||
| QR Codes: | |||||||||||||||||||||||||||||||||||||||||||||||||||||||||||||||||||||||||||||||||||||||||||||||||||||
|
| |||||||||||||||||||||||||||||||||||||||||||||||||||||||||||||||||||||||||||||||||||||||||||||||||||||
| Original text written by user: | |||||||||||||||||||||||||||||||||||||||||||||||||||||||||||||||||||||||||||||||||||||||||||||||||||||
| IsPrivate? | No (this computation is public) | ||||||||||||||||||||||||||||||||||||||||||||||||||||||||||||||||||||||||||||||||||||||||||||||||||||
| User-defined keywords | |||||||||||||||||||||||||||||||||||||||||||||||||||||||||||||||||||||||||||||||||||||||||||||||||||||
| Estimated Impact | 100 | ||||||||||||||||||||||||||||||||||||||||||||||||||||||||||||||||||||||||||||||||||||||||||||||||||||
Tree of Dependent Computations | |||||||||||||||||||||||||||||||||||||||||||||||||||||||||||||||||||||||||||||||||||||||||||||||||||||
| Family? (F = Feedback message, R = changed R code, M = changed R Module, P = changed Parameters, D = changed Data) | |||||||||||||||||||||||||||||||||||||||||||||||||||||||||||||||||||||||||||||||||||||||||||||||||||||
| - [Notched Boxplots] [boxplot] [2015-12-07 13:57:43] [006b54b8ce76f482b86cd20c6480b526] - [Notched Boxplots] [boxplot] [2015-12-07 14:04:56] [006b54b8ce76f482b86cd20c6480b526] - R PD [Notched Boxplots] [Boxplot 25-50] [2015-12-07 14:11:12] [006b54b8ce76f482b86cd20c6480b526] - D [Notched Boxplots] [Boxplot ouder 50] [2015-12-07 14:12:43] [7a1b228211171c106fd09cb69827bfa3] [Current] - D [Notched Boxplots] [Boxplot totaal ma...] [2015-12-07 14:14:31] [006b54b8ce76f482b86cd20c6480b526] - D [Notched Boxplots] [boxplot jonger da...] [2015-12-07 14:15:56] [006b54b8ce76f482b86cd20c6480b526] - R D [Notched Boxplots] [] [2015-12-07 14:21:26] [006b54b8ce76f482b86cd20c6480b526] - RM D [Histogram] [Histogram totaal ...] [2015-12-07 14:21:55] [006b54b8ce76f482b86cd20c6480b526] - D [Histogram] [Histogram totaal ...] [2015-12-07 14:22:55] [006b54b8ce76f482b86cd20c6480b526] - D [Histogram] [Histogram mannen ...] [2015-12-07 14:30:30] [006b54b8ce76f482b86cd20c6480b526] - D [Histogram] [Histogram vrouwen...] [2015-12-07 14:31:49] [006b54b8ce76f482b86cd20c6480b526] - D [Histogram] [histogram mannen ...] [2015-12-07 14:32:55] [006b54b8ce76f482b86cd20c6480b526] - D [Histogram] [Histogram vrouwen...] [2015-12-07 14:33:46] [006b54b8ce76f482b86cd20c6480b526] - D [Histogram] [Histogram mannen ...] [2015-12-07 14:34:32] [006b54b8ce76f482b86cd20c6480b526] - D [Histogram] [Histogram vrouwen...] [2015-12-07 14:35:14] [006b54b8ce76f482b86cd20c6480b526] - RMPD [Notched Boxplots] [] [2015-12-14 16:11:38] [006b54b8ce76f482b86cd20c6480b526] - RMPD [Histogram] [mannen jonger dan 25] [2015-12-14 16:12:15] [006b54b8ce76f482b86cd20c6480b526] | |||||||||||||||||||||||||||||||||||||||||||||||||||||||||||||||||||||||||||||||||||||||||||||||||||||
| Feedback Forum | |||||||||||||||||||||||||||||||||||||||||||||||||||||||||||||||||||||||||||||||||||||||||||||||||||||
Post a new message | |||||||||||||||||||||||||||||||||||||||||||||||||||||||||||||||||||||||||||||||||||||||||||||||||||||
Dataset | |||||||||||||||||||||||||||||||||||||||||||||||||||||||||||||||||||||||||||||||||||||||||||||||||||||
| Dataseries X: | |||||||||||||||||||||||||||||||||||||||||||||||||||||||||||||||||||||||||||||||||||||||||||||||||||||
64281 62065 64023 61943 63935 62361 64387 62919 64161 62881 64011 62892 63685 62591 63522 62417 63541 62172 65070 63113 65357 63077 64281 62438 64152 62384 64043 62506 63966 62935 65040 64433 64640 64533 64179 64184 63633 63911 63327 63673 63237 63290 64793 64652 64622 64516 63615 63995 63319 64536 63261 64776 62699 65144 61956 65238 62069 65421 62179 65821 62327 66298 62526 66523 63055 67143 65277 68835 65783 68984 65353 69170 65583 69844 65950 70528 66634 71979 67836 73608 67700 73508 67463 73973 67412 73899 67308 73566 67881 73859 69652 75287 69733 75308 68891 74871 68994 75337 69021 75449 69072 76211 70283 79371 70795 80224 71111 81014 70274 80253 69220 79169 69841 79214 71275 79783 71295 79523 69073 77265 68752 76986 | |||||||||||||||||||||||||||||||||||||||||||||||||||||||||||||||||||||||||||||||||||||||||||||||||||||
Tables (Output of Computation) | |||||||||||||||||||||||||||||||||||||||||||||||||||||||||||||||||||||||||||||||||||||||||||||||||||||
| |||||||||||||||||||||||||||||||||||||||||||||||||||||||||||||||||||||||||||||||||||||||||||||||||||||
Figures (Output of Computation) | |||||||||||||||||||||||||||||||||||||||||||||||||||||||||||||||||||||||||||||||||||||||||||||||||||||
Input Parameters & R Code | |||||||||||||||||||||||||||||||||||||||||||||||||||||||||||||||||||||||||||||||||||||||||||||||||||||
| Parameters (Session): | |||||||||||||||||||||||||||||||||||||||||||||||||||||||||||||||||||||||||||||||||||||||||||||||||||||
| par1 = 1 ; par2 = 80 ; par3 = 1e-08 ; | |||||||||||||||||||||||||||||||||||||||||||||||||||||||||||||||||||||||||||||||||||||||||||||||||||||
| Parameters (R input): | |||||||||||||||||||||||||||||||||||||||||||||||||||||||||||||||||||||||||||||||||||||||||||||||||||||
| par1 = grey ; | |||||||||||||||||||||||||||||||||||||||||||||||||||||||||||||||||||||||||||||||||||||||||||||||||||||
| R code (references can be found in the software module): | |||||||||||||||||||||||||||||||||||||||||||||||||||||||||||||||||||||||||||||||||||||||||||||||||||||
z <- na.omit(as.data.frame(t(y))) | |||||||||||||||||||||||||||||||||||||||||||||||||||||||||||||||||||||||||||||||||||||||||||||||||||||