Free Statistics
of Irreproducible Research!
Description of Statistical Computation | |||||||||||||||||||||||||||||||||||||||||||||||||||||||||||||||||||||||||||||||||||||||||||||||||||||
|---|---|---|---|---|---|---|---|---|---|---|---|---|---|---|---|---|---|---|---|---|---|---|---|---|---|---|---|---|---|---|---|---|---|---|---|---|---|---|---|---|---|---|---|---|---|---|---|---|---|---|---|---|---|---|---|---|---|---|---|---|---|---|---|---|---|---|---|---|---|---|---|---|---|---|---|---|---|---|---|---|---|---|---|---|---|---|---|---|---|---|---|---|---|---|---|---|---|---|---|---|---|
| Author's title | |||||||||||||||||||||||||||||||||||||||||||||||||||||||||||||||||||||||||||||||||||||||||||||||||||||
| Author | *The author of this computation has been verified* | ||||||||||||||||||||||||||||||||||||||||||||||||||||||||||||||||||||||||||||||||||||||||||||||||||||
| R Software Module | rwasp_notchedbox1.wasp | ||||||||||||||||||||||||||||||||||||||||||||||||||||||||||||||||||||||||||||||||||||||||||||||||||||
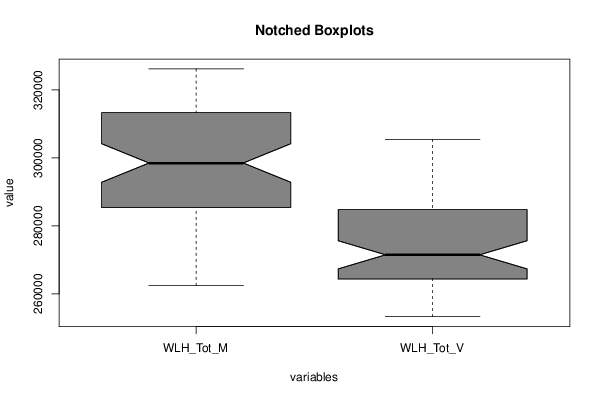
| Title produced by software | Notched Boxplots | ||||||||||||||||||||||||||||||||||||||||||||||||||||||||||||||||||||||||||||||||||||||||||||||||||||
| Date of computation | Mon, 07 Dec 2015 14:21:26 +0000 | ||||||||||||||||||||||||||||||||||||||||||||||||||||||||||||||||||||||||||||||||||||||||||||||||||||
| Cite this page as follows | Statistical Computations at FreeStatistics.org, Office for Research Development and Education, URL https://freestatistics.org/blog/index.php?v=date/2015/Dec/07/t1449498094mvd8t94m03swni0.htm/, Retrieved Thu, 16 May 2024 09:02:08 +0000 | ||||||||||||||||||||||||||||||||||||||||||||||||||||||||||||||||||||||||||||||||||||||||||||||||||||
| Statistical Computations at FreeStatistics.org, Office for Research Development and Education, URL https://freestatistics.org/blog/index.php?pk=285396, Retrieved Thu, 16 May 2024 09:02:08 +0000 | |||||||||||||||||||||||||||||||||||||||||||||||||||||||||||||||||||||||||||||||||||||||||||||||||||||
| QR Codes: | |||||||||||||||||||||||||||||||||||||||||||||||||||||||||||||||||||||||||||||||||||||||||||||||||||||
|
| |||||||||||||||||||||||||||||||||||||||||||||||||||||||||||||||||||||||||||||||||||||||||||||||||||||
| Original text written by user: | |||||||||||||||||||||||||||||||||||||||||||||||||||||||||||||||||||||||||||||||||||||||||||||||||||||
| IsPrivate? | No (this computation is public) | ||||||||||||||||||||||||||||||||||||||||||||||||||||||||||||||||||||||||||||||||||||||||||||||||||||
| User-defined keywords | |||||||||||||||||||||||||||||||||||||||||||||||||||||||||||||||||||||||||||||||||||||||||||||||||||||
| Estimated Impact | 97 | ||||||||||||||||||||||||||||||||||||||||||||||||||||||||||||||||||||||||||||||||||||||||||||||||||||
Tree of Dependent Computations | |||||||||||||||||||||||||||||||||||||||||||||||||||||||||||||||||||||||||||||||||||||||||||||||||||||
| Family? (F = Feedback message, R = changed R code, M = changed R Module, P = changed Parameters, D = changed Data) | |||||||||||||||||||||||||||||||||||||||||||||||||||||||||||||||||||||||||||||||||||||||||||||||||||||
| - [Notched Boxplots] [boxplot] [2015-12-07 13:57:43] [006b54b8ce76f482b86cd20c6480b526] - [Notched Boxplots] [boxplot] [2015-12-07 14:04:56] [006b54b8ce76f482b86cd20c6480b526] - R PD [Notched Boxplots] [Boxplot 25-50] [2015-12-07 14:11:12] [006b54b8ce76f482b86cd20c6480b526] - D [Notched Boxplots] [Boxplot ouder 50] [2015-12-07 14:12:43] [006b54b8ce76f482b86cd20c6480b526] - R D [Notched Boxplots] [] [2015-12-07 14:21:26] [7a1b228211171c106fd09cb69827bfa3] [Current] - RM D [Histogram] [Histogram totaal ...] [2015-12-07 14:21:55] [006b54b8ce76f482b86cd20c6480b526] - D [Histogram] [Histogram totaal ...] [2015-12-07 14:22:55] [006b54b8ce76f482b86cd20c6480b526] - D [Histogram] [Histogram mannen ...] [2015-12-07 14:30:30] [006b54b8ce76f482b86cd20c6480b526] - D [Histogram] [Histogram vrouwen...] [2015-12-07 14:31:49] [006b54b8ce76f482b86cd20c6480b526] - D [Histogram] [histogram mannen ...] [2015-12-07 14:32:55] [006b54b8ce76f482b86cd20c6480b526] - D [Histogram] [Histogram vrouwen...] [2015-12-07 14:33:46] [006b54b8ce76f482b86cd20c6480b526] - D [Histogram] [Histogram mannen ...] [2015-12-07 14:34:32] [006b54b8ce76f482b86cd20c6480b526] - D [Histogram] [Histogram vrouwen...] [2015-12-07 14:35:14] [006b54b8ce76f482b86cd20c6480b526] - RMPD [Notched Boxplots] [] [2015-12-14 16:11:38] [006b54b8ce76f482b86cd20c6480b526] - RMPD [Histogram] [mannen jonger dan 25] [2015-12-14 16:12:15] [006b54b8ce76f482b86cd20c6480b526] | |||||||||||||||||||||||||||||||||||||||||||||||||||||||||||||||||||||||||||||||||||||||||||||||||||||
| Feedback Forum | |||||||||||||||||||||||||||||||||||||||||||||||||||||||||||||||||||||||||||||||||||||||||||||||||||||
Post a new message | |||||||||||||||||||||||||||||||||||||||||||||||||||||||||||||||||||||||||||||||||||||||||||||||||||||
Dataset | |||||||||||||||||||||||||||||||||||||||||||||||||||||||||||||||||||||||||||||||||||||||||||||||||||||
| Dataseries X: | |||||||||||||||||||||||||||||||||||||||||||||||||||||||||||||||||||||||||||||||||||||||||||||||||||||
287224 276444 279998 268606 283495 267679 285775 269879 282329 265641 277799 262525 271980 258597 266730 253849 262433 256221 285378 286895 286692 294610 282917 280363 277686 269926 274371 264341 277466 263269 290604 271045 290770 267915 283654 262078 278601 257751 274405 253271 272817 257638 294292 287452 300562 298152 298982 284793 296917 274560 295008 268270 297295 267577 305671 271866 303853 268546 300708 264722 298194 262425 292254 258973 290646 262751 314707 296186 317009 304659 317706 295442 313312 285466 311048 279575 315917 279985 326174 286012 322116 281337 317092 276270 310468 271472 302438 265637 298493 268974 320124 299299 321873 305452 321676 295468 316696 285584 312612 278204 313307 276505 320883 279732 318749 276980 315126 271832 304600 263105 295245 256162 293619 260705 309700 285857 310597 291870 307416 280358 301126 270981 | |||||||||||||||||||||||||||||||||||||||||||||||||||||||||||||||||||||||||||||||||||||||||||||||||||||
Tables (Output of Computation) | |||||||||||||||||||||||||||||||||||||||||||||||||||||||||||||||||||||||||||||||||||||||||||||||||||||
| |||||||||||||||||||||||||||||||||||||||||||||||||||||||||||||||||||||||||||||||||||||||||||||||||||||
Figures (Output of Computation) | |||||||||||||||||||||||||||||||||||||||||||||||||||||||||||||||||||||||||||||||||||||||||||||||||||||
Input Parameters & R Code | |||||||||||||||||||||||||||||||||||||||||||||||||||||||||||||||||||||||||||||||||||||||||||||||||||||
| Parameters (Session): | |||||||||||||||||||||||||||||||||||||||||||||||||||||||||||||||||||||||||||||||||||||||||||||||||||||
| par1 = 1 ; par2 = 80 ; par3 = 1e-08 ; | |||||||||||||||||||||||||||||||||||||||||||||||||||||||||||||||||||||||||||||||||||||||||||||||||||||
| Parameters (R input): | |||||||||||||||||||||||||||||||||||||||||||||||||||||||||||||||||||||||||||||||||||||||||||||||||||||
| par1 = grey ; | |||||||||||||||||||||||||||||||||||||||||||||||||||||||||||||||||||||||||||||||||||||||||||||||||||||
| R code (references can be found in the software module): | |||||||||||||||||||||||||||||||||||||||||||||||||||||||||||||||||||||||||||||||||||||||||||||||||||||
z <- na.omit(as.data.frame(t(y))) | |||||||||||||||||||||||||||||||||||||||||||||||||||||||||||||||||||||||||||||||||||||||||||||||||||||