Free Statistics

of Irreproducible Research!

Author's title

Author*The author of this computation has been verified*
R Software Modulerwasp_notchedbox1.wasp
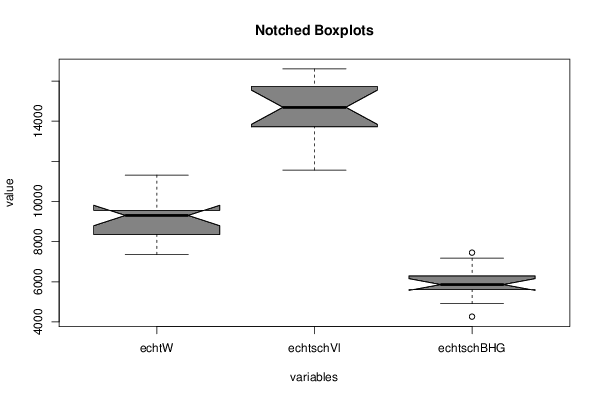
Title produced by softwareNotched Boxplots
Date of computationMon, 07 Dec 2015 14:13:29 +0000
Cite this page as followsStatistical Computations at FreeStatistics.org, Office for Research Development and Education, URL https://freestatistics.org/blog/index.php?v=date/2015/Dec/07/t144950386820wpqu2ju9l9fyx.htm/, Retrieved Thu, 16 May 2024 08:59:56 +0000
Statistical Computations at FreeStatistics.org, Office for Research Development and Education, URL https://freestatistics.org/blog/index.php?pk=285417, Retrieved Thu, 16 May 2024 08:59:56 +0000
QR Codes:

Original text written by user:
IsPrivate?No (this computation is public)
User-defined keywords
Estimated Impact96
Family? (F = Feedback message, R = changed R code, M = changed R Module, P = changed Parameters, D = changed Data)
-     [Multiple Regression] [] [2015-12-04 19:09:53] [32b17a345b130fdf5cc88718ed94a974]
- RMPD    [Notched Boxplots] [Notched Boxplots] [2015-12-07 14:13:29] [251fcf1900e94324ddd30bcbf8f5697f] [Current]
Feedback Forum

Post a new message
Dataseries X:
8351 14389 4262
9239 15165 4910
9519 15728 5381
9368 16382 5605
9557 16155 5693
9759 15390 5691
9201 14213 5775
9468 14395 6218
11314 16602 7450
10442 14991 7173
8807 13711 6385
8219 13008 6295
7885 12301 5959
7357 11567 5948


Summary of computational transaction
Raw Inputview raw input (R code)
Raw Outputview raw output of R engine
Computing time1 seconds
R Server'George Udny Yule' @ yule.wessa.net

\begin{tabular}{lllllllll}
\hline
Summary of computational transaction \tabularnewline
Raw Input & view raw input (R code)  \tabularnewline
Raw Output & view raw output of R engine  \tabularnewline
Computing time & 1 seconds \tabularnewline
R Server & 'George Udny Yule' @ yule.wessa.net \tabularnewline
\hline
\end{tabular}
%Source: https://freestatistics.org/blog/index.php?pk=285417&T=0

[TABLE]
[ROW][C]Summary of computational transaction[/C][/ROW]
[ROW][C]Raw Input[/C][C]view raw input (R code) [/C][/ROW]
[ROW][C]Raw Output[/C][C]view raw output of R engine [/C][/ROW]
[ROW][C]Computing time[/C][C]1 seconds[/C][/ROW]
[ROW][C]R Server[/C][C]'George Udny Yule' @ yule.wessa.net[/C][/ROW]
[/TABLE]
Source: https://freestatistics.org/blog/index.php?pk=285417&T=0

Globally Unique Identifier (entire table): ba.freestatistics.org/blog/index.php?pk=285417&T=0

As an alternative you can also use a QR Code:  

The GUIDs for individual cells are displayed in the table below:

Summary of computational transaction
Raw Inputview raw input (R code)
Raw Outputview raw output of R engine
Computing time1 seconds
R Server'George Udny Yule' @ yule.wessa.net


Boxplot statistics
Variablelower whiskerlower hingemedianupper hingeupper whisker
echtW735783519303.5955711314
echtschVl1156713711146931572816602
echtschBHG491056055861.562957173

\begin{tabular}{lllllllll}
\hline
Boxplot statistics \tabularnewline
Variable & lower whisker & lower hinge & median & upper hinge & upper whisker \tabularnewline
echtW & 7357 & 8351 & 9303.5 & 9557 & 11314 \tabularnewline
echtschVl & 11567 & 13711 & 14693 & 15728 & 16602 \tabularnewline
echtschBHG & 4910 & 5605 & 5861.5 & 6295 & 7173 \tabularnewline
\hline
\end{tabular}
%Source: https://freestatistics.org/blog/index.php?pk=285417&T=1

[TABLE]
[ROW][C]Boxplot statistics[/C][/ROW]
[ROW][C]Variable[/C][C]lower whisker[/C][C]lower hinge[/C][C]median[/C][C]upper hinge[/C][C]upper whisker[/C][/ROW]
[ROW][C]echtW[/C][C]7357[/C][C]8351[/C][C]9303.5[/C][C]9557[/C][C]11314[/C][/ROW]
[ROW][C]echtschVl[/C][C]11567[/C][C]13711[/C][C]14693[/C][C]15728[/C][C]16602[/C][/ROW]
[ROW][C]echtschBHG[/C][C]4910[/C][C]5605[/C][C]5861.5[/C][C]6295[/C][C]7173[/C][/ROW]
[/TABLE]
Source: https://freestatistics.org/blog/index.php?pk=285417&T=1

Globally Unique Identifier (entire table): ba.freestatistics.org/blog/index.php?pk=285417&T=1

As an alternative you can also use a QR Code:  

The GUIDs for individual cells are displayed in the table below:

Boxplot statistics
Variablelower whiskerlower hingemedianupper hingeupper whisker
echtW735783519303.5955711314
echtschVl1156713711146931572816602
echtschBHG491056055861.562957173


Boxplot Notches
Variablelower boundmedianupper bound
echtW8794.239048760719303.59812.76095123929
echtschVl13841.2758385991469315544.724161401
echtschBHG5570.131794067085861.56152.86820593292

\begin{tabular}{lllllllll}
\hline
Boxplot Notches \tabularnewline
Variable & lower bound & median & upper bound \tabularnewline
echtW & 8794.23904876071 & 9303.5 & 9812.76095123929 \tabularnewline
echtschVl & 13841.275838599 & 14693 & 15544.724161401 \tabularnewline
echtschBHG & 5570.13179406708 & 5861.5 & 6152.86820593292 \tabularnewline
\hline
\end{tabular}
%Source: https://freestatistics.org/blog/index.php?pk=285417&T=2

[TABLE]
[ROW][C]Boxplot Notches[/C][/ROW]
[ROW][C]Variable[/C][C]lower bound[/C][C]median[/C][C]upper bound[/C][/ROW]
[ROW][C]echtW[/C][C]8794.23904876071[/C][C]9303.5[/C][C]9812.76095123929[/C][/ROW]
[ROW][C]echtschVl[/C][C]13841.275838599[/C][C]14693[/C][C]15544.724161401[/C][/ROW]
[ROW][C]echtschBHG[/C][C]5570.13179406708[/C][C]5861.5[/C][C]6152.86820593292[/C][/ROW]
[/TABLE]
Source: https://freestatistics.org/blog/index.php?pk=285417&T=2

Globally Unique Identifier (entire table): ba.freestatistics.org/blog/index.php?pk=285417&T=2

As an alternative you can also use a QR Code:  

The GUIDs for individual cells are displayed in the table below:

Boxplot Notches
Variablelower boundmedianupper bound
echtW8794.239048760719303.59812.76095123929
echtschVl13841.2758385991469315544.724161401
echtschBHG5570.131794067085861.56152.86820593292


Parameters (Session):
par1 = grey ;
Parameters (R input):
par1 = grey ;
R code (references can be found in the software module):
z <- na.omit(as.data.frame(t(y)))
bitmap(file='test1.png')
(r<-boxplot(z ,xlab=xlab,ylab=ylab,main=main,notch=TRUE,col=par1))
dev.off()
load(file='createtable')
a<-table.start()
a<-table.row.start(a)
a<-table.element(a,hyperlink('overview.htm','Boxplot statistics','Boxplot overview'),6,TRUE)
a<-table.row.end(a)
a<-table.row.start(a)
a<-table.element(a,'Variable',1,TRUE)
a<-table.element(a,hyperlink('lower_whisker.htm','lower whisker','definition of lower whisker'),1,TRUE)
a<-table.element(a,hyperlink('lower_hinge.htm','lower hinge','definition of lower hinge'),1,TRUE)
a<-table.element(a,hyperlink('central_tendency.htm','median','definitions about measures of central tendency'),1,TRUE)
a<-table.element(a,hyperlink('upper_hinge.htm','upper hinge','definition of upper hinge'),1,TRUE)
a<-table.element(a,hyperlink('upper_whisker.htm','upper whisker','definition of upper whisker'),1,TRUE)
a<-table.row.end(a)
for (i in 1:length(y[,1]))
{
a<-table.row.start(a)
a<-table.element(a,dimnames(t(x))[[2]][i],1,TRUE)
for (j in 1:5)
{
a<-table.element(a,r$stats[j,i])
}
a<-table.row.end(a)
}
a<-table.end(a)
table.save(a,file='mytable.tab')
a<-table.start()
a<-table.row.start(a)
a<-table.element(a,'Boxplot Notches',4,TRUE)
a<-table.row.end(a)
a<-table.row.start(a)
a<-table.element(a,'Variable',1,TRUE)
a<-table.element(a,'lower bound',1,TRUE)
a<-table.element(a,'median',1,TRUE)
a<-table.element(a,'upper bound',1,TRUE)
a<-table.row.end(a)
for (i in 1:length(y[,1]))
{
a<-table.row.start(a)
a<-table.element(a,dimnames(t(x))[[2]][i],1,TRUE)
a<-table.element(a,r$conf[1,i])
a<-table.element(a,r$stats[3,i])
a<-table.element(a,r$conf[2,i])
a<-table.row.end(a)
}
a<-table.end(a)
table.save(a,file='mytable1.tab')