Free Statistics

of Irreproducible Research!

Author's title

Author*The author of this computation has been verified*
R Software Modulerwasp_multipleregression.wasp
Title produced by softwareMultiple Regression
Date of computationTue, 08 Dec 2015 07:55:23 +0000
Cite this page as followsStatistical Computations at FreeStatistics.org, Office for Research Development and Education, URL https://freestatistics.org/blog/index.php?v=date/2015/Dec/08/t1449562070y3432hjukup5icn.htm/, Retrieved Thu, 16 May 2024 07:57:25 +0000
Statistical Computations at FreeStatistics.org, Office for Research Development and Education, URL https://freestatistics.org/blog/index.php?pk=285439, Retrieved Thu, 16 May 2024 07:57:25 +0000
QR Codes:

Original text written by user:De cijfers van de autoregistratie zijn vergezeld met cijfers van de persoonlijke spaargelden van de mensen, de oorlogen waaraan Amerika heeft meegestreden en de presidenten van weleer
IsPrivate?No (this computation is public)
User-defined keywords
Estimated Impact136
Family? (F = Feedback message, R = changed R code, M = changed R Module, P = changed Parameters, D = changed Data)
-       [Multiple Regression] [Auto registratie ...] [2015-12-08 07:55:23] [0699448209a825438cb2d76a05e8a0a6] [Current]
Feedback Forum

Post a new message
Dataseries X:
1554	53.361	0	0
1994	56.628	0	0
1961	62.073	0	0
1716	62.073	0	0
1425	71.1295	0	0
1664	76.86575	0	0
1524	79.16025	0	0
1342	81.45475	0	0
1449	78.969	0	0
1622	83.755	0	0
1530	82.5585	0	0
1385	76.576	0	0
1117	81.609	0	0
1253	79.136	0	0
1088	86.555	0	1
1167	90.2645	0	1
1344	78.315	0	0
1745	82.23075	0	0
1559	62.652	0	0
1395	69.17825	0	0
1521	72.252	0	0
1890	62.886	0	0
1531	65.562	0	0
1635	58.872	0	0
1269	70.21425	1	0
1612	72.96775	1	1
1343	82.605	1	0
1634	81.22825	1	0
1571	84.5175	1	0
1881	80.22	1	0
1528	75.9225	1	0
1960	64.4625	1	0
1676	69.56	1	0
2166	68.08	1	0
1663	63.64	1	0
2067	74	1	0
1801	80.548	1	1
2347	96.038	1	1
1938	89.842	1	1
1980	103.783	1	1
2097	91.04325	1	1
2579	97.43225	1	1
2191	115.002	1	1
2449	103.82125	1	1
2208	101.30575	1	1
2353	104.62725	1	1
2151	106.288	1	1
2307	116.2525	1	1
1826	130.72	1	1
2414	123.84	1	1
2029	129	1	1
2091	120.4	1	1
1988	139.593	1	1
2484	132.246	1	1
2321	137.75625	1	1
2614	143.2665	1	1


Summary of computational transaction
Raw Inputview raw input (R code)
Raw Outputview raw output of R engine
Computing time4 seconds
R Server'Gertrude Mary Cox' @ cox.wessa.net

\begin{tabular}{lllllllll}
\hline
Summary of computational transaction \tabularnewline
Raw Input & view raw input (R code)  \tabularnewline
Raw Output & view raw output of R engine  \tabularnewline
Computing time & 4 seconds \tabularnewline
R Server & 'Gertrude Mary Cox' @ cox.wessa.net \tabularnewline
\hline
\end{tabular}
%Source: https://freestatistics.org/blog/index.php?pk=285439&T=0

[TABLE]
[ROW][C]Summary of computational transaction[/C][/ROW]
[ROW][C]Raw Input[/C][C]view raw input (R code) [/C][/ROW]
[ROW][C]Raw Output[/C][C]view raw output of R engine [/C][/ROW]
[ROW][C]Computing time[/C][C]4 seconds[/C][/ROW]
[ROW][C]R Server[/C][C]'Gertrude Mary Cox' @ cox.wessa.net[/C][/ROW]
[/TABLE]
Source: https://freestatistics.org/blog/index.php?pk=285439&T=0

Globally Unique Identifier (entire table): ba.freestatistics.org/blog/index.php?pk=285439&T=0

As an alternative you can also use a QR Code:  

The GUIDs for individual cells are displayed in the table below:

Summary of computational transaction
Raw Inputview raw input (R code)
Raw Outputview raw output of R engine
Computing time4 seconds
R Server'Gertrude Mary Cox' @ cox.wessa.net


Multiple Linear Regression - Estimated Regression Equation
a[t] = + 1251.76 + 3.42637b[t] + 310.091c[t] + 179.287d[t] + e[t]

\begin{tabular}{lllllllll}
\hline
Multiple Linear Regression - Estimated Regression Equation \tabularnewline
a[t] =  +  1251.76 +  3.42637b[t] +  310.091c[t] +  179.287d[t]  + e[t] \tabularnewline
 \tabularnewline
\hline
\end{tabular}
%Source: https://freestatistics.org/blog/index.php?pk=285439&T=1

[TABLE]
[ROW][C]Multiple Linear Regression - Estimated Regression Equation[/C][/ROW]
[ROW][C]a[t] =  +  1251.76 +  3.42637b[t] +  310.091c[t] +  179.287d[t]  + e[t][/C][/ROW]
[ROW][C][/C][/ROW]
[/TABLE]
Source: https://freestatistics.org/blog/index.php?pk=285439&T=1

Globally Unique Identifier (entire table): ba.freestatistics.org/blog/index.php?pk=285439&T=1

As an alternative you can also use a QR Code:  

The GUIDs for individual cells are displayed in the table below:

Multiple Linear Regression - Estimated Regression Equation
a[t] = + 1251.76 + 3.42637b[t] + 310.091c[t] + 179.287d[t] + e[t]


Multiple Linear Regression - Ordinary Least Squares
VariableParameterS.D.T-STATH0: parameter = 02-tail p-value1-tail p-value
(Intercept)+1252 201.8+6.2020e+00 9.225e-08 4.612e-08
b+3.426 2.743+1.2490e+00 0.2172 0.1086
c+310.1 96.81+3.2030e+00 0.002322 0.001161
d+179.3 131.8+1.3600e+00 0.1797 0.08986

\begin{tabular}{lllllllll}
\hline
Multiple Linear Regression - Ordinary Least Squares \tabularnewline
Variable & Parameter & S.D. & T-STATH0: parameter = 0 & 2-tail p-value & 1-tail p-value \tabularnewline
(Intercept) & +1252 &  201.8 & +6.2020e+00 &  9.225e-08 &  4.612e-08 \tabularnewline
b & +3.426 &  2.743 & +1.2490e+00 &  0.2172 &  0.1086 \tabularnewline
c & +310.1 &  96.81 & +3.2030e+00 &  0.002322 &  0.001161 \tabularnewline
d & +179.3 &  131.8 & +1.3600e+00 &  0.1797 &  0.08986 \tabularnewline
\hline
\end{tabular}
%Source: https://freestatistics.org/blog/index.php?pk=285439&T=2

[TABLE]
[ROW][C]Multiple Linear Regression - Ordinary Least Squares[/C][/ROW]
[ROW][C]Variable[/C][C]Parameter[/C][C]S.D.[/C][C]T-STATH0: parameter = 0[/C][C]2-tail p-value[/C][C]1-tail p-value[/C][/ROW]
[ROW][C](Intercept)[/C][C]+1252[/C][C] 201.8[/C][C]+6.2020e+00[/C][C] 9.225e-08[/C][C] 4.612e-08[/C][/ROW]
[ROW][C]b[/C][C]+3.426[/C][C] 2.743[/C][C]+1.2490e+00[/C][C] 0.2172[/C][C] 0.1086[/C][/ROW]
[ROW][C]c[/C][C]+310.1[/C][C] 96.81[/C][C]+3.2030e+00[/C][C] 0.002322[/C][C] 0.001161[/C][/ROW]
[ROW][C]d[/C][C]+179.3[/C][C] 131.8[/C][C]+1.3600e+00[/C][C] 0.1797[/C][C] 0.08986[/C][/ROW]
[/TABLE]
Source: https://freestatistics.org/blog/index.php?pk=285439&T=2

Globally Unique Identifier (entire table): ba.freestatistics.org/blog/index.php?pk=285439&T=2

As an alternative you can also use a QR Code:  

The GUIDs for individual cells are displayed in the table below:

Multiple Linear Regression - Ordinary Least Squares
VariableParameterS.D.T-STATH0: parameter = 02-tail p-value1-tail p-value
(Intercept)+1252 201.8+6.2020e+00 9.225e-08 4.612e-08
b+3.426 2.743+1.2490e+00 0.2172 0.1086
c+310.1 96.81+3.2030e+00 0.002322 0.001161
d+179.3 131.8+1.3600e+00 0.1797 0.08986


Multiple Linear Regression - Regression Statistics
Multiple R 0.7076
R-squared 0.5007
Adjusted R-squared 0.4719
F-TEST (value) 17.38
F-TEST (DF numerator)3
F-TEST (DF denominator)52
p-value 6.03e-08
Multiple Linear Regression - Residual Statistics
Residual Standard Deviation 288.1
Sum Squared Residuals 4.316e+06

\begin{tabular}{lllllllll}
\hline
Multiple Linear Regression - Regression Statistics \tabularnewline
Multiple R &  0.7076 \tabularnewline
R-squared &  0.5007 \tabularnewline
Adjusted R-squared &  0.4719 \tabularnewline
F-TEST (value) &  17.38 \tabularnewline
F-TEST (DF numerator) & 3 \tabularnewline
F-TEST (DF denominator) & 52 \tabularnewline
p-value &  6.03e-08 \tabularnewline
Multiple Linear Regression - Residual Statistics \tabularnewline
Residual Standard Deviation &  288.1 \tabularnewline
Sum Squared Residuals &  4.316e+06 \tabularnewline
\hline
\end{tabular}
%Source: https://freestatistics.org/blog/index.php?pk=285439&T=3

[TABLE]
[ROW][C]Multiple Linear Regression - Regression Statistics[/C][/ROW]
[ROW][C]Multiple R[/C][C] 0.7076[/C][/ROW]
[ROW][C]R-squared[/C][C] 0.5007[/C][/ROW]
[ROW][C]Adjusted R-squared[/C][C] 0.4719[/C][/ROW]
[ROW][C]F-TEST (value)[/C][C] 17.38[/C][/ROW]
[ROW][C]F-TEST (DF numerator)[/C][C]3[/C][/ROW]
[ROW][C]F-TEST (DF denominator)[/C][C]52[/C][/ROW]
[ROW][C]p-value[/C][C] 6.03e-08[/C][/ROW]
[ROW][C]Multiple Linear Regression - Residual Statistics[/C][/ROW]
[ROW][C]Residual Standard Deviation[/C][C] 288.1[/C][/ROW]
[ROW][C]Sum Squared Residuals[/C][C] 4.316e+06[/C][/ROW]
[/TABLE]
Source: https://freestatistics.org/blog/index.php?pk=285439&T=3

Globally Unique Identifier (entire table): ba.freestatistics.org/blog/index.php?pk=285439&T=3

As an alternative you can also use a QR Code:  

The GUIDs for individual cells are displayed in the table below:

Multiple Linear Regression - Regression Statistics
Multiple R 0.7076
R-squared 0.5007
Adjusted R-squared 0.4719
F-TEST (value) 17.38
F-TEST (DF numerator)3
F-TEST (DF denominator)52
p-value 6.03e-08
Multiple Linear Regression - Residual Statistics
Residual Standard Deviation 288.1
Sum Squared Residuals 4.316e+06


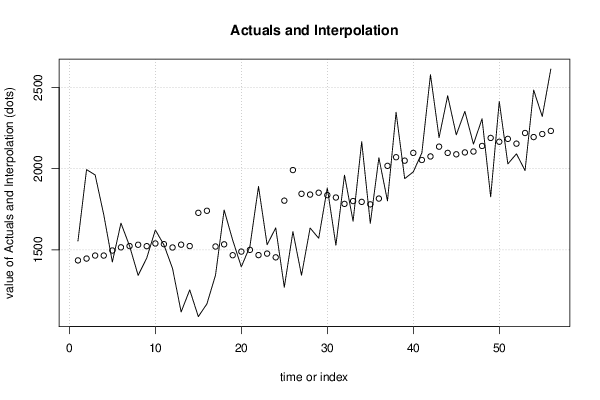
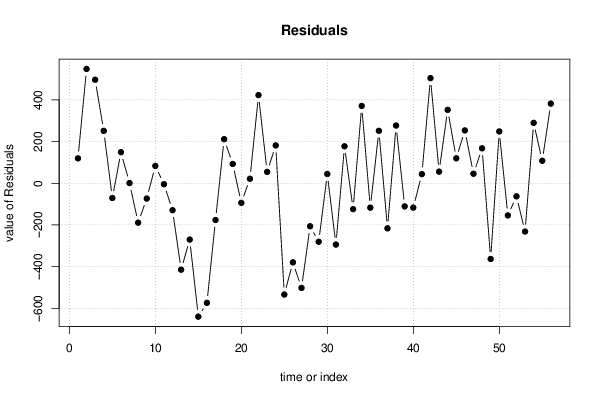
Multiple Linear Regression - Actuals, Interpolation, and Residuals
Time or IndexActualsInterpolationForecastResidualsPrediction Error
1 1554 1435 119.4
2 1994 1446 548.2
3 1961 1464 496.6
4 1716 1464 251.6
5 1425 1495-70.47
6 1664 1515 148.9
7 1524 1523 1.01
8 1342 1531-188.9
9 1449 1522-73.33
10 1622 1539 83.27
11 1530 1535-4.633
12 1385 1514-129.1
13 1117 1531-414.4
14 1253 1523-269.9
15 1088 1728-639.6
16 1167 1740-573.3
17 1344 1520-176.1
18 1745 1534 211.5
19 1559 1466 92.57
20 1395 1489-93.79
21 1521 1499 21.68
22 1890 1467 422.8
23 1531 1476 54.6
24 1635 1453 181.5
25 1269 1802-533.4
26 1612 1991-379.1
27 1343 1845-501.9
28 1634 1840-206.2
29 1571 1851-280.4
30 1881 1837 44.29
31 1528 1822-294
32 1960 1783 177.3
33 1676 1800-124.2
34 2166 1795 370.9
35 1663 1780-116.9
36 2067 1815 251.6
37 1801 2017-216.1
38 2347 2070 276.8
39 1938 2049-111
40 1980 2097-116.7
41 2097 2053 43.92
42 2579 2075 504
43 2191 2135 55.83
44 2449 2097 352.1
45 2208 2088 119.8
46 2353 2100 253.4
47 2151 2105 45.68
48 2307 2139 167.5
49 1826 2189-363
50 2414 2165 248.5
51 2029 2183-154.1
52 2091 2154-62.67
53 1988 2219-231.4
54 2484 2194 289.7
55 2321 2213 107.9
56 2614 2232 382

\begin{tabular}{lllllllll}
\hline
Multiple Linear Regression - Actuals, Interpolation, and Residuals \tabularnewline
Time or Index & Actuals & InterpolationForecast & ResidualsPrediction Error \tabularnewline
1 &  1554 &  1435 &  119.4 \tabularnewline
2 &  1994 &  1446 &  548.2 \tabularnewline
3 &  1961 &  1464 &  496.6 \tabularnewline
4 &  1716 &  1464 &  251.6 \tabularnewline
5 &  1425 &  1495 & -70.47 \tabularnewline
6 &  1664 &  1515 &  148.9 \tabularnewline
7 &  1524 &  1523 &  1.01 \tabularnewline
8 &  1342 &  1531 & -188.9 \tabularnewline
9 &  1449 &  1522 & -73.33 \tabularnewline
10 &  1622 &  1539 &  83.27 \tabularnewline
11 &  1530 &  1535 & -4.633 \tabularnewline
12 &  1385 &  1514 & -129.1 \tabularnewline
13 &  1117 &  1531 & -414.4 \tabularnewline
14 &  1253 &  1523 & -269.9 \tabularnewline
15 &  1088 &  1728 & -639.6 \tabularnewline
16 &  1167 &  1740 & -573.3 \tabularnewline
17 &  1344 &  1520 & -176.1 \tabularnewline
18 &  1745 &  1534 &  211.5 \tabularnewline
19 &  1559 &  1466 &  92.57 \tabularnewline
20 &  1395 &  1489 & -93.79 \tabularnewline
21 &  1521 &  1499 &  21.68 \tabularnewline
22 &  1890 &  1467 &  422.8 \tabularnewline
23 &  1531 &  1476 &  54.6 \tabularnewline
24 &  1635 &  1453 &  181.5 \tabularnewline
25 &  1269 &  1802 & -533.4 \tabularnewline
26 &  1612 &  1991 & -379.1 \tabularnewline
27 &  1343 &  1845 & -501.9 \tabularnewline
28 &  1634 &  1840 & -206.2 \tabularnewline
29 &  1571 &  1851 & -280.4 \tabularnewline
30 &  1881 &  1837 &  44.29 \tabularnewline
31 &  1528 &  1822 & -294 \tabularnewline
32 &  1960 &  1783 &  177.3 \tabularnewline
33 &  1676 &  1800 & -124.2 \tabularnewline
34 &  2166 &  1795 &  370.9 \tabularnewline
35 &  1663 &  1780 & -116.9 \tabularnewline
36 &  2067 &  1815 &  251.6 \tabularnewline
37 &  1801 &  2017 & -216.1 \tabularnewline
38 &  2347 &  2070 &  276.8 \tabularnewline
39 &  1938 &  2049 & -111 \tabularnewline
40 &  1980 &  2097 & -116.7 \tabularnewline
41 &  2097 &  2053 &  43.92 \tabularnewline
42 &  2579 &  2075 &  504 \tabularnewline
43 &  2191 &  2135 &  55.83 \tabularnewline
44 &  2449 &  2097 &  352.1 \tabularnewline
45 &  2208 &  2088 &  119.8 \tabularnewline
46 &  2353 &  2100 &  253.4 \tabularnewline
47 &  2151 &  2105 &  45.68 \tabularnewline
48 &  2307 &  2139 &  167.5 \tabularnewline
49 &  1826 &  2189 & -363 \tabularnewline
50 &  2414 &  2165 &  248.5 \tabularnewline
51 &  2029 &  2183 & -154.1 \tabularnewline
52 &  2091 &  2154 & -62.67 \tabularnewline
53 &  1988 &  2219 & -231.4 \tabularnewline
54 &  2484 &  2194 &  289.7 \tabularnewline
55 &  2321 &  2213 &  107.9 \tabularnewline
56 &  2614 &  2232 &  382 \tabularnewline
\hline
\end{tabular}
%Source: https://freestatistics.org/blog/index.php?pk=285439&T=4

[TABLE]
[ROW][C]Multiple Linear Regression - Actuals, Interpolation, and Residuals[/C][/ROW]
[ROW][C]Time or Index[/C][C]Actuals[/C][C]InterpolationForecast[/C][C]ResidualsPrediction Error[/C][/ROW]
[ROW][C]1[/C][C] 1554[/C][C] 1435[/C][C] 119.4[/C][/ROW]
[ROW][C]2[/C][C] 1994[/C][C] 1446[/C][C] 548.2[/C][/ROW]
[ROW][C]3[/C][C] 1961[/C][C] 1464[/C][C] 496.6[/C][/ROW]
[ROW][C]4[/C][C] 1716[/C][C] 1464[/C][C] 251.6[/C][/ROW]
[ROW][C]5[/C][C] 1425[/C][C] 1495[/C][C]-70.47[/C][/ROW]
[ROW][C]6[/C][C] 1664[/C][C] 1515[/C][C] 148.9[/C][/ROW]
[ROW][C]7[/C][C] 1524[/C][C] 1523[/C][C] 1.01[/C][/ROW]
[ROW][C]8[/C][C] 1342[/C][C] 1531[/C][C]-188.9[/C][/ROW]
[ROW][C]9[/C][C] 1449[/C][C] 1522[/C][C]-73.33[/C][/ROW]
[ROW][C]10[/C][C] 1622[/C][C] 1539[/C][C] 83.27[/C][/ROW]
[ROW][C]11[/C][C] 1530[/C][C] 1535[/C][C]-4.633[/C][/ROW]
[ROW][C]12[/C][C] 1385[/C][C] 1514[/C][C]-129.1[/C][/ROW]
[ROW][C]13[/C][C] 1117[/C][C] 1531[/C][C]-414.4[/C][/ROW]
[ROW][C]14[/C][C] 1253[/C][C] 1523[/C][C]-269.9[/C][/ROW]
[ROW][C]15[/C][C] 1088[/C][C] 1728[/C][C]-639.6[/C][/ROW]
[ROW][C]16[/C][C] 1167[/C][C] 1740[/C][C]-573.3[/C][/ROW]
[ROW][C]17[/C][C] 1344[/C][C] 1520[/C][C]-176.1[/C][/ROW]
[ROW][C]18[/C][C] 1745[/C][C] 1534[/C][C] 211.5[/C][/ROW]
[ROW][C]19[/C][C] 1559[/C][C] 1466[/C][C] 92.57[/C][/ROW]
[ROW][C]20[/C][C] 1395[/C][C] 1489[/C][C]-93.79[/C][/ROW]
[ROW][C]21[/C][C] 1521[/C][C] 1499[/C][C] 21.68[/C][/ROW]
[ROW][C]22[/C][C] 1890[/C][C] 1467[/C][C] 422.8[/C][/ROW]
[ROW][C]23[/C][C] 1531[/C][C] 1476[/C][C] 54.6[/C][/ROW]
[ROW][C]24[/C][C] 1635[/C][C] 1453[/C][C] 181.5[/C][/ROW]
[ROW][C]25[/C][C] 1269[/C][C] 1802[/C][C]-533.4[/C][/ROW]
[ROW][C]26[/C][C] 1612[/C][C] 1991[/C][C]-379.1[/C][/ROW]
[ROW][C]27[/C][C] 1343[/C][C] 1845[/C][C]-501.9[/C][/ROW]
[ROW][C]28[/C][C] 1634[/C][C] 1840[/C][C]-206.2[/C][/ROW]
[ROW][C]29[/C][C] 1571[/C][C] 1851[/C][C]-280.4[/C][/ROW]
[ROW][C]30[/C][C] 1881[/C][C] 1837[/C][C] 44.29[/C][/ROW]
[ROW][C]31[/C][C] 1528[/C][C] 1822[/C][C]-294[/C][/ROW]
[ROW][C]32[/C][C] 1960[/C][C] 1783[/C][C] 177.3[/C][/ROW]
[ROW][C]33[/C][C] 1676[/C][C] 1800[/C][C]-124.2[/C][/ROW]
[ROW][C]34[/C][C] 2166[/C][C] 1795[/C][C] 370.9[/C][/ROW]
[ROW][C]35[/C][C] 1663[/C][C] 1780[/C][C]-116.9[/C][/ROW]
[ROW][C]36[/C][C] 2067[/C][C] 1815[/C][C] 251.6[/C][/ROW]
[ROW][C]37[/C][C] 1801[/C][C] 2017[/C][C]-216.1[/C][/ROW]
[ROW][C]38[/C][C] 2347[/C][C] 2070[/C][C] 276.8[/C][/ROW]
[ROW][C]39[/C][C] 1938[/C][C] 2049[/C][C]-111[/C][/ROW]
[ROW][C]40[/C][C] 1980[/C][C] 2097[/C][C]-116.7[/C][/ROW]
[ROW][C]41[/C][C] 2097[/C][C] 2053[/C][C] 43.92[/C][/ROW]
[ROW][C]42[/C][C] 2579[/C][C] 2075[/C][C] 504[/C][/ROW]
[ROW][C]43[/C][C] 2191[/C][C] 2135[/C][C] 55.83[/C][/ROW]
[ROW][C]44[/C][C] 2449[/C][C] 2097[/C][C] 352.1[/C][/ROW]
[ROW][C]45[/C][C] 2208[/C][C] 2088[/C][C] 119.8[/C][/ROW]
[ROW][C]46[/C][C] 2353[/C][C] 2100[/C][C] 253.4[/C][/ROW]
[ROW][C]47[/C][C] 2151[/C][C] 2105[/C][C] 45.68[/C][/ROW]
[ROW][C]48[/C][C] 2307[/C][C] 2139[/C][C] 167.5[/C][/ROW]
[ROW][C]49[/C][C] 1826[/C][C] 2189[/C][C]-363[/C][/ROW]
[ROW][C]50[/C][C] 2414[/C][C] 2165[/C][C] 248.5[/C][/ROW]
[ROW][C]51[/C][C] 2029[/C][C] 2183[/C][C]-154.1[/C][/ROW]
[ROW][C]52[/C][C] 2091[/C][C] 2154[/C][C]-62.67[/C][/ROW]
[ROW][C]53[/C][C] 1988[/C][C] 2219[/C][C]-231.4[/C][/ROW]
[ROW][C]54[/C][C] 2484[/C][C] 2194[/C][C] 289.7[/C][/ROW]
[ROW][C]55[/C][C] 2321[/C][C] 2213[/C][C] 107.9[/C][/ROW]
[ROW][C]56[/C][C] 2614[/C][C] 2232[/C][C] 382[/C][/ROW]
[/TABLE]
Source: https://freestatistics.org/blog/index.php?pk=285439&T=4

Globally Unique Identifier (entire table): ba.freestatistics.org/blog/index.php?pk=285439&T=4

As an alternative you can also use a QR Code:  

The GUIDs for individual cells are displayed in the table below:

Multiple Linear Regression - Actuals, Interpolation, and Residuals
Time or IndexActualsInterpolationForecastResidualsPrediction Error
1 1554 1435 119.4
2 1994 1446 548.2
3 1961 1464 496.6
4 1716 1464 251.6
5 1425 1495-70.47
6 1664 1515 148.9
7 1524 1523 1.01
8 1342 1531-188.9
9 1449 1522-73.33
10 1622 1539 83.27
11 1530 1535-4.633
12 1385 1514-129.1
13 1117 1531-414.4
14 1253 1523-269.9
15 1088 1728-639.6
16 1167 1740-573.3
17 1344 1520-176.1
18 1745 1534 211.5
19 1559 1466 92.57
20 1395 1489-93.79
21 1521 1499 21.68
22 1890 1467 422.8
23 1531 1476 54.6
24 1635 1453 181.5
25 1269 1802-533.4
26 1612 1991-379.1
27 1343 1845-501.9
28 1634 1840-206.2
29 1571 1851-280.4
30 1881 1837 44.29
31 1528 1822-294
32 1960 1783 177.3
33 1676 1800-124.2
34 2166 1795 370.9
35 1663 1780-116.9
36 2067 1815 251.6
37 1801 2017-216.1
38 2347 2070 276.8
39 1938 2049-111
40 1980 2097-116.7
41 2097 2053 43.92
42 2579 2075 504
43 2191 2135 55.83
44 2449 2097 352.1
45 2208 2088 119.8
46 2353 2100 253.4
47 2151 2105 45.68
48 2307 2139 167.5
49 1826 2189-363
50 2414 2165 248.5
51 2029 2183-154.1
52 2091 2154-62.67
53 1988 2219-231.4
54 2484 2194 289.7
55 2321 2213 107.9
56 2614 2232 382


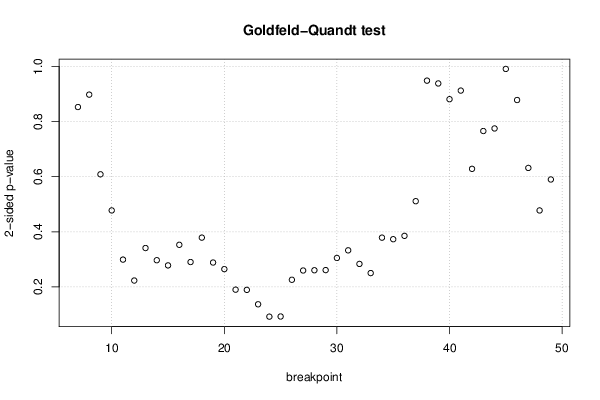
Goldfeld-Quandt test for Heteroskedasticity
p-valuesAlternative Hypothesis
breakpoint indexgreater2-sidedless
7 0.5734 0.8531 0.4266
8 0.449 0.8981 0.551
9 0.3044 0.6089 0.6956
10 0.2389 0.4777 0.7611
11 0.1496 0.2992 0.8504
12 0.1116 0.2232 0.8884
13 0.1706 0.3412 0.8294
14 0.1485 0.2969 0.8515
15 0.1391 0.2782 0.8609
16 0.1764 0.3529 0.8236
17 0.1452 0.2904 0.8548
18 0.1895 0.3789 0.8105
19 0.1443 0.2886 0.8557
20 0.1323 0.2646 0.8677
21 0.09501 0.19 0.905
22 0.09464 0.1893 0.9054
23 0.06851 0.137 0.9315
24 0.04604 0.09208 0.954
25 0.04631 0.09263 0.9537
26 0.113 0.2259 0.887
27 0.1298 0.2596 0.8702
28 0.1303 0.2605 0.8697
29 0.1305 0.2611 0.8695
30 0.1526 0.3051 0.8474
31 0.1664 0.3328 0.8336
32 0.1418 0.2835 0.8582
33 0.1251 0.2503 0.8749
34 0.1894 0.3789 0.8106
35 0.1866 0.3732 0.8134
36 0.1927 0.3855 0.8073
37 0.2556 0.5112 0.7444
38 0.5256 0.9488 0.4744
39 0.5307 0.9386 0.4693
40 0.5593 0.8814 0.4407
41 0.5436 0.9128 0.4564
42 0.6857 0.6286 0.3143
43 0.617 0.766 0.383
44 0.6124 0.7753 0.3876
45 0.5043 0.9913 0.4957
46 0.4393 0.8786 0.5607
47 0.316 0.632 0.684
48 0.2388 0.4776 0.7612
49 0.295 0.59 0.705

\begin{tabular}{lllllllll}
\hline
Goldfeld-Quandt test for Heteroskedasticity \tabularnewline
p-values & Alternative Hypothesis \tabularnewline
breakpoint index & greater & 2-sided & less \tabularnewline
7 &  0.5734 &  0.8531 &  0.4266 \tabularnewline
8 &  0.449 &  0.8981 &  0.551 \tabularnewline
9 &  0.3044 &  0.6089 &  0.6956 \tabularnewline
10 &  0.2389 &  0.4777 &  0.7611 \tabularnewline
11 &  0.1496 &  0.2992 &  0.8504 \tabularnewline
12 &  0.1116 &  0.2232 &  0.8884 \tabularnewline
13 &  0.1706 &  0.3412 &  0.8294 \tabularnewline
14 &  0.1485 &  0.2969 &  0.8515 \tabularnewline
15 &  0.1391 &  0.2782 &  0.8609 \tabularnewline
16 &  0.1764 &  0.3529 &  0.8236 \tabularnewline
17 &  0.1452 &  0.2904 &  0.8548 \tabularnewline
18 &  0.1895 &  0.3789 &  0.8105 \tabularnewline
19 &  0.1443 &  0.2886 &  0.8557 \tabularnewline
20 &  0.1323 &  0.2646 &  0.8677 \tabularnewline
21 &  0.09501 &  0.19 &  0.905 \tabularnewline
22 &  0.09464 &  0.1893 &  0.9054 \tabularnewline
23 &  0.06851 &  0.137 &  0.9315 \tabularnewline
24 &  0.04604 &  0.09208 &  0.954 \tabularnewline
25 &  0.04631 &  0.09263 &  0.9537 \tabularnewline
26 &  0.113 &  0.2259 &  0.887 \tabularnewline
27 &  0.1298 &  0.2596 &  0.8702 \tabularnewline
28 &  0.1303 &  0.2605 &  0.8697 \tabularnewline
29 &  0.1305 &  0.2611 &  0.8695 \tabularnewline
30 &  0.1526 &  0.3051 &  0.8474 \tabularnewline
31 &  0.1664 &  0.3328 &  0.8336 \tabularnewline
32 &  0.1418 &  0.2835 &  0.8582 \tabularnewline
33 &  0.1251 &  0.2503 &  0.8749 \tabularnewline
34 &  0.1894 &  0.3789 &  0.8106 \tabularnewline
35 &  0.1866 &  0.3732 &  0.8134 \tabularnewline
36 &  0.1927 &  0.3855 &  0.8073 \tabularnewline
37 &  0.2556 &  0.5112 &  0.7444 \tabularnewline
38 &  0.5256 &  0.9488 &  0.4744 \tabularnewline
39 &  0.5307 &  0.9386 &  0.4693 \tabularnewline
40 &  0.5593 &  0.8814 &  0.4407 \tabularnewline
41 &  0.5436 &  0.9128 &  0.4564 \tabularnewline
42 &  0.6857 &  0.6286 &  0.3143 \tabularnewline
43 &  0.617 &  0.766 &  0.383 \tabularnewline
44 &  0.6124 &  0.7753 &  0.3876 \tabularnewline
45 &  0.5043 &  0.9913 &  0.4957 \tabularnewline
46 &  0.4393 &  0.8786 &  0.5607 \tabularnewline
47 &  0.316 &  0.632 &  0.684 \tabularnewline
48 &  0.2388 &  0.4776 &  0.7612 \tabularnewline
49 &  0.295 &  0.59 &  0.705 \tabularnewline
\hline
\end{tabular}
%Source: https://freestatistics.org/blog/index.php?pk=285439&T=5

[TABLE]
[ROW][C]Goldfeld-Quandt test for Heteroskedasticity[/C][/ROW]
[ROW][C]p-values[/C][C]Alternative Hypothesis[/C][/ROW]
[ROW][C]breakpoint index[/C][C]greater[/C][C]2-sided[/C][C]less[/C][/ROW]
[ROW][C]7[/C][C] 0.5734[/C][C] 0.8531[/C][C] 0.4266[/C][/ROW]
[ROW][C]8[/C][C] 0.449[/C][C] 0.8981[/C][C] 0.551[/C][/ROW]
[ROW][C]9[/C][C] 0.3044[/C][C] 0.6089[/C][C] 0.6956[/C][/ROW]
[ROW][C]10[/C][C] 0.2389[/C][C] 0.4777[/C][C] 0.7611[/C][/ROW]
[ROW][C]11[/C][C] 0.1496[/C][C] 0.2992[/C][C] 0.8504[/C][/ROW]
[ROW][C]12[/C][C] 0.1116[/C][C] 0.2232[/C][C] 0.8884[/C][/ROW]
[ROW][C]13[/C][C] 0.1706[/C][C] 0.3412[/C][C] 0.8294[/C][/ROW]
[ROW][C]14[/C][C] 0.1485[/C][C] 0.2969[/C][C] 0.8515[/C][/ROW]
[ROW][C]15[/C][C] 0.1391[/C][C] 0.2782[/C][C] 0.8609[/C][/ROW]
[ROW][C]16[/C][C] 0.1764[/C][C] 0.3529[/C][C] 0.8236[/C][/ROW]
[ROW][C]17[/C][C] 0.1452[/C][C] 0.2904[/C][C] 0.8548[/C][/ROW]
[ROW][C]18[/C][C] 0.1895[/C][C] 0.3789[/C][C] 0.8105[/C][/ROW]
[ROW][C]19[/C][C] 0.1443[/C][C] 0.2886[/C][C] 0.8557[/C][/ROW]
[ROW][C]20[/C][C] 0.1323[/C][C] 0.2646[/C][C] 0.8677[/C][/ROW]
[ROW][C]21[/C][C] 0.09501[/C][C] 0.19[/C][C] 0.905[/C][/ROW]
[ROW][C]22[/C][C] 0.09464[/C][C] 0.1893[/C][C] 0.9054[/C][/ROW]
[ROW][C]23[/C][C] 0.06851[/C][C] 0.137[/C][C] 0.9315[/C][/ROW]
[ROW][C]24[/C][C] 0.04604[/C][C] 0.09208[/C][C] 0.954[/C][/ROW]
[ROW][C]25[/C][C] 0.04631[/C][C] 0.09263[/C][C] 0.9537[/C][/ROW]
[ROW][C]26[/C][C] 0.113[/C][C] 0.2259[/C][C] 0.887[/C][/ROW]
[ROW][C]27[/C][C] 0.1298[/C][C] 0.2596[/C][C] 0.8702[/C][/ROW]
[ROW][C]28[/C][C] 0.1303[/C][C] 0.2605[/C][C] 0.8697[/C][/ROW]
[ROW][C]29[/C][C] 0.1305[/C][C] 0.2611[/C][C] 0.8695[/C][/ROW]
[ROW][C]30[/C][C] 0.1526[/C][C] 0.3051[/C][C] 0.8474[/C][/ROW]
[ROW][C]31[/C][C] 0.1664[/C][C] 0.3328[/C][C] 0.8336[/C][/ROW]
[ROW][C]32[/C][C] 0.1418[/C][C] 0.2835[/C][C] 0.8582[/C][/ROW]
[ROW][C]33[/C][C] 0.1251[/C][C] 0.2503[/C][C] 0.8749[/C][/ROW]
[ROW][C]34[/C][C] 0.1894[/C][C] 0.3789[/C][C] 0.8106[/C][/ROW]
[ROW][C]35[/C][C] 0.1866[/C][C] 0.3732[/C][C] 0.8134[/C][/ROW]
[ROW][C]36[/C][C] 0.1927[/C][C] 0.3855[/C][C] 0.8073[/C][/ROW]
[ROW][C]37[/C][C] 0.2556[/C][C] 0.5112[/C][C] 0.7444[/C][/ROW]
[ROW][C]38[/C][C] 0.5256[/C][C] 0.9488[/C][C] 0.4744[/C][/ROW]
[ROW][C]39[/C][C] 0.5307[/C][C] 0.9386[/C][C] 0.4693[/C][/ROW]
[ROW][C]40[/C][C] 0.5593[/C][C] 0.8814[/C][C] 0.4407[/C][/ROW]
[ROW][C]41[/C][C] 0.5436[/C][C] 0.9128[/C][C] 0.4564[/C][/ROW]
[ROW][C]42[/C][C] 0.6857[/C][C] 0.6286[/C][C] 0.3143[/C][/ROW]
[ROW][C]43[/C][C] 0.617[/C][C] 0.766[/C][C] 0.383[/C][/ROW]
[ROW][C]44[/C][C] 0.6124[/C][C] 0.7753[/C][C] 0.3876[/C][/ROW]
[ROW][C]45[/C][C] 0.5043[/C][C] 0.9913[/C][C] 0.4957[/C][/ROW]
[ROW][C]46[/C][C] 0.4393[/C][C] 0.8786[/C][C] 0.5607[/C][/ROW]
[ROW][C]47[/C][C] 0.316[/C][C] 0.632[/C][C] 0.684[/C][/ROW]
[ROW][C]48[/C][C] 0.2388[/C][C] 0.4776[/C][C] 0.7612[/C][/ROW]
[ROW][C]49[/C][C] 0.295[/C][C] 0.59[/C][C] 0.705[/C][/ROW]
[/TABLE]
Source: https://freestatistics.org/blog/index.php?pk=285439&T=5

Globally Unique Identifier (entire table): ba.freestatistics.org/blog/index.php?pk=285439&T=5

As an alternative you can also use a QR Code:  

The GUIDs for individual cells are displayed in the table below:

Goldfeld-Quandt test for Heteroskedasticity
p-valuesAlternative Hypothesis
breakpoint indexgreater2-sidedless
7 0.5734 0.8531 0.4266
8 0.449 0.8981 0.551
9 0.3044 0.6089 0.6956
10 0.2389 0.4777 0.7611
11 0.1496 0.2992 0.8504
12 0.1116 0.2232 0.8884
13 0.1706 0.3412 0.8294
14 0.1485 0.2969 0.8515
15 0.1391 0.2782 0.8609
16 0.1764 0.3529 0.8236
17 0.1452 0.2904 0.8548
18 0.1895 0.3789 0.8105
19 0.1443 0.2886 0.8557
20 0.1323 0.2646 0.8677
21 0.09501 0.19 0.905
22 0.09464 0.1893 0.9054
23 0.06851 0.137 0.9315
24 0.04604 0.09208 0.954
25 0.04631 0.09263 0.9537
26 0.113 0.2259 0.887
27 0.1298 0.2596 0.8702
28 0.1303 0.2605 0.8697
29 0.1305 0.2611 0.8695
30 0.1526 0.3051 0.8474
31 0.1664 0.3328 0.8336
32 0.1418 0.2835 0.8582
33 0.1251 0.2503 0.8749
34 0.1894 0.3789 0.8106
35 0.1866 0.3732 0.8134
36 0.1927 0.3855 0.8073
37 0.2556 0.5112 0.7444
38 0.5256 0.9488 0.4744
39 0.5307 0.9386 0.4693
40 0.5593 0.8814 0.4407
41 0.5436 0.9128 0.4564
42 0.6857 0.6286 0.3143
43 0.617 0.766 0.383
44 0.6124 0.7753 0.3876
45 0.5043 0.9913 0.4957
46 0.4393 0.8786 0.5607
47 0.316 0.632 0.684
48 0.2388 0.4776 0.7612
49 0.295 0.59 0.705


Meta Analysis of Goldfeld-Quandt test for Heteroskedasticity
Description# significant tests% significant testsOK/NOK
1% type I error level0 0OK
5% type I error level00OK
10% type I error level20.0465116OK

\begin{tabular}{lllllllll}
\hline
Meta Analysis of Goldfeld-Quandt test for Heteroskedasticity \tabularnewline
Description & # significant tests & % significant tests & OK/NOK \tabularnewline
1% type I error level & 0 &  0 & OK \tabularnewline
5% type I error level & 0 & 0 & OK \tabularnewline
10% type I error level & 2 & 0.0465116 & OK \tabularnewline
\hline
\end{tabular}
%Source: https://freestatistics.org/blog/index.php?pk=285439&T=6

[TABLE]
[ROW][C]Meta Analysis of Goldfeld-Quandt test for Heteroskedasticity[/C][/ROW]
[ROW][C]Description[/C][C]# significant tests[/C][C]% significant tests[/C][C]OK/NOK[/C][/ROW]
[ROW][C]1% type I error level[/C][C]0[/C][C] 0[/C][C]OK[/C][/ROW]
[ROW][C]5% type I error level[/C][C]0[/C][C]0[/C][C]OK[/C][/ROW]
[ROW][C]10% type I error level[/C][C]2[/C][C]0.0465116[/C][C]OK[/C][/ROW]
[/TABLE]
Source: https://freestatistics.org/blog/index.php?pk=285439&T=6

Globally Unique Identifier (entire table): ba.freestatistics.org/blog/index.php?pk=285439&T=6

As an alternative you can also use a QR Code:  

The GUIDs for individual cells are displayed in the table below:

Meta Analysis of Goldfeld-Quandt test for Heteroskedasticity
Description# significant tests% significant testsOK/NOK
1% type I error level0 0OK
5% type I error level00OK
10% type I error level20.0465116OK


Parameters (Session):
par1 = 1 ; par2 = Do not include Seasonal Dummies ; par3 = No Linear Trend ; par4 = 0 ; par5 = 0 ;
Parameters (R input):
par1 = 1 ; par2 = Do not include Seasonal Dummies ; par3 = No Linear Trend ; par4 = 0 ; par5 = 0 ;
R code (references can be found in the software module):
library(lattice)
library(lmtest)
n25 <- 25 #minimum number of obs. for Goldfeld-Quandt test
mywarning <- ''
par1 <- as.numeric(par1)
if(is.na(par1)) {
par1 <- 1
mywarning = 'Warning: you did not specify the column number of the endogenous series! The first column was selected by default.'
}
if (par4=='') par4 <- 0
par4 <- as.numeric(par4)
if (par5=='') par5 <- 0
par5 <- as.numeric(par5)
x <- na.omit(t(y))
k <- length(x[1,])
n <- length(x[,1])
x1 <- cbind(x[,par1], x[,1:k!=par1])
mycolnames <- c(colnames(x)[par1], colnames(x)[1:k!=par1])
colnames(x1) <- mycolnames #colnames(x)[par1]
x <- x1
if (par3 == 'First Differences'){
(n <- n -1)
x2 <- array(0, dim=c(n,k), dimnames=list(1:n, paste('(1-B)',colnames(x),sep='')))
for (i in 1:n) {
for (j in 1:k) {
x2[i,j] <- x[i+1,j] - x[i,j]
}
}
x <- x2
}
if (par3 == 'Seasonal Differences (s=12)'){
(n <- n - 12)
x2 <- array(0, dim=c(n,k), dimnames=list(1:n, paste('(1-B12)',colnames(x),sep='')))
for (i in 1:n) {
for (j in 1:k) {
x2[i,j] <- x[i+12,j] - x[i,j]
}
}
x <- x2
}
if (par3 == 'First and Seasonal Differences (s=12)'){
(n <- n -1)
x2 <- array(0, dim=c(n,k), dimnames=list(1:n, paste('(1-B)',colnames(x),sep='')))
for (i in 1:n) {
for (j in 1:k) {
x2[i,j] <- x[i+1,j] - x[i,j]
}
}
x <- x2
(n <- n - 12)
x2 <- array(0, dim=c(n,k), dimnames=list(1:n, paste('(1-B12)',colnames(x),sep='')))
for (i in 1:n) {
for (j in 1:k) {
x2[i,j] <- x[i+12,j] - x[i,j]
}
}
x <- x2
}
if(par4 > 0) {
x2 <- array(0, dim=c(n-par4,par4), dimnames=list(1:(n-par4), paste(colnames(x)[par1],'(t-',1:par4,')',sep='')))
for (i in 1:(n-par4)) {
for (j in 1:par4) {
x2[i,j] <- x[i+par4-j,par1]
}
}
x <- cbind(x[(par4+1):n,], x2)
n <- n - par4
}
if(par5 > 0) {
x2 <- array(0, dim=c(n-par5*12,par5), dimnames=list(1:(n-par5*12), paste(colnames(x)[par1],'(t-',1:par5,'s)',sep='')))
for (i in 1:(n-par5*12)) {
for (j in 1:par5) {
x2[i,j] <- x[i+par5*12-j*12,par1]
}
}
x <- cbind(x[(par5*12+1):n,], x2)
n <- n - par5*12
}
if (par2 == 'Include Monthly Dummies'){
x2 <- array(0, dim=c(n,11), dimnames=list(1:n, paste('M', seq(1:11), sep ='')))
for (i in 1:11){
x2[seq(i,n,12),i] <- 1
}
x <- cbind(x, x2)
}
if (par2 == 'Include Quarterly Dummies'){
x2 <- array(0, dim=c(n,3), dimnames=list(1:n, paste('Q', seq(1:3), sep ='')))
for (i in 1:3){
x2[seq(i,n,4),i] <- 1
}
x <- cbind(x, x2)
}
(k <- length(x[n,]))
if (par3 == 'Linear Trend'){
x <- cbind(x, c(1:n))
colnames(x)[k+1] <- 't'
}
x
(k <- length(x[n,]))
head(x)
df <- as.data.frame(x)
(mylm <- lm(df))
(mysum <- summary(mylm))
if (n > n25) {
kp3 <- k + 3
nmkm3 <- n - k - 3
gqarr <- array(NA, dim=c(nmkm3-kp3+1,3))
numgqtests <- 0
numsignificant1 <- 0
numsignificant5 <- 0
numsignificant10 <- 0
for (mypoint in kp3:nmkm3) {
j <- 0
numgqtests <- numgqtests + 1
for (myalt in c('greater', 'two.sided', 'less')) {
j <- j + 1
gqarr[mypoint-kp3+1,j] <- gqtest(mylm, point=mypoint, alternative=myalt)$p.value
}
if (gqarr[mypoint-kp3+1,2] < 0.01) numsignificant1 <- numsignificant1 + 1
if (gqarr[mypoint-kp3+1,2] < 0.05) numsignificant5 <- numsignificant5 + 1
if (gqarr[mypoint-kp3+1,2] < 0.10) numsignificant10 <- numsignificant10 + 1
}
gqarr
}
bitmap(file='test0.png')
plot(x[,1], type='l', main='Actuals and Interpolation', ylab='value of Actuals and Interpolation (dots)', xlab='time or index')
points(x[,1]-mysum$resid)
grid()
dev.off()
bitmap(file='test1.png')
plot(mysum$resid, type='b', pch=19, main='Residuals', ylab='value of Residuals', xlab='time or index')
grid()
dev.off()
bitmap(file='test2.png')
hist(mysum$resid, main='Residual Histogram', xlab='values of Residuals')
grid()
dev.off()
bitmap(file='test3.png')
densityplot(~mysum$resid,col='black',main='Residual Density Plot', xlab='values of Residuals')
dev.off()
bitmap(file='test4.png')
qqnorm(mysum$resid, main='Residual Normal Q-Q Plot')
qqline(mysum$resid)
grid()
dev.off()
(myerror <- as.ts(mysum$resid))
bitmap(file='test5.png')
dum <- cbind(lag(myerror,k=1),myerror)
dum
dum1 <- dum[2:length(myerror),]
dum1
z <- as.data.frame(dum1)
z
plot(z,main=paste('Residual Lag plot, lowess, and regression line'), ylab='values of Residuals', xlab='lagged values of Residuals')
lines(lowess(z))
abline(lm(z))
grid()
dev.off()
bitmap(file='test6.png')
acf(mysum$resid, lag.max=length(mysum$resid)/2, main='Residual Autocorrelation Function')
grid()
dev.off()
bitmap(file='test7.png')
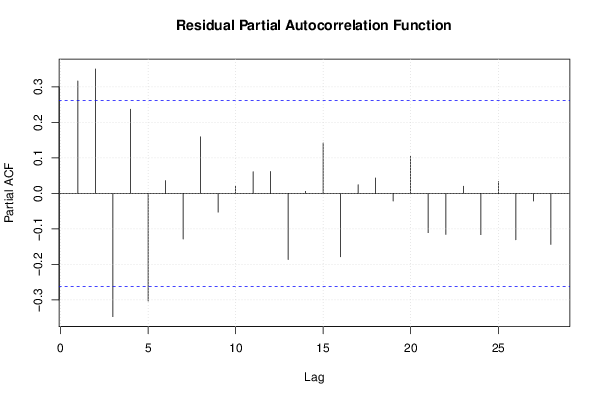
pacf(mysum$resid, lag.max=length(mysum$resid)/2, main='Residual Partial Autocorrelation Function')
grid()
dev.off()
bitmap(file='test8.png')
opar <- par(mfrow = c(2,2), oma = c(0, 0, 1.1, 0))
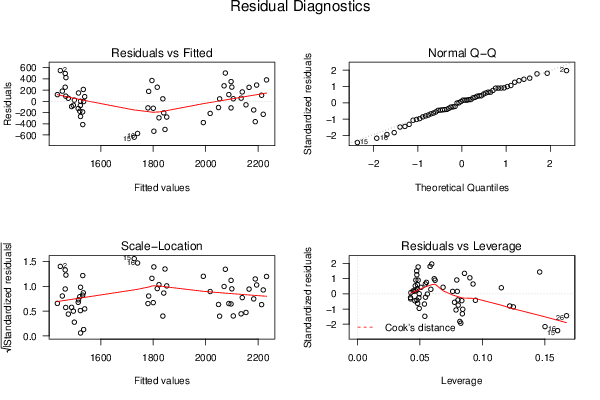
plot(mylm, las = 1, sub='Residual Diagnostics')
par(opar)
dev.off()
if (n > n25) {
bitmap(file='test9.png')
plot(kp3:nmkm3,gqarr[,2], main='Goldfeld-Quandt test',ylab='2-sided p-value',xlab='breakpoint')
grid()
dev.off()
}
load(file='createtable')
a<-table.start()
a<-table.row.start(a)
a<-table.element(a, 'Multiple Linear Regression - Estimated Regression Equation', 1, TRUE)
a<-table.row.end(a)
myeq <- colnames(x)[1]
myeq <- paste(myeq, '[t] = ', sep='')
for (i in 1:k){
if (mysum$coefficients[i,1] > 0) myeq <- paste(myeq, '+', '')
myeq <- paste(myeq, signif(mysum$coefficients[i,1],6), sep=' ')
if (rownames(mysum$coefficients)[i] != '(Intercept)') {
myeq <- paste(myeq, rownames(mysum$coefficients)[i], sep='')
if (rownames(mysum$coefficients)[i] != 't') myeq <- paste(myeq, '[t]', sep='')
}
}
myeq <- paste(myeq, ' + e[t]')
a<-table.row.start(a)
a<-table.element(a, myeq)
a<-table.row.end(a)
a<-table.row.start(a)
a<-table.element(a, mywarning)
a<-table.row.end(a)
a<-table.end(a)
table.save(a,file='mytable1.tab')
a<-table.start()
a<-table.row.start(a)
a<-table.element(a,hyperlink('ols1.htm','Multiple Linear Regression - Ordinary Least Squares',''), 6, TRUE)
a<-table.row.end(a)
a<-table.row.start(a)
a<-table.element(a,'Variable',header=TRUE)
a<-table.element(a,'Parameter',header=TRUE)
a<-table.element(a,'S.D.',header=TRUE)
a<-table.element(a,'T-STAT
H0: parameter = 0',header=TRUE)
a<-table.element(a,'2-tail p-value',header=TRUE)
a<-table.element(a,'1-tail p-value',header=TRUE)
a<-table.row.end(a)
for (i in 1:k){
a<-table.row.start(a)
a<-table.element(a,rownames(mysum$coefficients)[i],header=TRUE)
a<-table.element(a,formatC(signif(mysum$coefficients[i,1],5),format='g',flag='+'))
a<-table.element(a,formatC(signif(mysum$coefficients[i,2],5),format='g',flag=' '))
a<-table.element(a,formatC(signif(mysum$coefficients[i,3],4),format='e',flag='+'))
a<-table.element(a,formatC(signif(mysum$coefficients[i,4],4),format='g',flag=' '))
a<-table.element(a,formatC(signif(mysum$coefficients[i,4]/2,4),format='g',flag=' '))
a<-table.row.end(a)
}
a<-table.end(a)
table.save(a,file='mytable2.tab')
a<-table.start()
a<-table.row.start(a)
a<-table.element(a, 'Multiple Linear Regression - Regression Statistics', 2, TRUE)
a<-table.row.end(a)
a<-table.row.start(a)
a<-table.element(a, 'Multiple R',1,TRUE)
a<-table.element(a,formatC(signif(sqrt(mysum$r.squared),6),format='g',flag=' '))
a<-table.row.end(a)
a<-table.row.start(a)
a<-table.element(a, 'R-squared',1,TRUE)
a<-table.element(a,formatC(signif(mysum$r.squared,6),format='g',flag=' '))
a<-table.row.end(a)
a<-table.row.start(a)
a<-table.element(a, 'Adjusted R-squared',1,TRUE)
a<-table.element(a,formatC(signif(mysum$adj.r.squared,6),format='g',flag=' '))
a<-table.row.end(a)
a<-table.row.start(a)
a<-table.element(a, 'F-TEST (value)',1,TRUE)
a<-table.element(a,formatC(signif(mysum$fstatistic[1],6),format='g',flag=' '))
a<-table.row.end(a)
a<-table.row.start(a)
a<-table.element(a, 'F-TEST (DF numerator)',1,TRUE)
a<-table.element(a, signif(mysum$fstatistic[2],6))
a<-table.row.end(a)
a<-table.row.start(a)
a<-table.element(a, 'F-TEST (DF denominator)',1,TRUE)
a<-table.element(a, signif(mysum$fstatistic[3],6))
a<-table.row.end(a)
a<-table.row.start(a)
a<-table.element(a, 'p-value',1,TRUE)
a<-table.element(a,formatC(signif(1-pf(mysum$fstatistic[1],mysum$fstatistic[2],mysum$fstatistic[3]),6),format='g',flag=' '))
a<-table.row.end(a)
a<-table.row.start(a)
a<-table.element(a, 'Multiple Linear Regression - Residual Statistics', 2, TRUE)
a<-table.row.end(a)
a<-table.row.start(a)
a<-table.element(a, 'Residual Standard Deviation',1,TRUE)
a<-table.element(a,formatC(signif(mysum$sigma,6),format='g',flag=' '))
a<-table.row.end(a)
a<-table.row.start(a)
a<-table.element(a, 'Sum Squared Residuals',1,TRUE)
a<-table.element(a,formatC(signif(sum(myerror*myerror),6),format='g',flag=' '))
a<-table.row.end(a)
a<-table.end(a)
table.save(a,file='mytable3.tab')
if(n < 200) {
a<-table.start()
a<-table.row.start(a)
a<-table.element(a, 'Multiple Linear Regression - Actuals, Interpolation, and Residuals', 4, TRUE)
a<-table.row.end(a)
a<-table.row.start(a)
a<-table.element(a, 'Time or Index', 1, TRUE)
a<-table.element(a, 'Actuals', 1, TRUE)
a<-table.element(a, 'Interpolation
Forecast', 1, TRUE)
a<-table.element(a, 'Residuals
Prediction Error', 1, TRUE)
a<-table.row.end(a)
for (i in 1:n) {
a<-table.row.start(a)
a<-table.element(a,i, 1, TRUE)
a<-table.element(a,formatC(signif(x[i],6),format='g',flag=' '))
a<-table.element(a,formatC(signif(x[i]-mysum$resid[i],6),format='g',flag=' '))
a<-table.element(a,formatC(signif(mysum$resid[i],6),format='g',flag=' '))
a<-table.row.end(a)
}
a<-table.end(a)
table.save(a,file='mytable4.tab')
if (n > n25) {
a<-table.start()
a<-table.row.start(a)
a<-table.element(a,'Goldfeld-Quandt test for Heteroskedasticity',4,TRUE)
a<-table.row.end(a)
a<-table.row.start(a)
a<-table.element(a,'p-values',header=TRUE)
a<-table.element(a,'Alternative Hypothesis',3,header=TRUE)
a<-table.row.end(a)
a<-table.row.start(a)
a<-table.element(a,'breakpoint index',header=TRUE)
a<-table.element(a,'greater',header=TRUE)
a<-table.element(a,'2-sided',header=TRUE)
a<-table.element(a,'less',header=TRUE)
a<-table.row.end(a)
for (mypoint in kp3:nmkm3) {
a<-table.row.start(a)
a<-table.element(a,mypoint,header=TRUE)
a<-table.element(a,formatC(signif(gqarr[mypoint-kp3+1,1],6),format='g',flag=' '))
a<-table.element(a,formatC(signif(gqarr[mypoint-kp3+1,2],6),format='g',flag=' '))
a<-table.element(a,formatC(signif(gqarr[mypoint-kp3+1,3],6),format='g',flag=' '))
a<-table.row.end(a)
}
a<-table.end(a)
table.save(a,file='mytable5.tab')
a<-table.start()
a<-table.row.start(a)
a<-table.element(a,'Meta Analysis of Goldfeld-Quandt test for Heteroskedasticity',4,TRUE)
a<-table.row.end(a)
a<-table.row.start(a)
a<-table.element(a,'Description',header=TRUE)
a<-table.element(a,'# significant tests',header=TRUE)
a<-table.element(a,'% significant tests',header=TRUE)
a<-table.element(a,'OK/NOK',header=TRUE)
a<-table.row.end(a)
a<-table.row.start(a)
a<-table.element(a,'1% type I error level',header=TRUE)
a<-table.element(a,signif(numsignificant1,6))
a<-table.element(a,formatC(signif(numsignificant1/numgqtests,6),format='g',flag=' '))
if (numsignificant1/numgqtests < 0.01) dum <- 'OK' else dum <- 'NOK'
a<-table.element(a,dum)
a<-table.row.end(a)
a<-table.row.start(a)
a<-table.element(a,'5% type I error level',header=TRUE)
a<-table.element(a,signif(numsignificant5,6))
a<-table.element(a,signif(numsignificant5/numgqtests,6))
if (numsignificant5/numgqtests < 0.05) dum <- 'OK' else dum <- 'NOK'
a<-table.element(a,dum)
a<-table.row.end(a)
a<-table.row.start(a)
a<-table.element(a,'10% type I error level',header=TRUE)
a<-table.element(a,signif(numsignificant10,6))
a<-table.element(a,signif(numsignificant10/numgqtests,6))
if (numsignificant10/numgqtests < 0.1) dum <- 'OK' else dum <- 'NOK'
a<-table.element(a,dum)
a<-table.row.end(a)
a<-table.end(a)
table.save(a,file='mytable6.tab')
}
}