Free Statistics

of Irreproducible Research!

Author's title

Author*The author of this computation has been verified*
R Software Modulerwasp_fitdistrnorm.wasp
Title produced by softwareML Fitting and QQ Plot- Normal Distribution
Date of computationTue, 08 Dec 2015 13:04:11 +0000
Cite this page as followsStatistical Computations at FreeStatistics.org, Office for Research Development and Education, URL https://freestatistics.org/blog/index.php?v=date/2015/Dec/08/t1449579887dmcfmwzu38eq3h8.htm/, Retrieved Thu, 16 May 2024 18:59:08 +0000
Statistical Computations at FreeStatistics.org, Office for Research Development and Education, URL https://freestatistics.org/blog/index.php?pk=285482, Retrieved Thu, 16 May 2024 18:59:08 +0000
QR Codes:

Original text written by user:
IsPrivate?No (this computation is public)
User-defined keywords
Estimated Impact107
Family? (F = Feedback message, R = changed R code, M = changed R Module, P = changed Parameters, D = changed Data)
-       [ML Fitting and QQ Plot- Normal Distribution] [histogram - nett ...] [2015-12-08 13:04:11] [7443f9c3a4ea307db518db9722d98183] [Current]
Feedback Forum

Post a new message
Dataseries X:
231
156
10
519
437
487
299
195
20
68
570
428
464
15
65
98
398
161
397
497
528
99
0.5
347
341
507
400


Summary of computational transaction
Raw Inputview raw input (R code)
Raw Outputview raw output of R engine
Computing time3 seconds
R Server'Herman Ole Andreas Wold' @ wold.wessa.net

\begin{tabular}{lllllllll}
\hline
Summary of computational transaction \tabularnewline
Raw Input & view raw input (R code)  \tabularnewline
Raw Output & view raw output of R engine  \tabularnewline
Computing time & 3 seconds \tabularnewline
R Server & 'Herman Ole Andreas Wold' @ wold.wessa.net \tabularnewline
\hline
\end{tabular}
%Source: https://freestatistics.org/blog/index.php?pk=285482&T=0

[TABLE]
[ROW][C]Summary of computational transaction[/C][/ROW]
[ROW][C]Raw Input[/C][C]view raw input (R code) [/C][/ROW]
[ROW][C]Raw Output[/C][C]view raw output of R engine [/C][/ROW]
[ROW][C]Computing time[/C][C]3 seconds[/C][/ROW]
[ROW][C]R Server[/C][C]'Herman Ole Andreas Wold' @ wold.wessa.net[/C][/ROW]
[/TABLE]
Source: https://freestatistics.org/blog/index.php?pk=285482&T=0

Globally Unique Identifier (entire table): ba.freestatistics.org/blog/index.php?pk=285482&T=0

As an alternative you can also use a QR Code:  

The GUIDs for individual cells are displayed in the table below:

Summary of computational transaction
Raw Inputview raw input (R code)
Raw Outputview raw output of R engine
Computing time3 seconds
R Server'Herman Ole Andreas Wold' @ wold.wessa.net


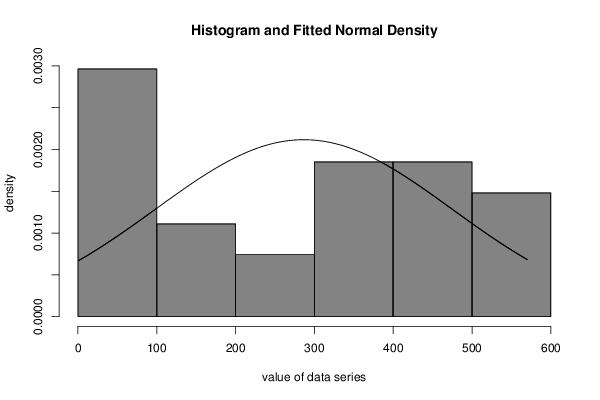
ParameterEstimated ValueStandard Deviation
mean286.57407407407436.2713510623751
standard deviation188.47146869760325.6477182990033

\begin{tabular}{lllllllll}
\hline
Parameter & Estimated Value & Standard Deviation \tabularnewline
mean & 286.574074074074 & 36.2713510623751 \tabularnewline
standard deviation & 188.471468697603 & 25.6477182990033 \tabularnewline
\hline
\end{tabular}
%Source: https://freestatistics.org/blog/index.php?pk=285482&T=1

[TABLE]
[ROW][C]Parameter[/C][C]Estimated Value[/C][C]Standard Deviation[/C][/ROW]
[ROW][C]mean[/C][C]286.574074074074[/C][C]36.2713510623751[/C][/ROW]
[ROW][C]standard deviation[/C][C]188.471468697603[/C][C]25.6477182990033[/C][/ROW]
[/TABLE]
Source: https://freestatistics.org/blog/index.php?pk=285482&T=1

Globally Unique Identifier (entire table): ba.freestatistics.org/blog/index.php?pk=285482&T=1

As an alternative you can also use a QR Code:  

The GUIDs for individual cells are displayed in the table below:

ParameterEstimated ValueStandard Deviation
mean286.57407407407436.2713510623751
standard deviation188.47146869760325.6477182990033


Parameters (Session):
par1 = 8 ; par2 = 0 ;
Parameters (R input):
par1 = 8 ; par2 = 0 ;
R code (references can be found in the software module):
library(MASS)
library(car)
par1 <- as.numeric(par1)
if (par2 == '0') par2 = 'Sturges' else par2 <- as.numeric(par2)
x <- as.ts(x) #otherwise the fitdistr function does not work properly
r <- fitdistr(x,'normal')
r
bitmap(file='test1.png')
myhist<-hist(x,col=par1,breaks=par2,main=main,ylab=ylab,xlab=xlab,freq=F)
curve(1/(r$estimate[2]*sqrt(2*pi))*exp(-1/2*((x-r$estimate[1])/r$estimate[2])^2),min(x),max(x),add=T)
dev.off()
bitmap(file='test3.png')
qqPlot(x,dist='norm',main='QQ plot (Normal) with confidence intervals')
grid()
dev.off()
load(file='createtable')
a<-table.start()
a<-table.row.start(a)
a<-table.element(a,'Parameter',1,TRUE)
a<-table.element(a,'Estimated Value',1,TRUE)
a<-table.element(a,'Standard Deviation',1,TRUE)
a<-table.row.end(a)
a<-table.row.start(a)
a<-table.element(a,'mean',header=TRUE)
a<-table.element(a,r$estimate[1])
a<-table.element(a,r$sd[1])
a<-table.row.end(a)
a<-table.row.start(a)
a<-table.element(a,'standard deviation',header=TRUE)
a<-table.element(a,r$estimate[2])
a<-table.element(a,r$sd[2])
a<-table.row.end(a)
a<-table.end(a)
table.save(a,file='mytable.tab')