Free Statistics
of Irreproducible Research!
Description of Statistical Computation | |||||||||||||||||||||
|---|---|---|---|---|---|---|---|---|---|---|---|---|---|---|---|---|---|---|---|---|---|
| Author's title | |||||||||||||||||||||
| Author | *The author of this computation has been verified* | ||||||||||||||||||||
| R Software Module | rwasp_skewness_kurtosis_plot.wasp | ||||||||||||||||||||
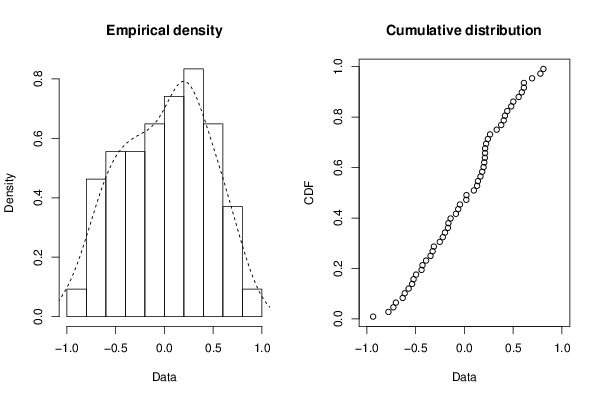
| Title produced by software | Skewness-Kurtosis Plot | ||||||||||||||||||||
| Date of computation | Wed, 09 Dec 2015 14:09:42 +0000 | ||||||||||||||||||||
| Cite this page as follows | Statistical Computations at FreeStatistics.org, Office for Research Development and Education, URL https://freestatistics.org/blog/index.php?v=date/2015/Dec/09/t14496702356pp7w5wghyw2m02.htm/, Retrieved Thu, 16 May 2024 12:57:06 +0000 | ||||||||||||||||||||
| Statistical Computations at FreeStatistics.org, Office for Research Development and Education, URL https://freestatistics.org/blog/index.php?pk=285690, Retrieved Thu, 16 May 2024 12:57:06 +0000 | |||||||||||||||||||||
| QR Codes: | |||||||||||||||||||||
|
| |||||||||||||||||||||
| Original text written by user: | |||||||||||||||||||||
| IsPrivate? | No (this computation is public) | ||||||||||||||||||||
| User-defined keywords | |||||||||||||||||||||
| Estimated Impact | 69 | ||||||||||||||||||||
Tree of Dependent Computations | |||||||||||||||||||||
| Family? (F = Feedback message, R = changed R code, M = changed R Module, P = changed Parameters, D = changed Data) | |||||||||||||||||||||
| - [Skewness-Kurtosis Plot] [] [2015-12-09 14:09:42] [fcea341501fb11a5fe375242ab163178] [Current] | |||||||||||||||||||||
| Feedback Forum | |||||||||||||||||||||
Post a new message | |||||||||||||||||||||
Dataset | |||||||||||||||||||||
| Dataseries X: | |||||||||||||||||||||
0.13 -0.2215 -0.1643 -0.495 0.5009 -0.1417 -0.2524 0.2226 0.4034 0.2117 0.1825 0.331 -0.3261 -0.4393 -0.3477 0.3771 0.02125 0.81 -0.1989 0.4799 0.2405 0.6098 -0.7785 0.1965 0.5882 -0.169 0.01908 0.2096 -0.5213 -0.08686 -0.04548 -0.6118 -0.5358 0.6098 -0.393 0.09651 -0.0633 -0.7025 0.1385 0.2124 0.6941 -0.7284 -0.3132 0.263 0.4155 -0.5716 -0.4298 -0.9356 0.5559 -0.6324 0.7787 0.1644 0.2036 0.4393 | |||||||||||||||||||||
Tables (Output of Computation) | |||||||||||||||||||||
| |||||||||||||||||||||
Figures (Output of Computation) | |||||||||||||||||||||
Input Parameters & R Code | |||||||||||||||||||||
| Parameters (Session): | |||||||||||||||||||||
| Parameters (R input): | |||||||||||||||||||||
| R code (references can be found in the software module): | |||||||||||||||||||||
library(fitdistrplus) | |||||||||||||||||||||