Free Statistics

of Irreproducible Research!

Author's title

Author*The author of this computation has been verified*
R Software Modulerwasp_multipleregression.wasp
Title produced by softwareMultiple Regression
Date of computationWed, 09 Dec 2015 15:24:31 +0000
Cite this page as followsStatistical Computations at FreeStatistics.org, Office for Research Development and Education, URL https://freestatistics.org/blog/index.php?v=date/2015/Dec/09/t1449674731z65qzbn1kgo1la2.htm/, Retrieved Thu, 16 May 2024 22:05:28 +0000
Statistical Computations at FreeStatistics.org, Office for Research Development and Education, URL https://freestatistics.org/blog/index.php?pk=285739, Retrieved Thu, 16 May 2024 22:05:28 +0000
QR Codes:

Original text written by user:
IsPrivate?No (this computation is public)
User-defined keywords
Estimated Impact61
Family? (F = Feedback message, R = changed R code, M = changed R Module, P = changed Parameters, D = changed Data)
-       [Multiple Regression] [Multiple regressi...] [2015-12-09 15:24:31] [4bfd98e85da8d65970e2f1f883f9da72] [Current]
Feedback Forum

Post a new message
Dataseries X:
112
118
132
129
121
135
148
148
136
119
104
118
115
126
141
135
125
149
170
170
158
133
114
140
145
150
178
163
172
178
199
199
184
162
146
166
171
180
193
181
183
218
230
242
209
191
172
194
196
196
236
235
229
243
264
272
237
211
180
201
204
188
235
227
234
264
302
293
259
229
203
229
242
233
267
269
270
315
364
347
312
274
237
278
284
277
317
313
318
374
413
405
355
306
271
306
315
301
356
348
355
422
465
467
404
347
305
336
340
318
362
348
363
435
491
505
404
359
310
337
360
342
406
396
420
472
548
559
463
407
362
405
417
391
419
461
472
535
622
606
508
461
390
432


Summary of computational transaction
Raw Inputview raw input (R code)
Raw Outputview raw output of R engine
Computing time5 seconds
R Server'George Udny Yule' @ yule.wessa.net

\begin{tabular}{lllllllll}
\hline
Summary of computational transaction \tabularnewline
Raw Input & view raw input (R code)  \tabularnewline
Raw Output & view raw output of R engine  \tabularnewline
Computing time & 5 seconds \tabularnewline
R Server & 'George Udny Yule' @ yule.wessa.net \tabularnewline
\hline
\end{tabular}
%Source: https://freestatistics.org/blog/index.php?pk=285739&T=0

[TABLE]
[ROW][C]Summary of computational transaction[/C][/ROW]
[ROW][C]Raw Input[/C][C]view raw input (R code) [/C][/ROW]
[ROW][C]Raw Output[/C][C]view raw output of R engine [/C][/ROW]
[ROW][C]Computing time[/C][C]5 seconds[/C][/ROW]
[ROW][C]R Server[/C][C]'George Udny Yule' @ yule.wessa.net[/C][/ROW]
[/TABLE]
Source: https://freestatistics.org/blog/index.php?pk=285739&T=0

Globally Unique Identifier (entire table): ba.freestatistics.org/blog/index.php?pk=285739&T=0

As an alternative you can also use a QR Code:  

The GUIDs for individual cells are displayed in the table below:

Summary of computational transaction
Raw Inputview raw input (R code)
Raw Outputview raw output of R engine
Computing time5 seconds
R Server'George Udny Yule' @ yule.wessa.net


Multiple Linear Regression - Estimated Regression Equation
Airline[t] = + 54.3277 + 9.18029M1[t] -0.230041M2[t] + 32.2763M3[t] + 26.5326M4[t] + 28.6223M5[t] + 65.7953M6[t] + 102.802M7[t] + 99.8913M8[t] + 48.5643M9[t] + 10.0707M10[t] -26.3397M11[t] + 2.66033t + e[t]

\begin{tabular}{lllllllll}
\hline
Multiple Linear Regression - Estimated Regression Equation \tabularnewline
Airline[t] =  +  54.3277 +  9.18029M1[t] -0.230041M2[t] +  32.2763M3[t] +  26.5326M4[t] +  28.6223M5[t] +  65.7953M6[t] +  102.802M7[t] +  99.8913M8[t] +  48.5643M9[t] +  10.0707M10[t] -26.3397M11[t] +  2.66033t  + e[t] \tabularnewline
 \tabularnewline
\hline
\end{tabular}
%Source: https://freestatistics.org/blog/index.php?pk=285739&T=1

[TABLE]
[ROW][C]Multiple Linear Regression - Estimated Regression Equation[/C][/ROW]
[ROW][C]Airline[t] =  +  54.3277 +  9.18029M1[t] -0.230041M2[t] +  32.2763M3[t] +  26.5326M4[t] +  28.6223M5[t] +  65.7953M6[t] +  102.802M7[t] +  99.8913M8[t] +  48.5643M9[t] +  10.0707M10[t] -26.3397M11[t] +  2.66033t  + e[t][/C][/ROW]
[ROW][C][/C][/ROW]
[/TABLE]
Source: https://freestatistics.org/blog/index.php?pk=285739&T=1

Globally Unique Identifier (entire table): ba.freestatistics.org/blog/index.php?pk=285739&T=1

As an alternative you can also use a QR Code:  

The GUIDs for individual cells are displayed in the table below:

Multiple Linear Regression - Estimated Regression Equation
Airline[t] = + 54.3277 + 9.18029M1[t] -0.230041M2[t] + 32.2763M3[t] + 26.5326M4[t] + 28.6223M5[t] + 65.7953M6[t] + 102.802M7[t] + 99.8913M8[t] + 48.5643M9[t] + 10.0707M10[t] -26.3397M11[t] + 2.66033t + e[t]


Multiple Linear Regression - Ordinary Least Squares
VariableParameterS.D.T-STATH0: parameter = 02-tail p-value1-tail p-value
(Intercept)+54.33 8.651+6.2800e+00 4.614e-09 2.307e-09
M1+9.18 10.77+8.5280e-01 0.3953 0.1977
M2-0.23 10.76-2.1370e-02 0.983 0.4915
M3+32.28 10.76+3.0000e+00 0.003236 0.001618
M4+26.53 10.76+2.4660e+00 0.01494 0.00747
M5+28.62 10.76+2.6610e+00 0.008762 0.004381
M6+65.8 10.75+6.1180e+00 1.02e-08 5.1e-09
M7+102.8 10.75+9.5610e+00 9.421e-17 4.71e-17
M8+99.89 10.75+9.2910e+00 4.355e-16 2.177e-16
M9+48.56 10.75+4.5170e+00 1.382e-05 6.909e-06
M10+10.07 10.75+9.3680e-01 0.3506 0.1753
M11-26.34 10.75-2.4500e+00 0.01559 0.007796
t+2.66 0.05297+5.0230e+01 1.879e-87 9.393e-88

\begin{tabular}{lllllllll}
\hline
Multiple Linear Regression - Ordinary Least Squares \tabularnewline
Variable & Parameter & S.D. & T-STATH0: parameter = 0 & 2-tail p-value & 1-tail p-value \tabularnewline
(Intercept) & +54.33 &  8.651 & +6.2800e+00 &  4.614e-09 &  2.307e-09 \tabularnewline
M1 & +9.18 &  10.77 & +8.5280e-01 &  0.3953 &  0.1977 \tabularnewline
M2 & -0.23 &  10.76 & -2.1370e-02 &  0.983 &  0.4915 \tabularnewline
M3 & +32.28 &  10.76 & +3.0000e+00 &  0.003236 &  0.001618 \tabularnewline
M4 & +26.53 &  10.76 & +2.4660e+00 &  0.01494 &  0.00747 \tabularnewline
M5 & +28.62 &  10.76 & +2.6610e+00 &  0.008762 &  0.004381 \tabularnewline
M6 & +65.8 &  10.75 & +6.1180e+00 &  1.02e-08 &  5.1e-09 \tabularnewline
M7 & +102.8 &  10.75 & +9.5610e+00 &  9.421e-17 &  4.71e-17 \tabularnewline
M8 & +99.89 &  10.75 & +9.2910e+00 &  4.355e-16 &  2.177e-16 \tabularnewline
M9 & +48.56 &  10.75 & +4.5170e+00 &  1.382e-05 &  6.909e-06 \tabularnewline
M10 & +10.07 &  10.75 & +9.3680e-01 &  0.3506 &  0.1753 \tabularnewline
M11 & -26.34 &  10.75 & -2.4500e+00 &  0.01559 &  0.007796 \tabularnewline
t & +2.66 &  0.05297 & +5.0230e+01 &  1.879e-87 &  9.393e-88 \tabularnewline
\hline
\end{tabular}
%Source: https://freestatistics.org/blog/index.php?pk=285739&T=2

[TABLE]
[ROW][C]Multiple Linear Regression - Ordinary Least Squares[/C][/ROW]
[ROW][C]Variable[/C][C]Parameter[/C][C]S.D.[/C][C]T-STATH0: parameter = 0[/C][C]2-tail p-value[/C][C]1-tail p-value[/C][/ROW]
[ROW][C](Intercept)[/C][C]+54.33[/C][C] 8.651[/C][C]+6.2800e+00[/C][C] 4.614e-09[/C][C] 2.307e-09[/C][/ROW]
[ROW][C]M1[/C][C]+9.18[/C][C] 10.77[/C][C]+8.5280e-01[/C][C] 0.3953[/C][C] 0.1977[/C][/ROW]
[ROW][C]M2[/C][C]-0.23[/C][C] 10.76[/C][C]-2.1370e-02[/C][C] 0.983[/C][C] 0.4915[/C][/ROW]
[ROW][C]M3[/C][C]+32.28[/C][C] 10.76[/C][C]+3.0000e+00[/C][C] 0.003236[/C][C] 0.001618[/C][/ROW]
[ROW][C]M4[/C][C]+26.53[/C][C] 10.76[/C][C]+2.4660e+00[/C][C] 0.01494[/C][C] 0.00747[/C][/ROW]
[ROW][C]M5[/C][C]+28.62[/C][C] 10.76[/C][C]+2.6610e+00[/C][C] 0.008762[/C][C] 0.004381[/C][/ROW]
[ROW][C]M6[/C][C]+65.8[/C][C] 10.75[/C][C]+6.1180e+00[/C][C] 1.02e-08[/C][C] 5.1e-09[/C][/ROW]
[ROW][C]M7[/C][C]+102.8[/C][C] 10.75[/C][C]+9.5610e+00[/C][C] 9.421e-17[/C][C] 4.71e-17[/C][/ROW]
[ROW][C]M8[/C][C]+99.89[/C][C] 10.75[/C][C]+9.2910e+00[/C][C] 4.355e-16[/C][C] 2.177e-16[/C][/ROW]
[ROW][C]M9[/C][C]+48.56[/C][C] 10.75[/C][C]+4.5170e+00[/C][C] 1.382e-05[/C][C] 6.909e-06[/C][/ROW]
[ROW][C]M10[/C][C]+10.07[/C][C] 10.75[/C][C]+9.3680e-01[/C][C] 0.3506[/C][C] 0.1753[/C][/ROW]
[ROW][C]M11[/C][C]-26.34[/C][C] 10.75[/C][C]-2.4500e+00[/C][C] 0.01559[/C][C] 0.007796[/C][/ROW]
[ROW][C]t[/C][C]+2.66[/C][C] 0.05297[/C][C]+5.0230e+01[/C][C] 1.879e-87[/C][C] 9.393e-88[/C][/ROW]
[/TABLE]
Source: https://freestatistics.org/blog/index.php?pk=285739&T=2

Globally Unique Identifier (entire table): ba.freestatistics.org/blog/index.php?pk=285739&T=2

As an alternative you can also use a QR Code:  

The GUIDs for individual cells are displayed in the table below:

Multiple Linear Regression - Ordinary Least Squares
VariableParameterS.D.T-STATH0: parameter = 02-tail p-value1-tail p-value
(Intercept)+54.33 8.651+6.2800e+00 4.614e-09 2.307e-09
M1+9.18 10.77+8.5280e-01 0.3953 0.1977
M2-0.23 10.76-2.1370e-02 0.983 0.4915
M3+32.28 10.76+3.0000e+00 0.003236 0.001618
M4+26.53 10.76+2.4660e+00 0.01494 0.00747
M5+28.62 10.76+2.6610e+00 0.008762 0.004381
M6+65.8 10.75+6.1180e+00 1.02e-08 5.1e-09
M7+102.8 10.75+9.5610e+00 9.421e-17 4.71e-17
M8+99.89 10.75+9.2910e+00 4.355e-16 2.177e-16
M9+48.56 10.75+4.5170e+00 1.382e-05 6.909e-06
M10+10.07 10.75+9.3680e-01 0.3506 0.1753
M11-26.34 10.75-2.4500e+00 0.01559 0.007796
t+2.66 0.05297+5.0230e+01 1.879e-87 9.393e-88


Multiple Linear Regression - Regression Statistics
Multiple R 0.9777
R-squared 0.9559
Adjusted R-squared 0.9518
F-TEST (value) 236.5
F-TEST (DF numerator)12
F-TEST (DF denominator)131
p-value 0
Multiple Linear Regression - Residual Statistics
Residual Standard Deviation 26.33
Sum Squared Residuals 9.082e+04

\begin{tabular}{lllllllll}
\hline
Multiple Linear Regression - Regression Statistics \tabularnewline
Multiple R &  0.9777 \tabularnewline
R-squared &  0.9559 \tabularnewline
Adjusted R-squared &  0.9518 \tabularnewline
F-TEST (value) &  236.5 \tabularnewline
F-TEST (DF numerator) & 12 \tabularnewline
F-TEST (DF denominator) & 131 \tabularnewline
p-value &  0 \tabularnewline
Multiple Linear Regression - Residual Statistics \tabularnewline
Residual Standard Deviation &  26.33 \tabularnewline
Sum Squared Residuals &  9.082e+04 \tabularnewline
\hline
\end{tabular}
%Source: https://freestatistics.org/blog/index.php?pk=285739&T=3

[TABLE]
[ROW][C]Multiple Linear Regression - Regression Statistics[/C][/ROW]
[ROW][C]Multiple R[/C][C] 0.9777[/C][/ROW]
[ROW][C]R-squared[/C][C] 0.9559[/C][/ROW]
[ROW][C]Adjusted R-squared[/C][C] 0.9518[/C][/ROW]
[ROW][C]F-TEST (value)[/C][C] 236.5[/C][/ROW]
[ROW][C]F-TEST (DF numerator)[/C][C]12[/C][/ROW]
[ROW][C]F-TEST (DF denominator)[/C][C]131[/C][/ROW]
[ROW][C]p-value[/C][C] 0[/C][/ROW]
[ROW][C]Multiple Linear Regression - Residual Statistics[/C][/ROW]
[ROW][C]Residual Standard Deviation[/C][C] 26.33[/C][/ROW]
[ROW][C]Sum Squared Residuals[/C][C] 9.082e+04[/C][/ROW]
[/TABLE]
Source: https://freestatistics.org/blog/index.php?pk=285739&T=3

Globally Unique Identifier (entire table): ba.freestatistics.org/blog/index.php?pk=285739&T=3

As an alternative you can also use a QR Code:  

The GUIDs for individual cells are displayed in the table below:

Multiple Linear Regression - Regression Statistics
Multiple R 0.9777
R-squared 0.9559
Adjusted R-squared 0.9518
F-TEST (value) 236.5
F-TEST (DF numerator)12
F-TEST (DF denominator)131
p-value 0
Multiple Linear Regression - Residual Statistics
Residual Standard Deviation 26.33
Sum Squared Residuals 9.082e+04


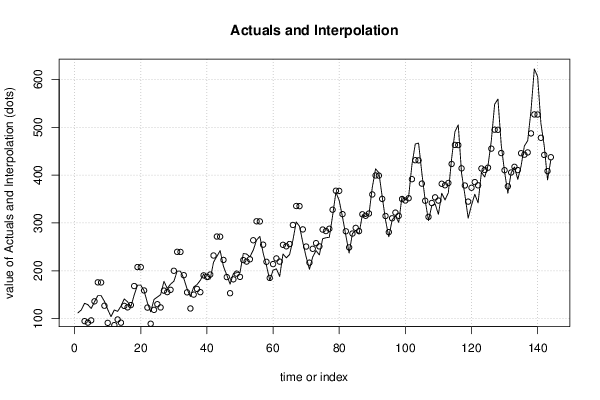
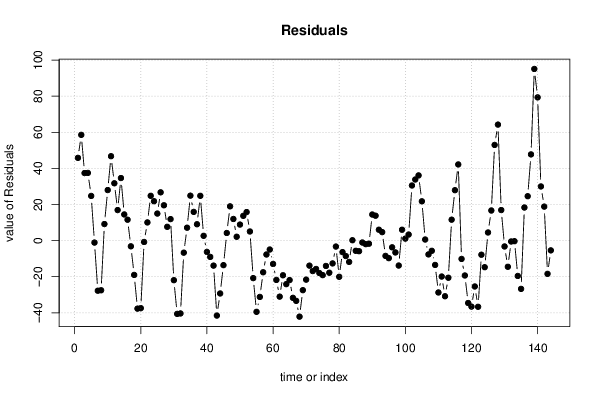
Multiple Linear Regression - Actuals, Interpolation, and Residuals
Time or IndexActualsInterpolationForecastResidualsPrediction Error
1 112 66.17 45.83
2 118 59.42 58.58
3 132 94.58 37.42
4 129 91.5 37.5
5 121 96.25 24.75
6 135 136.1-1.085
7 148 175.8-27.75
8 148 175.5-27.5
9 136 126.8 9.165
10 119 91 28
11 104 57.25 46.75
12 118 86.25 31.75
13 115 98.09 16.91
14 126 91.34 34.66
15 141 126.5 14.49
16 135 123.4 11.57
17 125 128.2-3.176
18 149 168-19.01
19 170 207.7-37.68
20 170 207.4-37.43
21 158 158.8-0.7589
22 133 122.9 10.07
23 114 89.18 24.82
24 140 118.2 21.82
25 145 130 14.98
26 150 123.3 26.73
27 178 158.4 19.57
28 163 155.3 7.651
29 172 160.1 11.9
30 178 199.9-21.93
31 199 239.6-40.6
32 199 239.3-40.35
33 184 190.7-6.683
34 162 154.8 7.151
35 146 121.1 24.9
36 166 150.1 15.9
37 171 161.9 9.06
38 180 155.2 24.81
39 193 190.4 2.643
40 181 187.3-6.273
41 183 192-9.023
42 218 231.9-13.86
43 230 271.5-41.52
44 242 271.3-29.27
45 209 222.6-13.61
46 191 186.8 4.227
47 172 153 18.98
48 194 182 11.98
49 196 193.9 2.136
50 196 187.1 8.886
51 236 222.3 13.72
52 235 219.2 15.8
53 229 223.9 5.053
54 243 263.8-20.78
55 264 303.4-39.45
56 272 303.2-31.2
57 237 254.5-17.53
58 211 218.7-7.697
59 180 184.9-4.947
60 201 213.9-12.95
61 204 225.8-21.79
62 188 219-31.04
63 235 254.2-19.2
64 227 251.1-24.12
65 234 255.9-21.87
66 264 295.7-31.7
67 302 335.4-33.37
68 293 335.1-42.12
69 259 286.5-27.45
70 229 250.6-21.62
71 203 216.9-13.87
72 229 245.9-16.87
73 242 257.7-15.71
74 233 251-17.96
75 267 286.1-19.13
76 269 283-14.05
77 270 287.8-17.8
78 315 327.6-12.63
79 364 367.3-3.295
80 347 367-20.05
81 312 318.4-6.379
82 274 282.5-8.545
83 237 248.8-11.8
84 278 277.8 0.2047
85 284 289.6-5.636
86 277 282.9-5.886
87 317 318.1-1.053
88 313 315-1.969
89 318 319.7-1.719
90 374 359.6 14.45
91 413 399.2 13.78
92 405 399 6.031
93 355 350.3 4.697
94 306 314.5-8.469
95 271 280.7-9.719
96 306 309.7-3.719
97 315 321.6-6.56
98 301 314.8-13.81
99 356 350 6.023
100 348 346.9 1.107
101 355 351.6 3.357
102 422 391.5 30.52
103 465 431.1 33.86
104 467 430.9 36.11
105 404 382.2 21.77
106 347 346.4 0.6068
107 305 312.6-7.643
108 336 341.6-5.643
109 340 353.5-13.48
110 318 346.7-28.73
111 362 381.9-19.9
112 348 378.8-30.82
113 363 383.6-20.57
114 435 423.4 11.6
115 491 463.1 27.93
116 505 462.8 42.18
117 404 414.1-10.15
118 359 378.3-19.32
119 310 344.6-34.57
120 337 373.6-36.57
121 360 385.4-25.41
122 342 378.7-36.66
123 406 413.8-7.824
124 396 410.7-14.74
125 420 415.5 4.509
126 472 455.3 16.68
127 548 495 53.01
128 559 494.7 64.26
129 463 446.1 16.93
130 407 410.2-3.241
131 362 376.5-14.49
132 405 405.5-0.4911
133 417 417.3-0.3317
134 391 410.6-19.58
135 419 445.7-26.75
136 461 442.7 18.33
137 472 447.4 24.58
138 535 487.2 47.75
139 622 526.9 95.08
140 606 526.7 79.33
141 508 478 30
142 461 442.2 18.83
143 390 408.4-18.42
144 432 437.4-5.415

\begin{tabular}{lllllllll}
\hline
Multiple Linear Regression - Actuals, Interpolation, and Residuals \tabularnewline
Time or Index & Actuals & InterpolationForecast & ResidualsPrediction Error \tabularnewline
1 &  112 &  66.17 &  45.83 \tabularnewline
2 &  118 &  59.42 &  58.58 \tabularnewline
3 &  132 &  94.58 &  37.42 \tabularnewline
4 &  129 &  91.5 &  37.5 \tabularnewline
5 &  121 &  96.25 &  24.75 \tabularnewline
6 &  135 &  136.1 & -1.085 \tabularnewline
7 &  148 &  175.8 & -27.75 \tabularnewline
8 &  148 &  175.5 & -27.5 \tabularnewline
9 &  136 &  126.8 &  9.165 \tabularnewline
10 &  119 &  91 &  28 \tabularnewline
11 &  104 &  57.25 &  46.75 \tabularnewline
12 &  118 &  86.25 &  31.75 \tabularnewline
13 &  115 &  98.09 &  16.91 \tabularnewline
14 &  126 &  91.34 &  34.66 \tabularnewline
15 &  141 &  126.5 &  14.49 \tabularnewline
16 &  135 &  123.4 &  11.57 \tabularnewline
17 &  125 &  128.2 & -3.176 \tabularnewline
18 &  149 &  168 & -19.01 \tabularnewline
19 &  170 &  207.7 & -37.68 \tabularnewline
20 &  170 &  207.4 & -37.43 \tabularnewline
21 &  158 &  158.8 & -0.7589 \tabularnewline
22 &  133 &  122.9 &  10.07 \tabularnewline
23 &  114 &  89.18 &  24.82 \tabularnewline
24 &  140 &  118.2 &  21.82 \tabularnewline
25 &  145 &  130 &  14.98 \tabularnewline
26 &  150 &  123.3 &  26.73 \tabularnewline
27 &  178 &  158.4 &  19.57 \tabularnewline
28 &  163 &  155.3 &  7.651 \tabularnewline
29 &  172 &  160.1 &  11.9 \tabularnewline
30 &  178 &  199.9 & -21.93 \tabularnewline
31 &  199 &  239.6 & -40.6 \tabularnewline
32 &  199 &  239.3 & -40.35 \tabularnewline
33 &  184 &  190.7 & -6.683 \tabularnewline
34 &  162 &  154.8 &  7.151 \tabularnewline
35 &  146 &  121.1 &  24.9 \tabularnewline
36 &  166 &  150.1 &  15.9 \tabularnewline
37 &  171 &  161.9 &  9.06 \tabularnewline
38 &  180 &  155.2 &  24.81 \tabularnewline
39 &  193 &  190.4 &  2.643 \tabularnewline
40 &  181 &  187.3 & -6.273 \tabularnewline
41 &  183 &  192 & -9.023 \tabularnewline
42 &  218 &  231.9 & -13.86 \tabularnewline
43 &  230 &  271.5 & -41.52 \tabularnewline
44 &  242 &  271.3 & -29.27 \tabularnewline
45 &  209 &  222.6 & -13.61 \tabularnewline
46 &  191 &  186.8 &  4.227 \tabularnewline
47 &  172 &  153 &  18.98 \tabularnewline
48 &  194 &  182 &  11.98 \tabularnewline
49 &  196 &  193.9 &  2.136 \tabularnewline
50 &  196 &  187.1 &  8.886 \tabularnewline
51 &  236 &  222.3 &  13.72 \tabularnewline
52 &  235 &  219.2 &  15.8 \tabularnewline
53 &  229 &  223.9 &  5.053 \tabularnewline
54 &  243 &  263.8 & -20.78 \tabularnewline
55 &  264 &  303.4 & -39.45 \tabularnewline
56 &  272 &  303.2 & -31.2 \tabularnewline
57 &  237 &  254.5 & -17.53 \tabularnewline
58 &  211 &  218.7 & -7.697 \tabularnewline
59 &  180 &  184.9 & -4.947 \tabularnewline
60 &  201 &  213.9 & -12.95 \tabularnewline
61 &  204 &  225.8 & -21.79 \tabularnewline
62 &  188 &  219 & -31.04 \tabularnewline
63 &  235 &  254.2 & -19.2 \tabularnewline
64 &  227 &  251.1 & -24.12 \tabularnewline
65 &  234 &  255.9 & -21.87 \tabularnewline
66 &  264 &  295.7 & -31.7 \tabularnewline
67 &  302 &  335.4 & -33.37 \tabularnewline
68 &  293 &  335.1 & -42.12 \tabularnewline
69 &  259 &  286.5 & -27.45 \tabularnewline
70 &  229 &  250.6 & -21.62 \tabularnewline
71 &  203 &  216.9 & -13.87 \tabularnewline
72 &  229 &  245.9 & -16.87 \tabularnewline
73 &  242 &  257.7 & -15.71 \tabularnewline
74 &  233 &  251 & -17.96 \tabularnewline
75 &  267 &  286.1 & -19.13 \tabularnewline
76 &  269 &  283 & -14.05 \tabularnewline
77 &  270 &  287.8 & -17.8 \tabularnewline
78 &  315 &  327.6 & -12.63 \tabularnewline
79 &  364 &  367.3 & -3.295 \tabularnewline
80 &  347 &  367 & -20.05 \tabularnewline
81 &  312 &  318.4 & -6.379 \tabularnewline
82 &  274 &  282.5 & -8.545 \tabularnewline
83 &  237 &  248.8 & -11.8 \tabularnewline
84 &  278 &  277.8 &  0.2047 \tabularnewline
85 &  284 &  289.6 & -5.636 \tabularnewline
86 &  277 &  282.9 & -5.886 \tabularnewline
87 &  317 &  318.1 & -1.053 \tabularnewline
88 &  313 &  315 & -1.969 \tabularnewline
89 &  318 &  319.7 & -1.719 \tabularnewline
90 &  374 &  359.6 &  14.45 \tabularnewline
91 &  413 &  399.2 &  13.78 \tabularnewline
92 &  405 &  399 &  6.031 \tabularnewline
93 &  355 &  350.3 &  4.697 \tabularnewline
94 &  306 &  314.5 & -8.469 \tabularnewline
95 &  271 &  280.7 & -9.719 \tabularnewline
96 &  306 &  309.7 & -3.719 \tabularnewline
97 &  315 &  321.6 & -6.56 \tabularnewline
98 &  301 &  314.8 & -13.81 \tabularnewline
99 &  356 &  350 &  6.023 \tabularnewline
100 &  348 &  346.9 &  1.107 \tabularnewline
101 &  355 &  351.6 &  3.357 \tabularnewline
102 &  422 &  391.5 &  30.52 \tabularnewline
103 &  465 &  431.1 &  33.86 \tabularnewline
104 &  467 &  430.9 &  36.11 \tabularnewline
105 &  404 &  382.2 &  21.77 \tabularnewline
106 &  347 &  346.4 &  0.6068 \tabularnewline
107 &  305 &  312.6 & -7.643 \tabularnewline
108 &  336 &  341.6 & -5.643 \tabularnewline
109 &  340 &  353.5 & -13.48 \tabularnewline
110 &  318 &  346.7 & -28.73 \tabularnewline
111 &  362 &  381.9 & -19.9 \tabularnewline
112 &  348 &  378.8 & -30.82 \tabularnewline
113 &  363 &  383.6 & -20.57 \tabularnewline
114 &  435 &  423.4 &  11.6 \tabularnewline
115 &  491 &  463.1 &  27.93 \tabularnewline
116 &  505 &  462.8 &  42.18 \tabularnewline
117 &  404 &  414.1 & -10.15 \tabularnewline
118 &  359 &  378.3 & -19.32 \tabularnewline
119 &  310 &  344.6 & -34.57 \tabularnewline
120 &  337 &  373.6 & -36.57 \tabularnewline
121 &  360 &  385.4 & -25.41 \tabularnewline
122 &  342 &  378.7 & -36.66 \tabularnewline
123 &  406 &  413.8 & -7.824 \tabularnewline
124 &  396 &  410.7 & -14.74 \tabularnewline
125 &  420 &  415.5 &  4.509 \tabularnewline
126 &  472 &  455.3 &  16.68 \tabularnewline
127 &  548 &  495 &  53.01 \tabularnewline
128 &  559 &  494.7 &  64.26 \tabularnewline
129 &  463 &  446.1 &  16.93 \tabularnewline
130 &  407 &  410.2 & -3.241 \tabularnewline
131 &  362 &  376.5 & -14.49 \tabularnewline
132 &  405 &  405.5 & -0.4911 \tabularnewline
133 &  417 &  417.3 & -0.3317 \tabularnewline
134 &  391 &  410.6 & -19.58 \tabularnewline
135 &  419 &  445.7 & -26.75 \tabularnewline
136 &  461 &  442.7 &  18.33 \tabularnewline
137 &  472 &  447.4 &  24.58 \tabularnewline
138 &  535 &  487.2 &  47.75 \tabularnewline
139 &  622 &  526.9 &  95.08 \tabularnewline
140 &  606 &  526.7 &  79.33 \tabularnewline
141 &  508 &  478 &  30 \tabularnewline
142 &  461 &  442.2 &  18.83 \tabularnewline
143 &  390 &  408.4 & -18.42 \tabularnewline
144 &  432 &  437.4 & -5.415 \tabularnewline
\hline
\end{tabular}
%Source: https://freestatistics.org/blog/index.php?pk=285739&T=4

[TABLE]
[ROW][C]Multiple Linear Regression - Actuals, Interpolation, and Residuals[/C][/ROW]
[ROW][C]Time or Index[/C][C]Actuals[/C][C]InterpolationForecast[/C][C]ResidualsPrediction Error[/C][/ROW]
[ROW][C]1[/C][C] 112[/C][C] 66.17[/C][C] 45.83[/C][/ROW]
[ROW][C]2[/C][C] 118[/C][C] 59.42[/C][C] 58.58[/C][/ROW]
[ROW][C]3[/C][C] 132[/C][C] 94.58[/C][C] 37.42[/C][/ROW]
[ROW][C]4[/C][C] 129[/C][C] 91.5[/C][C] 37.5[/C][/ROW]
[ROW][C]5[/C][C] 121[/C][C] 96.25[/C][C] 24.75[/C][/ROW]
[ROW][C]6[/C][C] 135[/C][C] 136.1[/C][C]-1.085[/C][/ROW]
[ROW][C]7[/C][C] 148[/C][C] 175.8[/C][C]-27.75[/C][/ROW]
[ROW][C]8[/C][C] 148[/C][C] 175.5[/C][C]-27.5[/C][/ROW]
[ROW][C]9[/C][C] 136[/C][C] 126.8[/C][C] 9.165[/C][/ROW]
[ROW][C]10[/C][C] 119[/C][C] 91[/C][C] 28[/C][/ROW]
[ROW][C]11[/C][C] 104[/C][C] 57.25[/C][C] 46.75[/C][/ROW]
[ROW][C]12[/C][C] 118[/C][C] 86.25[/C][C] 31.75[/C][/ROW]
[ROW][C]13[/C][C] 115[/C][C] 98.09[/C][C] 16.91[/C][/ROW]
[ROW][C]14[/C][C] 126[/C][C] 91.34[/C][C] 34.66[/C][/ROW]
[ROW][C]15[/C][C] 141[/C][C] 126.5[/C][C] 14.49[/C][/ROW]
[ROW][C]16[/C][C] 135[/C][C] 123.4[/C][C] 11.57[/C][/ROW]
[ROW][C]17[/C][C] 125[/C][C] 128.2[/C][C]-3.176[/C][/ROW]
[ROW][C]18[/C][C] 149[/C][C] 168[/C][C]-19.01[/C][/ROW]
[ROW][C]19[/C][C] 170[/C][C] 207.7[/C][C]-37.68[/C][/ROW]
[ROW][C]20[/C][C] 170[/C][C] 207.4[/C][C]-37.43[/C][/ROW]
[ROW][C]21[/C][C] 158[/C][C] 158.8[/C][C]-0.7589[/C][/ROW]
[ROW][C]22[/C][C] 133[/C][C] 122.9[/C][C] 10.07[/C][/ROW]
[ROW][C]23[/C][C] 114[/C][C] 89.18[/C][C] 24.82[/C][/ROW]
[ROW][C]24[/C][C] 140[/C][C] 118.2[/C][C] 21.82[/C][/ROW]
[ROW][C]25[/C][C] 145[/C][C] 130[/C][C] 14.98[/C][/ROW]
[ROW][C]26[/C][C] 150[/C][C] 123.3[/C][C] 26.73[/C][/ROW]
[ROW][C]27[/C][C] 178[/C][C] 158.4[/C][C] 19.57[/C][/ROW]
[ROW][C]28[/C][C] 163[/C][C] 155.3[/C][C] 7.651[/C][/ROW]
[ROW][C]29[/C][C] 172[/C][C] 160.1[/C][C] 11.9[/C][/ROW]
[ROW][C]30[/C][C] 178[/C][C] 199.9[/C][C]-21.93[/C][/ROW]
[ROW][C]31[/C][C] 199[/C][C] 239.6[/C][C]-40.6[/C][/ROW]
[ROW][C]32[/C][C] 199[/C][C] 239.3[/C][C]-40.35[/C][/ROW]
[ROW][C]33[/C][C] 184[/C][C] 190.7[/C][C]-6.683[/C][/ROW]
[ROW][C]34[/C][C] 162[/C][C] 154.8[/C][C] 7.151[/C][/ROW]
[ROW][C]35[/C][C] 146[/C][C] 121.1[/C][C] 24.9[/C][/ROW]
[ROW][C]36[/C][C] 166[/C][C] 150.1[/C][C] 15.9[/C][/ROW]
[ROW][C]37[/C][C] 171[/C][C] 161.9[/C][C] 9.06[/C][/ROW]
[ROW][C]38[/C][C] 180[/C][C] 155.2[/C][C] 24.81[/C][/ROW]
[ROW][C]39[/C][C] 193[/C][C] 190.4[/C][C] 2.643[/C][/ROW]
[ROW][C]40[/C][C] 181[/C][C] 187.3[/C][C]-6.273[/C][/ROW]
[ROW][C]41[/C][C] 183[/C][C] 192[/C][C]-9.023[/C][/ROW]
[ROW][C]42[/C][C] 218[/C][C] 231.9[/C][C]-13.86[/C][/ROW]
[ROW][C]43[/C][C] 230[/C][C] 271.5[/C][C]-41.52[/C][/ROW]
[ROW][C]44[/C][C] 242[/C][C] 271.3[/C][C]-29.27[/C][/ROW]
[ROW][C]45[/C][C] 209[/C][C] 222.6[/C][C]-13.61[/C][/ROW]
[ROW][C]46[/C][C] 191[/C][C] 186.8[/C][C] 4.227[/C][/ROW]
[ROW][C]47[/C][C] 172[/C][C] 153[/C][C] 18.98[/C][/ROW]
[ROW][C]48[/C][C] 194[/C][C] 182[/C][C] 11.98[/C][/ROW]
[ROW][C]49[/C][C] 196[/C][C] 193.9[/C][C] 2.136[/C][/ROW]
[ROW][C]50[/C][C] 196[/C][C] 187.1[/C][C] 8.886[/C][/ROW]
[ROW][C]51[/C][C] 236[/C][C] 222.3[/C][C] 13.72[/C][/ROW]
[ROW][C]52[/C][C] 235[/C][C] 219.2[/C][C] 15.8[/C][/ROW]
[ROW][C]53[/C][C] 229[/C][C] 223.9[/C][C] 5.053[/C][/ROW]
[ROW][C]54[/C][C] 243[/C][C] 263.8[/C][C]-20.78[/C][/ROW]
[ROW][C]55[/C][C] 264[/C][C] 303.4[/C][C]-39.45[/C][/ROW]
[ROW][C]56[/C][C] 272[/C][C] 303.2[/C][C]-31.2[/C][/ROW]
[ROW][C]57[/C][C] 237[/C][C] 254.5[/C][C]-17.53[/C][/ROW]
[ROW][C]58[/C][C] 211[/C][C] 218.7[/C][C]-7.697[/C][/ROW]
[ROW][C]59[/C][C] 180[/C][C] 184.9[/C][C]-4.947[/C][/ROW]
[ROW][C]60[/C][C] 201[/C][C] 213.9[/C][C]-12.95[/C][/ROW]
[ROW][C]61[/C][C] 204[/C][C] 225.8[/C][C]-21.79[/C][/ROW]
[ROW][C]62[/C][C] 188[/C][C] 219[/C][C]-31.04[/C][/ROW]
[ROW][C]63[/C][C] 235[/C][C] 254.2[/C][C]-19.2[/C][/ROW]
[ROW][C]64[/C][C] 227[/C][C] 251.1[/C][C]-24.12[/C][/ROW]
[ROW][C]65[/C][C] 234[/C][C] 255.9[/C][C]-21.87[/C][/ROW]
[ROW][C]66[/C][C] 264[/C][C] 295.7[/C][C]-31.7[/C][/ROW]
[ROW][C]67[/C][C] 302[/C][C] 335.4[/C][C]-33.37[/C][/ROW]
[ROW][C]68[/C][C] 293[/C][C] 335.1[/C][C]-42.12[/C][/ROW]
[ROW][C]69[/C][C] 259[/C][C] 286.5[/C][C]-27.45[/C][/ROW]
[ROW][C]70[/C][C] 229[/C][C] 250.6[/C][C]-21.62[/C][/ROW]
[ROW][C]71[/C][C] 203[/C][C] 216.9[/C][C]-13.87[/C][/ROW]
[ROW][C]72[/C][C] 229[/C][C] 245.9[/C][C]-16.87[/C][/ROW]
[ROW][C]73[/C][C] 242[/C][C] 257.7[/C][C]-15.71[/C][/ROW]
[ROW][C]74[/C][C] 233[/C][C] 251[/C][C]-17.96[/C][/ROW]
[ROW][C]75[/C][C] 267[/C][C] 286.1[/C][C]-19.13[/C][/ROW]
[ROW][C]76[/C][C] 269[/C][C] 283[/C][C]-14.05[/C][/ROW]
[ROW][C]77[/C][C] 270[/C][C] 287.8[/C][C]-17.8[/C][/ROW]
[ROW][C]78[/C][C] 315[/C][C] 327.6[/C][C]-12.63[/C][/ROW]
[ROW][C]79[/C][C] 364[/C][C] 367.3[/C][C]-3.295[/C][/ROW]
[ROW][C]80[/C][C] 347[/C][C] 367[/C][C]-20.05[/C][/ROW]
[ROW][C]81[/C][C] 312[/C][C] 318.4[/C][C]-6.379[/C][/ROW]
[ROW][C]82[/C][C] 274[/C][C] 282.5[/C][C]-8.545[/C][/ROW]
[ROW][C]83[/C][C] 237[/C][C] 248.8[/C][C]-11.8[/C][/ROW]
[ROW][C]84[/C][C] 278[/C][C] 277.8[/C][C] 0.2047[/C][/ROW]
[ROW][C]85[/C][C] 284[/C][C] 289.6[/C][C]-5.636[/C][/ROW]
[ROW][C]86[/C][C] 277[/C][C] 282.9[/C][C]-5.886[/C][/ROW]
[ROW][C]87[/C][C] 317[/C][C] 318.1[/C][C]-1.053[/C][/ROW]
[ROW][C]88[/C][C] 313[/C][C] 315[/C][C]-1.969[/C][/ROW]
[ROW][C]89[/C][C] 318[/C][C] 319.7[/C][C]-1.719[/C][/ROW]
[ROW][C]90[/C][C] 374[/C][C] 359.6[/C][C] 14.45[/C][/ROW]
[ROW][C]91[/C][C] 413[/C][C] 399.2[/C][C] 13.78[/C][/ROW]
[ROW][C]92[/C][C] 405[/C][C] 399[/C][C] 6.031[/C][/ROW]
[ROW][C]93[/C][C] 355[/C][C] 350.3[/C][C] 4.697[/C][/ROW]
[ROW][C]94[/C][C] 306[/C][C] 314.5[/C][C]-8.469[/C][/ROW]
[ROW][C]95[/C][C] 271[/C][C] 280.7[/C][C]-9.719[/C][/ROW]
[ROW][C]96[/C][C] 306[/C][C] 309.7[/C][C]-3.719[/C][/ROW]
[ROW][C]97[/C][C] 315[/C][C] 321.6[/C][C]-6.56[/C][/ROW]
[ROW][C]98[/C][C] 301[/C][C] 314.8[/C][C]-13.81[/C][/ROW]
[ROW][C]99[/C][C] 356[/C][C] 350[/C][C] 6.023[/C][/ROW]
[ROW][C]100[/C][C] 348[/C][C] 346.9[/C][C] 1.107[/C][/ROW]
[ROW][C]101[/C][C] 355[/C][C] 351.6[/C][C] 3.357[/C][/ROW]
[ROW][C]102[/C][C] 422[/C][C] 391.5[/C][C] 30.52[/C][/ROW]
[ROW][C]103[/C][C] 465[/C][C] 431.1[/C][C] 33.86[/C][/ROW]
[ROW][C]104[/C][C] 467[/C][C] 430.9[/C][C] 36.11[/C][/ROW]
[ROW][C]105[/C][C] 404[/C][C] 382.2[/C][C] 21.77[/C][/ROW]
[ROW][C]106[/C][C] 347[/C][C] 346.4[/C][C] 0.6068[/C][/ROW]
[ROW][C]107[/C][C] 305[/C][C] 312.6[/C][C]-7.643[/C][/ROW]
[ROW][C]108[/C][C] 336[/C][C] 341.6[/C][C]-5.643[/C][/ROW]
[ROW][C]109[/C][C] 340[/C][C] 353.5[/C][C]-13.48[/C][/ROW]
[ROW][C]110[/C][C] 318[/C][C] 346.7[/C][C]-28.73[/C][/ROW]
[ROW][C]111[/C][C] 362[/C][C] 381.9[/C][C]-19.9[/C][/ROW]
[ROW][C]112[/C][C] 348[/C][C] 378.8[/C][C]-30.82[/C][/ROW]
[ROW][C]113[/C][C] 363[/C][C] 383.6[/C][C]-20.57[/C][/ROW]
[ROW][C]114[/C][C] 435[/C][C] 423.4[/C][C] 11.6[/C][/ROW]
[ROW][C]115[/C][C] 491[/C][C] 463.1[/C][C] 27.93[/C][/ROW]
[ROW][C]116[/C][C] 505[/C][C] 462.8[/C][C] 42.18[/C][/ROW]
[ROW][C]117[/C][C] 404[/C][C] 414.1[/C][C]-10.15[/C][/ROW]
[ROW][C]118[/C][C] 359[/C][C] 378.3[/C][C]-19.32[/C][/ROW]
[ROW][C]119[/C][C] 310[/C][C] 344.6[/C][C]-34.57[/C][/ROW]
[ROW][C]120[/C][C] 337[/C][C] 373.6[/C][C]-36.57[/C][/ROW]
[ROW][C]121[/C][C] 360[/C][C] 385.4[/C][C]-25.41[/C][/ROW]
[ROW][C]122[/C][C] 342[/C][C] 378.7[/C][C]-36.66[/C][/ROW]
[ROW][C]123[/C][C] 406[/C][C] 413.8[/C][C]-7.824[/C][/ROW]
[ROW][C]124[/C][C] 396[/C][C] 410.7[/C][C]-14.74[/C][/ROW]
[ROW][C]125[/C][C] 420[/C][C] 415.5[/C][C] 4.509[/C][/ROW]
[ROW][C]126[/C][C] 472[/C][C] 455.3[/C][C] 16.68[/C][/ROW]
[ROW][C]127[/C][C] 548[/C][C] 495[/C][C] 53.01[/C][/ROW]
[ROW][C]128[/C][C] 559[/C][C] 494.7[/C][C] 64.26[/C][/ROW]
[ROW][C]129[/C][C] 463[/C][C] 446.1[/C][C] 16.93[/C][/ROW]
[ROW][C]130[/C][C] 407[/C][C] 410.2[/C][C]-3.241[/C][/ROW]
[ROW][C]131[/C][C] 362[/C][C] 376.5[/C][C]-14.49[/C][/ROW]
[ROW][C]132[/C][C] 405[/C][C] 405.5[/C][C]-0.4911[/C][/ROW]
[ROW][C]133[/C][C] 417[/C][C] 417.3[/C][C]-0.3317[/C][/ROW]
[ROW][C]134[/C][C] 391[/C][C] 410.6[/C][C]-19.58[/C][/ROW]
[ROW][C]135[/C][C] 419[/C][C] 445.7[/C][C]-26.75[/C][/ROW]
[ROW][C]136[/C][C] 461[/C][C] 442.7[/C][C] 18.33[/C][/ROW]
[ROW][C]137[/C][C] 472[/C][C] 447.4[/C][C] 24.58[/C][/ROW]
[ROW][C]138[/C][C] 535[/C][C] 487.2[/C][C] 47.75[/C][/ROW]
[ROW][C]139[/C][C] 622[/C][C] 526.9[/C][C] 95.08[/C][/ROW]
[ROW][C]140[/C][C] 606[/C][C] 526.7[/C][C] 79.33[/C][/ROW]
[ROW][C]141[/C][C] 508[/C][C] 478[/C][C] 30[/C][/ROW]
[ROW][C]142[/C][C] 461[/C][C] 442.2[/C][C] 18.83[/C][/ROW]
[ROW][C]143[/C][C] 390[/C][C] 408.4[/C][C]-18.42[/C][/ROW]
[ROW][C]144[/C][C] 432[/C][C] 437.4[/C][C]-5.415[/C][/ROW]
[/TABLE]
Source: https://freestatistics.org/blog/index.php?pk=285739&T=4

Globally Unique Identifier (entire table): ba.freestatistics.org/blog/index.php?pk=285739&T=4

As an alternative you can also use a QR Code:  

The GUIDs for individual cells are displayed in the table below:

Multiple Linear Regression - Actuals, Interpolation, and Residuals
Time or IndexActualsInterpolationForecastResidualsPrediction Error
1 112 66.17 45.83
2 118 59.42 58.58
3 132 94.58 37.42
4 129 91.5 37.5
5 121 96.25 24.75
6 135 136.1-1.085
7 148 175.8-27.75
8 148 175.5-27.5
9 136 126.8 9.165
10 119 91 28
11 104 57.25 46.75
12 118 86.25 31.75
13 115 98.09 16.91
14 126 91.34 34.66
15 141 126.5 14.49
16 135 123.4 11.57
17 125 128.2-3.176
18 149 168-19.01
19 170 207.7-37.68
20 170 207.4-37.43
21 158 158.8-0.7589
22 133 122.9 10.07
23 114 89.18 24.82
24 140 118.2 21.82
25 145 130 14.98
26 150 123.3 26.73
27 178 158.4 19.57
28 163 155.3 7.651
29 172 160.1 11.9
30 178 199.9-21.93
31 199 239.6-40.6
32 199 239.3-40.35
33 184 190.7-6.683
34 162 154.8 7.151
35 146 121.1 24.9
36 166 150.1 15.9
37 171 161.9 9.06
38 180 155.2 24.81
39 193 190.4 2.643
40 181 187.3-6.273
41 183 192-9.023
42 218 231.9-13.86
43 230 271.5-41.52
44 242 271.3-29.27
45 209 222.6-13.61
46 191 186.8 4.227
47 172 153 18.98
48 194 182 11.98
49 196 193.9 2.136
50 196 187.1 8.886
51 236 222.3 13.72
52 235 219.2 15.8
53 229 223.9 5.053
54 243 263.8-20.78
55 264 303.4-39.45
56 272 303.2-31.2
57 237 254.5-17.53
58 211 218.7-7.697
59 180 184.9-4.947
60 201 213.9-12.95
61 204 225.8-21.79
62 188 219-31.04
63 235 254.2-19.2
64 227 251.1-24.12
65 234 255.9-21.87
66 264 295.7-31.7
67 302 335.4-33.37
68 293 335.1-42.12
69 259 286.5-27.45
70 229 250.6-21.62
71 203 216.9-13.87
72 229 245.9-16.87
73 242 257.7-15.71
74 233 251-17.96
75 267 286.1-19.13
76 269 283-14.05
77 270 287.8-17.8
78 315 327.6-12.63
79 364 367.3-3.295
80 347 367-20.05
81 312 318.4-6.379
82 274 282.5-8.545
83 237 248.8-11.8
84 278 277.8 0.2047
85 284 289.6-5.636
86 277 282.9-5.886
87 317 318.1-1.053
88 313 315-1.969
89 318 319.7-1.719
90 374 359.6 14.45
91 413 399.2 13.78
92 405 399 6.031
93 355 350.3 4.697
94 306 314.5-8.469
95 271 280.7-9.719
96 306 309.7-3.719
97 315 321.6-6.56
98 301 314.8-13.81
99 356 350 6.023
100 348 346.9 1.107
101 355 351.6 3.357
102 422 391.5 30.52
103 465 431.1 33.86
104 467 430.9 36.11
105 404 382.2 21.77
106 347 346.4 0.6068
107 305 312.6-7.643
108 336 341.6-5.643
109 340 353.5-13.48
110 318 346.7-28.73
111 362 381.9-19.9
112 348 378.8-30.82
113 363 383.6-20.57
114 435 423.4 11.6
115 491 463.1 27.93
116 505 462.8 42.18
117 404 414.1-10.15
118 359 378.3-19.32
119 310 344.6-34.57
120 337 373.6-36.57
121 360 385.4-25.41
122 342 378.7-36.66
123 406 413.8-7.824
124 396 410.7-14.74
125 420 415.5 4.509
126 472 455.3 16.68
127 548 495 53.01
128 559 494.7 64.26
129 463 446.1 16.93
130 407 410.2-3.241
131 362 376.5-14.49
132 405 405.5-0.4911
133 417 417.3-0.3317
134 391 410.6-19.58
135 419 445.7-26.75
136 461 442.7 18.33
137 472 447.4 24.58
138 535 487.2 47.75
139 622 526.9 95.08
140 606 526.7 79.33
141 508 478 30
142 461 442.2 18.83
143 390 408.4-18.42
144 432 437.4-5.415


Goldfeld-Quandt test for Heteroskedasticity
p-valuesAlternative Hypothesis
breakpoint indexgreater2-sidedless
16 0.0006234 0.001247 0.9994
17 5.925e-05 0.0001185 0.9999
18 5.92e-05 0.0001184 0.9999
19 0.0002141 0.0004282 0.9998
20 0.0001604 0.0003209 0.9998
21 7.883e-05 0.0001577 0.9999
22 1.738e-05 3.476e-05 1
23 4.074e-06 8.148e-06 1
24 2.007e-06 4.014e-06 1
25 1.617e-06 3.235e-06 1
26 6.2e-07 1.24e-06 1
27 2.21e-06 4.421e-06 1
28 7.571e-07 1.514e-06 1
29 4.126e-06 8.252e-06 1
30 1.653e-06 3.305e-06 1
31 1.048e-06 2.096e-06 1
32 6.277e-07 1.255e-06 1
33 2.29e-07 4.581e-07 1
34 8.363e-08 1.673e-07 1
35 4.268e-08 8.537e-08 1
36 1.872e-08 3.745e-08 1
37 7.446e-09 1.489e-08 1
38 5.135e-09 1.027e-08 1
39 1.853e-09 3.707e-09 1
40 7.179e-10 1.436e-09 1
41 2.131e-10 4.262e-10 1
42 9.84e-10 1.968e-09 1
43 1.277e-09 2.555e-09 1
44 1.011e-08 2.022e-08 1
45 3.615e-09 7.231e-09 1
46 1.747e-09 3.495e-09 1
47 1.372e-09 2.743e-09 1
48 9.181e-10 1.836e-09 1
49 4.565e-10 9.129e-10 1
50 5.572e-10 1.114e-09 1
51 1.629e-09 3.257e-09 1
52 1.633e-08 3.266e-08 1
53 3.317e-08 6.633e-08 1
54 2.118e-08 4.236e-08 1
55 4.643e-08 9.287e-08 1
56 1.193e-07 2.385e-07 1
57 5.273e-08 1.055e-07 1
58 3.099e-08 6.198e-08 1
59 9.051e-08 1.81e-07 1
60 1.467e-07 2.934e-07 1
61 2.602e-07 5.204e-07 1
62 1.026e-05 2.051e-05 1
63 8.843e-06 1.769e-05 1
64 6.98e-06 1.396e-05 1
65 3.755e-06 7.51e-06 1
66 3.588e-06 7.176e-06 1
67 3.985e-05 7.97e-05 1
68 0.000254 0.000508 0.9997
69 0.0002039 0.0004077 0.9998
70 0.0001351 0.0002701 0.9999
71 0.0001298 0.0002596 0.9999
72 8.684e-05 0.0001737 0.9999
73 5.279e-05 0.0001056 0.9999
74 4.604e-05 9.209e-05 1
75 2.719e-05 5.437e-05 1
76 1.719e-05 3.438e-05 1
77 1.121e-05 2.241e-05 1
78 5.922e-05 0.0001184 0.9999
79 0.004961 0.009922 0.995
80 0.04635 0.09271 0.9536
81 0.05233 0.1047 0.9477
82 0.04185 0.0837 0.9581
83 0.03566 0.07133 0.9643
84 0.03651 0.07302 0.9635
85 0.03273 0.06546 0.9673
86 0.03804 0.07607 0.962
87 0.04231 0.08462 0.9577
88 0.04306 0.08613 0.9569
89 0.0429 0.08581 0.9571
90 0.1058 0.2116 0.8942
91 0.3204 0.6409 0.6796
92 0.5985 0.8029 0.4015
93 0.5889 0.8222 0.4111
94 0.5349 0.9303 0.4651
95 0.5229 0.9543 0.4771
96 0.5134 0.9733 0.4866
97 0.489 0.9781 0.511
98 0.5134 0.9731 0.4866
99 0.6387 0.7226 0.3613
100 0.6719 0.6561 0.3281
101 0.6723 0.6555 0.3277
102 0.8038 0.3923 0.1962
103 0.8844 0.2313 0.1156
104 0.9302 0.1397 0.06983
105 0.9544 0.09119 0.0456
106 0.9574 0.08518 0.04259
107 0.9854 0.02913 0.01457
108 0.9964 0.007245 0.003622
109 0.9973 0.005441 0.00272
110 0.9985 0.002913 0.001456
111 0.9992 0.001509 0.0007546
112 0.9987 0.002678 0.001339
113 0.9977 0.004679 0.002339
114 0.9965 0.007064 0.003532
115 0.9978 0.004467 0.002233
116 0.9975 0.005021 0.00251
117 0.9955 0.009 0.0045
118 0.9913 0.01749 0.008746
119 0.9858 0.02832 0.01416
120 0.9779 0.04415 0.02207
121 0.9637 0.07262 0.03631
122 0.9385 0.1229 0.06147
123 0.9739 0.05211 0.02605
124 0.9618 0.07642 0.03821
125 0.9244 0.1511 0.07556
126 0.8953 0.2094 0.1047
127 0.966 0.06794 0.03397
128 0.9266 0.1468 0.07342

\begin{tabular}{lllllllll}
\hline
Goldfeld-Quandt test for Heteroskedasticity \tabularnewline
p-values & Alternative Hypothesis \tabularnewline
breakpoint index & greater & 2-sided & less \tabularnewline
16 &  0.0006234 &  0.001247 &  0.9994 \tabularnewline
17 &  5.925e-05 &  0.0001185 &  0.9999 \tabularnewline
18 &  5.92e-05 &  0.0001184 &  0.9999 \tabularnewline
19 &  0.0002141 &  0.0004282 &  0.9998 \tabularnewline
20 &  0.0001604 &  0.0003209 &  0.9998 \tabularnewline
21 &  7.883e-05 &  0.0001577 &  0.9999 \tabularnewline
22 &  1.738e-05 &  3.476e-05 &  1 \tabularnewline
23 &  4.074e-06 &  8.148e-06 &  1 \tabularnewline
24 &  2.007e-06 &  4.014e-06 &  1 \tabularnewline
25 &  1.617e-06 &  3.235e-06 &  1 \tabularnewline
26 &  6.2e-07 &  1.24e-06 &  1 \tabularnewline
27 &  2.21e-06 &  4.421e-06 &  1 \tabularnewline
28 &  7.571e-07 &  1.514e-06 &  1 \tabularnewline
29 &  4.126e-06 &  8.252e-06 &  1 \tabularnewline
30 &  1.653e-06 &  3.305e-06 &  1 \tabularnewline
31 &  1.048e-06 &  2.096e-06 &  1 \tabularnewline
32 &  6.277e-07 &  1.255e-06 &  1 \tabularnewline
33 &  2.29e-07 &  4.581e-07 &  1 \tabularnewline
34 &  8.363e-08 &  1.673e-07 &  1 \tabularnewline
35 &  4.268e-08 &  8.537e-08 &  1 \tabularnewline
36 &  1.872e-08 &  3.745e-08 &  1 \tabularnewline
37 &  7.446e-09 &  1.489e-08 &  1 \tabularnewline
38 &  5.135e-09 &  1.027e-08 &  1 \tabularnewline
39 &  1.853e-09 &  3.707e-09 &  1 \tabularnewline
40 &  7.179e-10 &  1.436e-09 &  1 \tabularnewline
41 &  2.131e-10 &  4.262e-10 &  1 \tabularnewline
42 &  9.84e-10 &  1.968e-09 &  1 \tabularnewline
43 &  1.277e-09 &  2.555e-09 &  1 \tabularnewline
44 &  1.011e-08 &  2.022e-08 &  1 \tabularnewline
45 &  3.615e-09 &  7.231e-09 &  1 \tabularnewline
46 &  1.747e-09 &  3.495e-09 &  1 \tabularnewline
47 &  1.372e-09 &  2.743e-09 &  1 \tabularnewline
48 &  9.181e-10 &  1.836e-09 &  1 \tabularnewline
49 &  4.565e-10 &  9.129e-10 &  1 \tabularnewline
50 &  5.572e-10 &  1.114e-09 &  1 \tabularnewline
51 &  1.629e-09 &  3.257e-09 &  1 \tabularnewline
52 &  1.633e-08 &  3.266e-08 &  1 \tabularnewline
53 &  3.317e-08 &  6.633e-08 &  1 \tabularnewline
54 &  2.118e-08 &  4.236e-08 &  1 \tabularnewline
55 &  4.643e-08 &  9.287e-08 &  1 \tabularnewline
56 &  1.193e-07 &  2.385e-07 &  1 \tabularnewline
57 &  5.273e-08 &  1.055e-07 &  1 \tabularnewline
58 &  3.099e-08 &  6.198e-08 &  1 \tabularnewline
59 &  9.051e-08 &  1.81e-07 &  1 \tabularnewline
60 &  1.467e-07 &  2.934e-07 &  1 \tabularnewline
61 &  2.602e-07 &  5.204e-07 &  1 \tabularnewline
62 &  1.026e-05 &  2.051e-05 &  1 \tabularnewline
63 &  8.843e-06 &  1.769e-05 &  1 \tabularnewline
64 &  6.98e-06 &  1.396e-05 &  1 \tabularnewline
65 &  3.755e-06 &  7.51e-06 &  1 \tabularnewline
66 &  3.588e-06 &  7.176e-06 &  1 \tabularnewline
67 &  3.985e-05 &  7.97e-05 &  1 \tabularnewline
68 &  0.000254 &  0.000508 &  0.9997 \tabularnewline
69 &  0.0002039 &  0.0004077 &  0.9998 \tabularnewline
70 &  0.0001351 &  0.0002701 &  0.9999 \tabularnewline
71 &  0.0001298 &  0.0002596 &  0.9999 \tabularnewline
72 &  8.684e-05 &  0.0001737 &  0.9999 \tabularnewline
73 &  5.279e-05 &  0.0001056 &  0.9999 \tabularnewline
74 &  4.604e-05 &  9.209e-05 &  1 \tabularnewline
75 &  2.719e-05 &  5.437e-05 &  1 \tabularnewline
76 &  1.719e-05 &  3.438e-05 &  1 \tabularnewline
77 &  1.121e-05 &  2.241e-05 &  1 \tabularnewline
78 &  5.922e-05 &  0.0001184 &  0.9999 \tabularnewline
79 &  0.004961 &  0.009922 &  0.995 \tabularnewline
80 &  0.04635 &  0.09271 &  0.9536 \tabularnewline
81 &  0.05233 &  0.1047 &  0.9477 \tabularnewline
82 &  0.04185 &  0.0837 &  0.9581 \tabularnewline
83 &  0.03566 &  0.07133 &  0.9643 \tabularnewline
84 &  0.03651 &  0.07302 &  0.9635 \tabularnewline
85 &  0.03273 &  0.06546 &  0.9673 \tabularnewline
86 &  0.03804 &  0.07607 &  0.962 \tabularnewline
87 &  0.04231 &  0.08462 &  0.9577 \tabularnewline
88 &  0.04306 &  0.08613 &  0.9569 \tabularnewline
89 &  0.0429 &  0.08581 &  0.9571 \tabularnewline
90 &  0.1058 &  0.2116 &  0.8942 \tabularnewline
91 &  0.3204 &  0.6409 &  0.6796 \tabularnewline
92 &  0.5985 &  0.8029 &  0.4015 \tabularnewline
93 &  0.5889 &  0.8222 &  0.4111 \tabularnewline
94 &  0.5349 &  0.9303 &  0.4651 \tabularnewline
95 &  0.5229 &  0.9543 &  0.4771 \tabularnewline
96 &  0.5134 &  0.9733 &  0.4866 \tabularnewline
97 &  0.489 &  0.9781 &  0.511 \tabularnewline
98 &  0.5134 &  0.9731 &  0.4866 \tabularnewline
99 &  0.6387 &  0.7226 &  0.3613 \tabularnewline
100 &  0.6719 &  0.6561 &  0.3281 \tabularnewline
101 &  0.6723 &  0.6555 &  0.3277 \tabularnewline
102 &  0.8038 &  0.3923 &  0.1962 \tabularnewline
103 &  0.8844 &  0.2313 &  0.1156 \tabularnewline
104 &  0.9302 &  0.1397 &  0.06983 \tabularnewline
105 &  0.9544 &  0.09119 &  0.0456 \tabularnewline
106 &  0.9574 &  0.08518 &  0.04259 \tabularnewline
107 &  0.9854 &  0.02913 &  0.01457 \tabularnewline
108 &  0.9964 &  0.007245 &  0.003622 \tabularnewline
109 &  0.9973 &  0.005441 &  0.00272 \tabularnewline
110 &  0.9985 &  0.002913 &  0.001456 \tabularnewline
111 &  0.9992 &  0.001509 &  0.0007546 \tabularnewline
112 &  0.9987 &  0.002678 &  0.001339 \tabularnewline
113 &  0.9977 &  0.004679 &  0.002339 \tabularnewline
114 &  0.9965 &  0.007064 &  0.003532 \tabularnewline
115 &  0.9978 &  0.004467 &  0.002233 \tabularnewline
116 &  0.9975 &  0.005021 &  0.00251 \tabularnewline
117 &  0.9955 &  0.009 &  0.0045 \tabularnewline
118 &  0.9913 &  0.01749 &  0.008746 \tabularnewline
119 &  0.9858 &  0.02832 &  0.01416 \tabularnewline
120 &  0.9779 &  0.04415 &  0.02207 \tabularnewline
121 &  0.9637 &  0.07262 &  0.03631 \tabularnewline
122 &  0.9385 &  0.1229 &  0.06147 \tabularnewline
123 &  0.9739 &  0.05211 &  0.02605 \tabularnewline
124 &  0.9618 &  0.07642 &  0.03821 \tabularnewline
125 &  0.9244 &  0.1511 &  0.07556 \tabularnewline
126 &  0.8953 &  0.2094 &  0.1047 \tabularnewline
127 &  0.966 &  0.06794 &  0.03397 \tabularnewline
128 &  0.9266 &  0.1468 &  0.07342 \tabularnewline
\hline
\end{tabular}
%Source: https://freestatistics.org/blog/index.php?pk=285739&T=5

[TABLE]
[ROW][C]Goldfeld-Quandt test for Heteroskedasticity[/C][/ROW]
[ROW][C]p-values[/C][C]Alternative Hypothesis[/C][/ROW]
[ROW][C]breakpoint index[/C][C]greater[/C][C]2-sided[/C][C]less[/C][/ROW]
[ROW][C]16[/C][C] 0.0006234[/C][C] 0.001247[/C][C] 0.9994[/C][/ROW]
[ROW][C]17[/C][C] 5.925e-05[/C][C] 0.0001185[/C][C] 0.9999[/C][/ROW]
[ROW][C]18[/C][C] 5.92e-05[/C][C] 0.0001184[/C][C] 0.9999[/C][/ROW]
[ROW][C]19[/C][C] 0.0002141[/C][C] 0.0004282[/C][C] 0.9998[/C][/ROW]
[ROW][C]20[/C][C] 0.0001604[/C][C] 0.0003209[/C][C] 0.9998[/C][/ROW]
[ROW][C]21[/C][C] 7.883e-05[/C][C] 0.0001577[/C][C] 0.9999[/C][/ROW]
[ROW][C]22[/C][C] 1.738e-05[/C][C] 3.476e-05[/C][C] 1[/C][/ROW]
[ROW][C]23[/C][C] 4.074e-06[/C][C] 8.148e-06[/C][C] 1[/C][/ROW]
[ROW][C]24[/C][C] 2.007e-06[/C][C] 4.014e-06[/C][C] 1[/C][/ROW]
[ROW][C]25[/C][C] 1.617e-06[/C][C] 3.235e-06[/C][C] 1[/C][/ROW]
[ROW][C]26[/C][C] 6.2e-07[/C][C] 1.24e-06[/C][C] 1[/C][/ROW]
[ROW][C]27[/C][C] 2.21e-06[/C][C] 4.421e-06[/C][C] 1[/C][/ROW]
[ROW][C]28[/C][C] 7.571e-07[/C][C] 1.514e-06[/C][C] 1[/C][/ROW]
[ROW][C]29[/C][C] 4.126e-06[/C][C] 8.252e-06[/C][C] 1[/C][/ROW]
[ROW][C]30[/C][C] 1.653e-06[/C][C] 3.305e-06[/C][C] 1[/C][/ROW]
[ROW][C]31[/C][C] 1.048e-06[/C][C] 2.096e-06[/C][C] 1[/C][/ROW]
[ROW][C]32[/C][C] 6.277e-07[/C][C] 1.255e-06[/C][C] 1[/C][/ROW]
[ROW][C]33[/C][C] 2.29e-07[/C][C] 4.581e-07[/C][C] 1[/C][/ROW]
[ROW][C]34[/C][C] 8.363e-08[/C][C] 1.673e-07[/C][C] 1[/C][/ROW]
[ROW][C]35[/C][C] 4.268e-08[/C][C] 8.537e-08[/C][C] 1[/C][/ROW]
[ROW][C]36[/C][C] 1.872e-08[/C][C] 3.745e-08[/C][C] 1[/C][/ROW]
[ROW][C]37[/C][C] 7.446e-09[/C][C] 1.489e-08[/C][C] 1[/C][/ROW]
[ROW][C]38[/C][C] 5.135e-09[/C][C] 1.027e-08[/C][C] 1[/C][/ROW]
[ROW][C]39[/C][C] 1.853e-09[/C][C] 3.707e-09[/C][C] 1[/C][/ROW]
[ROW][C]40[/C][C] 7.179e-10[/C][C] 1.436e-09[/C][C] 1[/C][/ROW]
[ROW][C]41[/C][C] 2.131e-10[/C][C] 4.262e-10[/C][C] 1[/C][/ROW]
[ROW][C]42[/C][C] 9.84e-10[/C][C] 1.968e-09[/C][C] 1[/C][/ROW]
[ROW][C]43[/C][C] 1.277e-09[/C][C] 2.555e-09[/C][C] 1[/C][/ROW]
[ROW][C]44[/C][C] 1.011e-08[/C][C] 2.022e-08[/C][C] 1[/C][/ROW]
[ROW][C]45[/C][C] 3.615e-09[/C][C] 7.231e-09[/C][C] 1[/C][/ROW]
[ROW][C]46[/C][C] 1.747e-09[/C][C] 3.495e-09[/C][C] 1[/C][/ROW]
[ROW][C]47[/C][C] 1.372e-09[/C][C] 2.743e-09[/C][C] 1[/C][/ROW]
[ROW][C]48[/C][C] 9.181e-10[/C][C] 1.836e-09[/C][C] 1[/C][/ROW]
[ROW][C]49[/C][C] 4.565e-10[/C][C] 9.129e-10[/C][C] 1[/C][/ROW]
[ROW][C]50[/C][C] 5.572e-10[/C][C] 1.114e-09[/C][C] 1[/C][/ROW]
[ROW][C]51[/C][C] 1.629e-09[/C][C] 3.257e-09[/C][C] 1[/C][/ROW]
[ROW][C]52[/C][C] 1.633e-08[/C][C] 3.266e-08[/C][C] 1[/C][/ROW]
[ROW][C]53[/C][C] 3.317e-08[/C][C] 6.633e-08[/C][C] 1[/C][/ROW]
[ROW][C]54[/C][C] 2.118e-08[/C][C] 4.236e-08[/C][C] 1[/C][/ROW]
[ROW][C]55[/C][C] 4.643e-08[/C][C] 9.287e-08[/C][C] 1[/C][/ROW]
[ROW][C]56[/C][C] 1.193e-07[/C][C] 2.385e-07[/C][C] 1[/C][/ROW]
[ROW][C]57[/C][C] 5.273e-08[/C][C] 1.055e-07[/C][C] 1[/C][/ROW]
[ROW][C]58[/C][C] 3.099e-08[/C][C] 6.198e-08[/C][C] 1[/C][/ROW]
[ROW][C]59[/C][C] 9.051e-08[/C][C] 1.81e-07[/C][C] 1[/C][/ROW]
[ROW][C]60[/C][C] 1.467e-07[/C][C] 2.934e-07[/C][C] 1[/C][/ROW]
[ROW][C]61[/C][C] 2.602e-07[/C][C] 5.204e-07[/C][C] 1[/C][/ROW]
[ROW][C]62[/C][C] 1.026e-05[/C][C] 2.051e-05[/C][C] 1[/C][/ROW]
[ROW][C]63[/C][C] 8.843e-06[/C][C] 1.769e-05[/C][C] 1[/C][/ROW]
[ROW][C]64[/C][C] 6.98e-06[/C][C] 1.396e-05[/C][C] 1[/C][/ROW]
[ROW][C]65[/C][C] 3.755e-06[/C][C] 7.51e-06[/C][C] 1[/C][/ROW]
[ROW][C]66[/C][C] 3.588e-06[/C][C] 7.176e-06[/C][C] 1[/C][/ROW]
[ROW][C]67[/C][C] 3.985e-05[/C][C] 7.97e-05[/C][C] 1[/C][/ROW]
[ROW][C]68[/C][C] 0.000254[/C][C] 0.000508[/C][C] 0.9997[/C][/ROW]
[ROW][C]69[/C][C] 0.0002039[/C][C] 0.0004077[/C][C] 0.9998[/C][/ROW]
[ROW][C]70[/C][C] 0.0001351[/C][C] 0.0002701[/C][C] 0.9999[/C][/ROW]
[ROW][C]71[/C][C] 0.0001298[/C][C] 0.0002596[/C][C] 0.9999[/C][/ROW]
[ROW][C]72[/C][C] 8.684e-05[/C][C] 0.0001737[/C][C] 0.9999[/C][/ROW]
[ROW][C]73[/C][C] 5.279e-05[/C][C] 0.0001056[/C][C] 0.9999[/C][/ROW]
[ROW][C]74[/C][C] 4.604e-05[/C][C] 9.209e-05[/C][C] 1[/C][/ROW]
[ROW][C]75[/C][C] 2.719e-05[/C][C] 5.437e-05[/C][C] 1[/C][/ROW]
[ROW][C]76[/C][C] 1.719e-05[/C][C] 3.438e-05[/C][C] 1[/C][/ROW]
[ROW][C]77[/C][C] 1.121e-05[/C][C] 2.241e-05[/C][C] 1[/C][/ROW]
[ROW][C]78[/C][C] 5.922e-05[/C][C] 0.0001184[/C][C] 0.9999[/C][/ROW]
[ROW][C]79[/C][C] 0.004961[/C][C] 0.009922[/C][C] 0.995[/C][/ROW]
[ROW][C]80[/C][C] 0.04635[/C][C] 0.09271[/C][C] 0.9536[/C][/ROW]
[ROW][C]81[/C][C] 0.05233[/C][C] 0.1047[/C][C] 0.9477[/C][/ROW]
[ROW][C]82[/C][C] 0.04185[/C][C] 0.0837[/C][C] 0.9581[/C][/ROW]
[ROW][C]83[/C][C] 0.03566[/C][C] 0.07133[/C][C] 0.9643[/C][/ROW]
[ROW][C]84[/C][C] 0.03651[/C][C] 0.07302[/C][C] 0.9635[/C][/ROW]
[ROW][C]85[/C][C] 0.03273[/C][C] 0.06546[/C][C] 0.9673[/C][/ROW]
[ROW][C]86[/C][C] 0.03804[/C][C] 0.07607[/C][C] 0.962[/C][/ROW]
[ROW][C]87[/C][C] 0.04231[/C][C] 0.08462[/C][C] 0.9577[/C][/ROW]
[ROW][C]88[/C][C] 0.04306[/C][C] 0.08613[/C][C] 0.9569[/C][/ROW]
[ROW][C]89[/C][C] 0.0429[/C][C] 0.08581[/C][C] 0.9571[/C][/ROW]
[ROW][C]90[/C][C] 0.1058[/C][C] 0.2116[/C][C] 0.8942[/C][/ROW]
[ROW][C]91[/C][C] 0.3204[/C][C] 0.6409[/C][C] 0.6796[/C][/ROW]
[ROW][C]92[/C][C] 0.5985[/C][C] 0.8029[/C][C] 0.4015[/C][/ROW]
[ROW][C]93[/C][C] 0.5889[/C][C] 0.8222[/C][C] 0.4111[/C][/ROW]
[ROW][C]94[/C][C] 0.5349[/C][C] 0.9303[/C][C] 0.4651[/C][/ROW]
[ROW][C]95[/C][C] 0.5229[/C][C] 0.9543[/C][C] 0.4771[/C][/ROW]
[ROW][C]96[/C][C] 0.5134[/C][C] 0.9733[/C][C] 0.4866[/C][/ROW]
[ROW][C]97[/C][C] 0.489[/C][C] 0.9781[/C][C] 0.511[/C][/ROW]
[ROW][C]98[/C][C] 0.5134[/C][C] 0.9731[/C][C] 0.4866[/C][/ROW]
[ROW][C]99[/C][C] 0.6387[/C][C] 0.7226[/C][C] 0.3613[/C][/ROW]
[ROW][C]100[/C][C] 0.6719[/C][C] 0.6561[/C][C] 0.3281[/C][/ROW]
[ROW][C]101[/C][C] 0.6723[/C][C] 0.6555[/C][C] 0.3277[/C][/ROW]
[ROW][C]102[/C][C] 0.8038[/C][C] 0.3923[/C][C] 0.1962[/C][/ROW]
[ROW][C]103[/C][C] 0.8844[/C][C] 0.2313[/C][C] 0.1156[/C][/ROW]
[ROW][C]104[/C][C] 0.9302[/C][C] 0.1397[/C][C] 0.06983[/C][/ROW]
[ROW][C]105[/C][C] 0.9544[/C][C] 0.09119[/C][C] 0.0456[/C][/ROW]
[ROW][C]106[/C][C] 0.9574[/C][C] 0.08518[/C][C] 0.04259[/C][/ROW]
[ROW][C]107[/C][C] 0.9854[/C][C] 0.02913[/C][C] 0.01457[/C][/ROW]
[ROW][C]108[/C][C] 0.9964[/C][C] 0.007245[/C][C] 0.003622[/C][/ROW]
[ROW][C]109[/C][C] 0.9973[/C][C] 0.005441[/C][C] 0.00272[/C][/ROW]
[ROW][C]110[/C][C] 0.9985[/C][C] 0.002913[/C][C] 0.001456[/C][/ROW]
[ROW][C]111[/C][C] 0.9992[/C][C] 0.001509[/C][C] 0.0007546[/C][/ROW]
[ROW][C]112[/C][C] 0.9987[/C][C] 0.002678[/C][C] 0.001339[/C][/ROW]
[ROW][C]113[/C][C] 0.9977[/C][C] 0.004679[/C][C] 0.002339[/C][/ROW]
[ROW][C]114[/C][C] 0.9965[/C][C] 0.007064[/C][C] 0.003532[/C][/ROW]
[ROW][C]115[/C][C] 0.9978[/C][C] 0.004467[/C][C] 0.002233[/C][/ROW]
[ROW][C]116[/C][C] 0.9975[/C][C] 0.005021[/C][C] 0.00251[/C][/ROW]
[ROW][C]117[/C][C] 0.9955[/C][C] 0.009[/C][C] 0.0045[/C][/ROW]
[ROW][C]118[/C][C] 0.9913[/C][C] 0.01749[/C][C] 0.008746[/C][/ROW]
[ROW][C]119[/C][C] 0.9858[/C][C] 0.02832[/C][C] 0.01416[/C][/ROW]
[ROW][C]120[/C][C] 0.9779[/C][C] 0.04415[/C][C] 0.02207[/C][/ROW]
[ROW][C]121[/C][C] 0.9637[/C][C] 0.07262[/C][C] 0.03631[/C][/ROW]
[ROW][C]122[/C][C] 0.9385[/C][C] 0.1229[/C][C] 0.06147[/C][/ROW]
[ROW][C]123[/C][C] 0.9739[/C][C] 0.05211[/C][C] 0.02605[/C][/ROW]
[ROW][C]124[/C][C] 0.9618[/C][C] 0.07642[/C][C] 0.03821[/C][/ROW]
[ROW][C]125[/C][C] 0.9244[/C][C] 0.1511[/C][C] 0.07556[/C][/ROW]
[ROW][C]126[/C][C] 0.8953[/C][C] 0.2094[/C][C] 0.1047[/C][/ROW]
[ROW][C]127[/C][C] 0.966[/C][C] 0.06794[/C][C] 0.03397[/C][/ROW]
[ROW][C]128[/C][C] 0.9266[/C][C] 0.1468[/C][C] 0.07342[/C][/ROW]
[/TABLE]
Source: https://freestatistics.org/blog/index.php?pk=285739&T=5

Globally Unique Identifier (entire table): ba.freestatistics.org/blog/index.php?pk=285739&T=5

As an alternative you can also use a QR Code:  

The GUIDs for individual cells are displayed in the table below:

Goldfeld-Quandt test for Heteroskedasticity
p-valuesAlternative Hypothesis
breakpoint indexgreater2-sidedless
16 0.0006234 0.001247 0.9994
17 5.925e-05 0.0001185 0.9999
18 5.92e-05 0.0001184 0.9999
19 0.0002141 0.0004282 0.9998
20 0.0001604 0.0003209 0.9998
21 7.883e-05 0.0001577 0.9999
22 1.738e-05 3.476e-05 1
23 4.074e-06 8.148e-06 1
24 2.007e-06 4.014e-06 1
25 1.617e-06 3.235e-06 1
26 6.2e-07 1.24e-06 1
27 2.21e-06 4.421e-06 1
28 7.571e-07 1.514e-06 1
29 4.126e-06 8.252e-06 1
30 1.653e-06 3.305e-06 1
31 1.048e-06 2.096e-06 1
32 6.277e-07 1.255e-06 1
33 2.29e-07 4.581e-07 1
34 8.363e-08 1.673e-07 1
35 4.268e-08 8.537e-08 1
36 1.872e-08 3.745e-08 1
37 7.446e-09 1.489e-08 1
38 5.135e-09 1.027e-08 1
39 1.853e-09 3.707e-09 1
40 7.179e-10 1.436e-09 1
41 2.131e-10 4.262e-10 1
42 9.84e-10 1.968e-09 1
43 1.277e-09 2.555e-09 1
44 1.011e-08 2.022e-08 1
45 3.615e-09 7.231e-09 1
46 1.747e-09 3.495e-09 1
47 1.372e-09 2.743e-09 1
48 9.181e-10 1.836e-09 1
49 4.565e-10 9.129e-10 1
50 5.572e-10 1.114e-09 1
51 1.629e-09 3.257e-09 1
52 1.633e-08 3.266e-08 1
53 3.317e-08 6.633e-08 1
54 2.118e-08 4.236e-08 1
55 4.643e-08 9.287e-08 1
56 1.193e-07 2.385e-07 1
57 5.273e-08 1.055e-07 1
58 3.099e-08 6.198e-08 1
59 9.051e-08 1.81e-07 1
60 1.467e-07 2.934e-07 1
61 2.602e-07 5.204e-07 1
62 1.026e-05 2.051e-05 1
63 8.843e-06 1.769e-05 1
64 6.98e-06 1.396e-05 1
65 3.755e-06 7.51e-06 1
66 3.588e-06 7.176e-06 1
67 3.985e-05 7.97e-05 1
68 0.000254 0.000508 0.9997
69 0.0002039 0.0004077 0.9998
70 0.0001351 0.0002701 0.9999
71 0.0001298 0.0002596 0.9999
72 8.684e-05 0.0001737 0.9999
73 5.279e-05 0.0001056 0.9999
74 4.604e-05 9.209e-05 1
75 2.719e-05 5.437e-05 1
76 1.719e-05 3.438e-05 1
77 1.121e-05 2.241e-05 1
78 5.922e-05 0.0001184 0.9999
79 0.004961 0.009922 0.995
80 0.04635 0.09271 0.9536
81 0.05233 0.1047 0.9477
82 0.04185 0.0837 0.9581
83 0.03566 0.07133 0.9643
84 0.03651 0.07302 0.9635
85 0.03273 0.06546 0.9673
86 0.03804 0.07607 0.962
87 0.04231 0.08462 0.9577
88 0.04306 0.08613 0.9569
89 0.0429 0.08581 0.9571
90 0.1058 0.2116 0.8942
91 0.3204 0.6409 0.6796
92 0.5985 0.8029 0.4015
93 0.5889 0.8222 0.4111
94 0.5349 0.9303 0.4651
95 0.5229 0.9543 0.4771
96 0.5134 0.9733 0.4866
97 0.489 0.9781 0.511
98 0.5134 0.9731 0.4866
99 0.6387 0.7226 0.3613
100 0.6719 0.6561 0.3281
101 0.6723 0.6555 0.3277
102 0.8038 0.3923 0.1962
103 0.8844 0.2313 0.1156
104 0.9302 0.1397 0.06983
105 0.9544 0.09119 0.0456
106 0.9574 0.08518 0.04259
107 0.9854 0.02913 0.01457
108 0.9964 0.007245 0.003622
109 0.9973 0.005441 0.00272
110 0.9985 0.002913 0.001456
111 0.9992 0.001509 0.0007546
112 0.9987 0.002678 0.001339
113 0.9977 0.004679 0.002339
114 0.9965 0.007064 0.003532
115 0.9978 0.004467 0.002233
116 0.9975 0.005021 0.00251
117 0.9955 0.009 0.0045
118 0.9913 0.01749 0.008746
119 0.9858 0.02832 0.01416
120 0.9779 0.04415 0.02207
121 0.9637 0.07262 0.03631
122 0.9385 0.1229 0.06147
123 0.9739 0.05211 0.02605
124 0.9618 0.07642 0.03821
125 0.9244 0.1511 0.07556
126 0.8953 0.2094 0.1047
127 0.966 0.06794 0.03397
128 0.9266 0.1468 0.07342


Meta Analysis of Goldfeld-Quandt test for Heteroskedasticity
Description# significant tests% significant testsOK/NOK
1% type I error level74 0.6549NOK
5% type I error level780.690265NOK
10% type I error level930.823009NOK

\begin{tabular}{lllllllll}
\hline
Meta Analysis of Goldfeld-Quandt test for Heteroskedasticity \tabularnewline
Description & # significant tests & % significant tests & OK/NOK \tabularnewline
1% type I error level & 74 &  0.6549 & NOK \tabularnewline
5% type I error level & 78 & 0.690265 & NOK \tabularnewline
10% type I error level & 93 & 0.823009 & NOK \tabularnewline
\hline
\end{tabular}
%Source: https://freestatistics.org/blog/index.php?pk=285739&T=6

[TABLE]
[ROW][C]Meta Analysis of Goldfeld-Quandt test for Heteroskedasticity[/C][/ROW]
[ROW][C]Description[/C][C]# significant tests[/C][C]% significant tests[/C][C]OK/NOK[/C][/ROW]
[ROW][C]1% type I error level[/C][C]74[/C][C] 0.6549[/C][C]NOK[/C][/ROW]
[ROW][C]5% type I error level[/C][C]78[/C][C]0.690265[/C][C]NOK[/C][/ROW]
[ROW][C]10% type I error level[/C][C]93[/C][C]0.823009[/C][C]NOK[/C][/ROW]
[/TABLE]
Source: https://freestatistics.org/blog/index.php?pk=285739&T=6

Globally Unique Identifier (entire table): ba.freestatistics.org/blog/index.php?pk=285739&T=6

As an alternative you can also use a QR Code:  

The GUIDs for individual cells are displayed in the table below:

Meta Analysis of Goldfeld-Quandt test for Heteroskedasticity
Description# significant tests% significant testsOK/NOK
1% type I error level74 0.6549NOK
5% type I error level780.690265NOK
10% type I error level930.823009NOK


Parameters (Session):
par1 = 1 ; par2 = Include Monthly Dummies ; par3 = Linear Trend ;
Parameters (R input):
par1 = 1 ; par2 = Include Monthly Dummies ; par3 = Linear Trend ; par4 = ; par5 = ;
R code (references can be found in the software module):
library(lattice)
library(lmtest)
n25 <- 25 #minimum number of obs. for Goldfeld-Quandt test
mywarning <- ''
par1 <- as.numeric(par1)
if(is.na(par1)) {
par1 <- 1
mywarning = 'Warning: you did not specify the column number of the endogenous series! The first column was selected by default.'
}
if (par4=='') par4 <- 0
par4 <- as.numeric(par4)
if (par5=='') par5 <- 0
par5 <- as.numeric(par5)
x <- na.omit(t(y))
k <- length(x[1,])
n <- length(x[,1])
x1 <- cbind(x[,par1], x[,1:k!=par1])
mycolnames <- c(colnames(x)[par1], colnames(x)[1:k!=par1])
colnames(x1) <- mycolnames #colnames(x)[par1]
x <- x1
if (par3 == 'First Differences'){
(n <- n -1)
x2 <- array(0, dim=c(n,k), dimnames=list(1:n, paste('(1-B)',colnames(x),sep='')))
for (i in 1:n) {
for (j in 1:k) {
x2[i,j] <- x[i+1,j] - x[i,j]
}
}
x <- x2
}
if (par3 == 'Seasonal Differences (s=12)'){
(n <- n - 12)
x2 <- array(0, dim=c(n,k), dimnames=list(1:n, paste('(1-B12)',colnames(x),sep='')))
for (i in 1:n) {
for (j in 1:k) {
x2[i,j] <- x[i+12,j] - x[i,j]
}
}
x <- x2
}
if (par3 == 'First and Seasonal Differences (s=12)'){
(n <- n -1)
x2 <- array(0, dim=c(n,k), dimnames=list(1:n, paste('(1-B)',colnames(x),sep='')))
for (i in 1:n) {
for (j in 1:k) {
x2[i,j] <- x[i+1,j] - x[i,j]
}
}
x <- x2
(n <- n - 12)
x2 <- array(0, dim=c(n,k), dimnames=list(1:n, paste('(1-B12)',colnames(x),sep='')))
for (i in 1:n) {
for (j in 1:k) {
x2[i,j] <- x[i+12,j] - x[i,j]
}
}
x <- x2
}
if(par4 > 0) {
x2 <- array(0, dim=c(n-par4,par4), dimnames=list(1:(n-par4), paste(colnames(x)[par1],'(t-',1:par4,')',sep='')))
for (i in 1:(n-par4)) {
for (j in 1:par4) {
x2[i,j] <- x[i+par4-j,par1]
}
}
x <- cbind(x[(par4+1):n,], x2)
n <- n - par4
}
if(par5 > 0) {
x2 <- array(0, dim=c(n-par5*12,par5), dimnames=list(1:(n-par5*12), paste(colnames(x)[par1],'(t-',1:par5,'s)',sep='')))
for (i in 1:(n-par5*12)) {
for (j in 1:par5) {
x2[i,j] <- x[i+par5*12-j*12,par1]
}
}
x <- cbind(x[(par5*12+1):n,], x2)
n <- n - par5*12
}
if (par2 == 'Include Monthly Dummies'){
x2 <- array(0, dim=c(n,11), dimnames=list(1:n, paste('M', seq(1:11), sep ='')))
for (i in 1:11){
x2[seq(i,n,12),i] <- 1
}
x <- cbind(x, x2)
}
if (par2 == 'Include Quarterly Dummies'){
x2 <- array(0, dim=c(n,3), dimnames=list(1:n, paste('Q', seq(1:3), sep ='')))
for (i in 1:3){
x2[seq(i,n,4),i] <- 1
}
x <- cbind(x, x2)
}
(k <- length(x[n,]))
if (par3 == 'Linear Trend'){
x <- cbind(x, c(1:n))
colnames(x)[k+1] <- 't'
}
x
(k <- length(x[n,]))
head(x)
df <- as.data.frame(x)
(mylm <- lm(df))
(mysum <- summary(mylm))
if (n > n25) {
kp3 <- k + 3
nmkm3 <- n - k - 3
gqarr <- array(NA, dim=c(nmkm3-kp3+1,3))
numgqtests <- 0
numsignificant1 <- 0
numsignificant5 <- 0
numsignificant10 <- 0
for (mypoint in kp3:nmkm3) {
j <- 0
numgqtests <- numgqtests + 1
for (myalt in c('greater', 'two.sided', 'less')) {
j <- j + 1
gqarr[mypoint-kp3+1,j] <- gqtest(mylm, point=mypoint, alternative=myalt)$p.value
}
if (gqarr[mypoint-kp3+1,2] < 0.01) numsignificant1 <- numsignificant1 + 1
if (gqarr[mypoint-kp3+1,2] < 0.05) numsignificant5 <- numsignificant5 + 1
if (gqarr[mypoint-kp3+1,2] < 0.10) numsignificant10 <- numsignificant10 + 1
}
gqarr
}
bitmap(file='test0.png')
plot(x[,1], type='l', main='Actuals and Interpolation', ylab='value of Actuals and Interpolation (dots)', xlab='time or index')
points(x[,1]-mysum$resid)
grid()
dev.off()
bitmap(file='test1.png')
plot(mysum$resid, type='b', pch=19, main='Residuals', ylab='value of Residuals', xlab='time or index')
grid()
dev.off()
bitmap(file='test2.png')
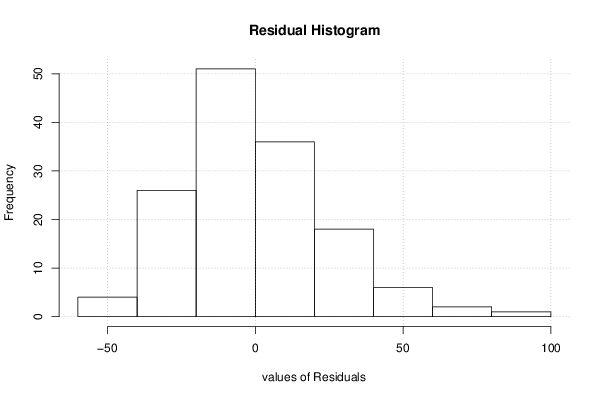
hist(mysum$resid, main='Residual Histogram', xlab='values of Residuals')
grid()
dev.off()
bitmap(file='test3.png')
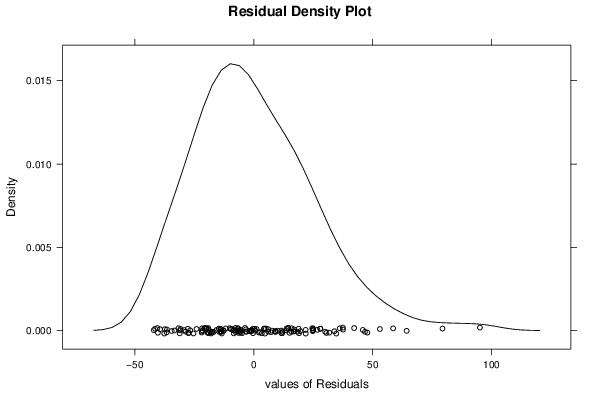
densityplot(~mysum$resid,col='black',main='Residual Density Plot', xlab='values of Residuals')
dev.off()
bitmap(file='test4.png')
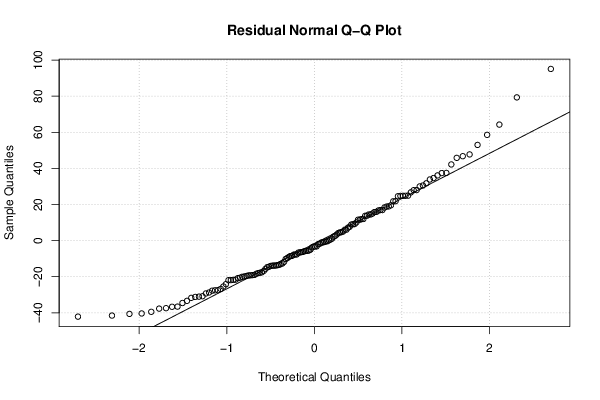
qqnorm(mysum$resid, main='Residual Normal Q-Q Plot')
qqline(mysum$resid)
grid()
dev.off()
(myerror <- as.ts(mysum$resid))
bitmap(file='test5.png')
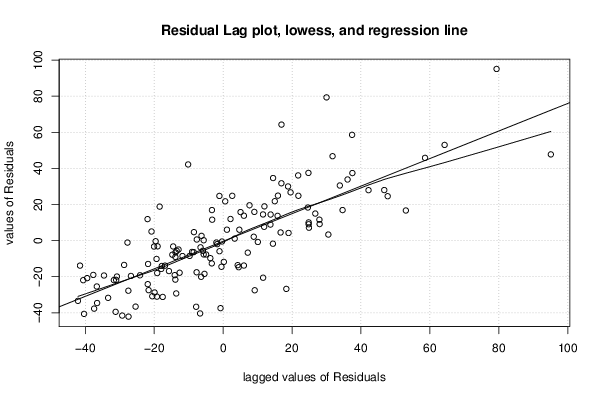
dum <- cbind(lag(myerror,k=1),myerror)
dum
dum1 <- dum[2:length(myerror),]
dum1
z <- as.data.frame(dum1)
z
plot(z,main=paste('Residual Lag plot, lowess, and regression line'), ylab='values of Residuals', xlab='lagged values of Residuals')
lines(lowess(z))
abline(lm(z))
grid()
dev.off()
bitmap(file='test6.png')
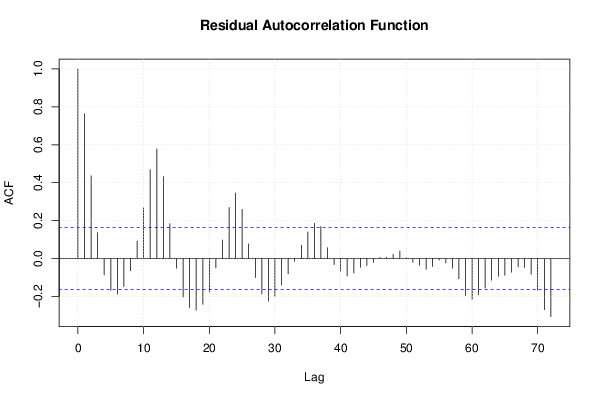
acf(mysum$resid, lag.max=length(mysum$resid)/2, main='Residual Autocorrelation Function')
grid()
dev.off()
bitmap(file='test7.png')
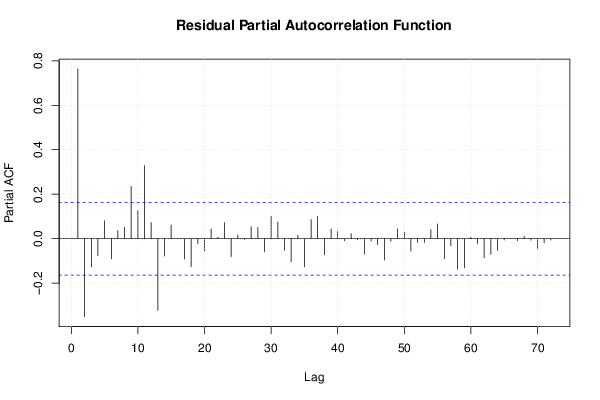
pacf(mysum$resid, lag.max=length(mysum$resid)/2, main='Residual Partial Autocorrelation Function')
grid()
dev.off()
bitmap(file='test8.png')
opar <- par(mfrow = c(2,2), oma = c(0, 0, 1.1, 0))
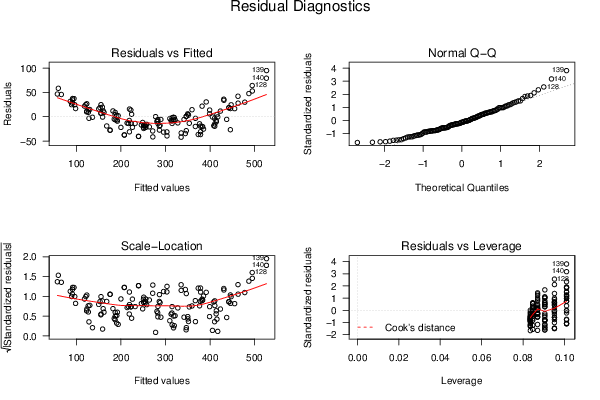
plot(mylm, las = 1, sub='Residual Diagnostics')
par(opar)
dev.off()
if (n > n25) {
bitmap(file='test9.png')
plot(kp3:nmkm3,gqarr[,2], main='Goldfeld-Quandt test',ylab='2-sided p-value',xlab='breakpoint')
grid()
dev.off()
}
load(file='createtable')
a<-table.start()
a<-table.row.start(a)
a<-table.element(a, 'Multiple Linear Regression - Estimated Regression Equation', 1, TRUE)
a<-table.row.end(a)
myeq <- colnames(x)[1]
myeq <- paste(myeq, '[t] = ', sep='')
for (i in 1:k){
if (mysum$coefficients[i,1] > 0) myeq <- paste(myeq, '+', '')
myeq <- paste(myeq, signif(mysum$coefficients[i,1],6), sep=' ')
if (rownames(mysum$coefficients)[i] != '(Intercept)') {
myeq <- paste(myeq, rownames(mysum$coefficients)[i], sep='')
if (rownames(mysum$coefficients)[i] != 't') myeq <- paste(myeq, '[t]', sep='')
}
}
myeq <- paste(myeq, ' + e[t]')
a<-table.row.start(a)
a<-table.element(a, myeq)
a<-table.row.end(a)
a<-table.row.start(a)
a<-table.element(a, mywarning)
a<-table.row.end(a)
a<-table.end(a)
table.save(a,file='mytable1.tab')
a<-table.start()
a<-table.row.start(a)
a<-table.element(a,hyperlink('ols1.htm','Multiple Linear Regression - Ordinary Least Squares',''), 6, TRUE)
a<-table.row.end(a)
a<-table.row.start(a)
a<-table.element(a,'Variable',header=TRUE)
a<-table.element(a,'Parameter',header=TRUE)
a<-table.element(a,'S.D.',header=TRUE)
a<-table.element(a,'T-STAT
H0: parameter = 0',header=TRUE)
a<-table.element(a,'2-tail p-value',header=TRUE)
a<-table.element(a,'1-tail p-value',header=TRUE)
a<-table.row.end(a)
for (i in 1:k){
a<-table.row.start(a)
a<-table.element(a,rownames(mysum$coefficients)[i],header=TRUE)
a<-table.element(a,formatC(signif(mysum$coefficients[i,1],5),format='g',flag='+'))
a<-table.element(a,formatC(signif(mysum$coefficients[i,2],5),format='g',flag=' '))
a<-table.element(a,formatC(signif(mysum$coefficients[i,3],4),format='e',flag='+'))
a<-table.element(a,formatC(signif(mysum$coefficients[i,4],4),format='g',flag=' '))
a<-table.element(a,formatC(signif(mysum$coefficients[i,4]/2,4),format='g',flag=' '))
a<-table.row.end(a)
}
a<-table.end(a)
table.save(a,file='mytable2.tab')
a<-table.start()
a<-table.row.start(a)
a<-table.element(a, 'Multiple Linear Regression - Regression Statistics', 2, TRUE)
a<-table.row.end(a)
a<-table.row.start(a)
a<-table.element(a, 'Multiple R',1,TRUE)
a<-table.element(a,formatC(signif(sqrt(mysum$r.squared),6),format='g',flag=' '))
a<-table.row.end(a)
a<-table.row.start(a)
a<-table.element(a, 'R-squared',1,TRUE)
a<-table.element(a,formatC(signif(mysum$r.squared,6),format='g',flag=' '))
a<-table.row.end(a)
a<-table.row.start(a)
a<-table.element(a, 'Adjusted R-squared',1,TRUE)
a<-table.element(a,formatC(signif(mysum$adj.r.squared,6),format='g',flag=' '))
a<-table.row.end(a)
a<-table.row.start(a)
a<-table.element(a, 'F-TEST (value)',1,TRUE)
a<-table.element(a,formatC(signif(mysum$fstatistic[1],6),format='g',flag=' '))
a<-table.row.end(a)
a<-table.row.start(a)
a<-table.element(a, 'F-TEST (DF numerator)',1,TRUE)
a<-table.element(a, signif(mysum$fstatistic[2],6))
a<-table.row.end(a)
a<-table.row.start(a)
a<-table.element(a, 'F-TEST (DF denominator)',1,TRUE)
a<-table.element(a, signif(mysum$fstatistic[3],6))
a<-table.row.end(a)
a<-table.row.start(a)
a<-table.element(a, 'p-value',1,TRUE)
a<-table.element(a,formatC(signif(1-pf(mysum$fstatistic[1],mysum$fstatistic[2],mysum$fstatistic[3]),6),format='g',flag=' '))
a<-table.row.end(a)
a<-table.row.start(a)
a<-table.element(a, 'Multiple Linear Regression - Residual Statistics', 2, TRUE)
a<-table.row.end(a)
a<-table.row.start(a)
a<-table.element(a, 'Residual Standard Deviation',1,TRUE)
a<-table.element(a,formatC(signif(mysum$sigma,6),format='g',flag=' '))
a<-table.row.end(a)
a<-table.row.start(a)
a<-table.element(a, 'Sum Squared Residuals',1,TRUE)
a<-table.element(a,formatC(signif(sum(myerror*myerror),6),format='g',flag=' '))
a<-table.row.end(a)
a<-table.end(a)
table.save(a,file='mytable3.tab')
if(n < 200) {
a<-table.start()
a<-table.row.start(a)
a<-table.element(a, 'Multiple Linear Regression - Actuals, Interpolation, and Residuals', 4, TRUE)
a<-table.row.end(a)
a<-table.row.start(a)
a<-table.element(a, 'Time or Index', 1, TRUE)
a<-table.element(a, 'Actuals', 1, TRUE)
a<-table.element(a, 'Interpolation
Forecast', 1, TRUE)
a<-table.element(a, 'Residuals
Prediction Error', 1, TRUE)
a<-table.row.end(a)
for (i in 1:n) {
a<-table.row.start(a)
a<-table.element(a,i, 1, TRUE)
a<-table.element(a,formatC(signif(x[i],6),format='g',flag=' '))
a<-table.element(a,formatC(signif(x[i]-mysum$resid[i],6),format='g',flag=' '))
a<-table.element(a,formatC(signif(mysum$resid[i],6),format='g',flag=' '))
a<-table.row.end(a)
}
a<-table.end(a)
table.save(a,file='mytable4.tab')
if (n > n25) {
a<-table.start()
a<-table.row.start(a)
a<-table.element(a,'Goldfeld-Quandt test for Heteroskedasticity',4,TRUE)
a<-table.row.end(a)
a<-table.row.start(a)
a<-table.element(a,'p-values',header=TRUE)
a<-table.element(a,'Alternative Hypothesis',3,header=TRUE)
a<-table.row.end(a)
a<-table.row.start(a)
a<-table.element(a,'breakpoint index',header=TRUE)
a<-table.element(a,'greater',header=TRUE)
a<-table.element(a,'2-sided',header=TRUE)
a<-table.element(a,'less',header=TRUE)
a<-table.row.end(a)
for (mypoint in kp3:nmkm3) {
a<-table.row.start(a)
a<-table.element(a,mypoint,header=TRUE)
a<-table.element(a,formatC(signif(gqarr[mypoint-kp3+1,1],6),format='g',flag=' '))
a<-table.element(a,formatC(signif(gqarr[mypoint-kp3+1,2],6),format='g',flag=' '))
a<-table.element(a,formatC(signif(gqarr[mypoint-kp3+1,3],6),format='g',flag=' '))
a<-table.row.end(a)
}
a<-table.end(a)
table.save(a,file='mytable5.tab')
a<-table.start()
a<-table.row.start(a)
a<-table.element(a,'Meta Analysis of Goldfeld-Quandt test for Heteroskedasticity',4,TRUE)
a<-table.row.end(a)
a<-table.row.start(a)
a<-table.element(a,'Description',header=TRUE)
a<-table.element(a,'# significant tests',header=TRUE)
a<-table.element(a,'% significant tests',header=TRUE)
a<-table.element(a,'OK/NOK',header=TRUE)
a<-table.row.end(a)
a<-table.row.start(a)
a<-table.element(a,'1% type I error level',header=TRUE)
a<-table.element(a,signif(numsignificant1,6))
a<-table.element(a,formatC(signif(numsignificant1/numgqtests,6),format='g',flag=' '))
if (numsignificant1/numgqtests < 0.01) dum <- 'OK' else dum <- 'NOK'
a<-table.element(a,dum)
a<-table.row.end(a)
a<-table.row.start(a)
a<-table.element(a,'5% type I error level',header=TRUE)
a<-table.element(a,signif(numsignificant5,6))
a<-table.element(a,signif(numsignificant5/numgqtests,6))
if (numsignificant5/numgqtests < 0.05) dum <- 'OK' else dum <- 'NOK'
a<-table.element(a,dum)
a<-table.row.end(a)
a<-table.row.start(a)
a<-table.element(a,'10% type I error level',header=TRUE)
a<-table.element(a,signif(numsignificant10,6))
a<-table.element(a,signif(numsignificant10/numgqtests,6))
if (numsignificant10/numgqtests < 0.1) dum <- 'OK' else dum <- 'NOK'
a<-table.element(a,dum)
a<-table.row.end(a)
a<-table.end(a)
table.save(a,file='mytable6.tab')
}
}