Free Statistics

of Irreproducible Research!

Author's title

Author*The author of this computation has been verified*
R Software Modulerwasp_bootstrapplot1.wasp
Title produced by softwareBootstrap Plot - Central Tendency
Date of computationWed, 09 Dec 2015 19:07:42 +0000
Cite this page as followsStatistical Computations at FreeStatistics.org, Office for Research Development and Education, URL https://freestatistics.org/blog/index.php?v=date/2015/Dec/09/t1449688178rm3mop9s78zpqhc.htm/, Retrieved Thu, 16 May 2024 22:51:31 +0000
Statistical Computations at FreeStatistics.org, Office for Research Development and Education, URL https://freestatistics.org/blog/index.php?pk=285766, Retrieved Thu, 16 May 2024 22:51:31 +0000
QR Codes:

Original text written by user:
IsPrivate?No (this computation is public)
User-defined keywords
Estimated Impact55
Family? (F = Feedback message, R = changed R code, M = changed R Module, P = changed Parameters, D = changed Data)
-       [Bootstrap Plot - Central Tendency] [] [2015-12-09 19:07:42] [1c5666356175e1d85fcbdeca5bcd6104] [Current]
Feedback Forum

Post a new message
Dataseries X:
2441
3406
4029
1924
2319
2156
2117
2189
2625
1959
3096
1997
1813
2648
2648
5782
2218
25289
25389
25196
24153
26079
26540
25099
27402
26206
26526
27154
24464
24967
24713
26733
24578
26092
24486
24630
26233
26492
24973
27437
23829
27158
25670
23530
24474
26668
26060
24856
24067
25545
24213
23703
23566
22876
22744
27615
24421
24728
25732
24204
23869
24120
22474
26406
22440
20387
21609
24905
21584
20920
5042
4353
7996
3998
4697
7837
3512
3503
3572
3918
4767
5833
4154
3894
4133
4273
5574
5029
5279
4876
3850
4109
4137
3725
5675
3405
3568
3408
7203
5392
4053
7863
3716
4027
3608
3333
3014
5014
4328
2956
6535
3153
3081
2996
3150
3673
2870
3230
3821
3178
2988
2347
2891
4775
4758
2962
2687
2825
4201
2545
2626
3556
6069
2795
2763
3024
2622
3800
5217
3163
3765
2991
4856
5752
3351
3392
3145
3820
4790
2729
3025
2428
2981
3051
6330
3006
3301
5265
3975
2643
3130
3832
3819
3037
4272
10589
8945
7764
8704
7546
7694
10499
7614
8248
8158
8174
8097
9154
10287
7972
7518
9492
8317
8158
9174
8262
10533
10434
8047
7831
8062
8834
8957
8753
7663
8290
8435
10802
9391
10280
8461
9152
8380
8171
8386
8212
9103
8461
8443
9253
8220
10435
8627
8196
9431
7917
8186
4350
9341
9545
10624
10665
11698
9516
8815
8389
10475
10170
9192
9198
8764
9996
9219
10801
8631
11110
8101
9696
10542
10069
11789
9416
9543
8919
8958
8933
11251
9589
8870
9108
9544
9611
11798
11269
10411
9690
9625
9522
10330
10803
9946
9782
11660
9960
10286
10790
10188
9465
7791
7793
8175
10328
4510
3589
4039
7656
4662
5001
7089
4103
4314
7187
5954
3597
3647
8287
4192
4046
5195
7626
5232
5251
5043
5842
4879
5429
4772
6159
3761
8832
4337
3979
4886
6057
4922
4650
4938
6610
6041
11379
10702
7455
8425
7679
8312
7238
9412
7698
7776
7870
8122
9138
10187
8315
8424
7731
8079
7926
9975
8397
8572
8157
7856
9835
9524
7750
8221
8998
9875
8015
7749
8174
8504
11129
12615
12219
10828
11463
12524
10638
11085
10831
12022
10544
11569
10889
11064
11221
10339
10652
11155
3597
2768
2812
3781
7789
2886
2283
2389
3784
2990
3615
2767
2673
3068
2894
2621
6440
3082
5532
2421
3653
2656
3059
3341
2387
2469
2758
2254
2305
7075
2260
2988
2091
2169
15711
14409
17306
17157
17611
20394
18757
20250
17622
17270
18330
17580
18128
17261
17287
17433
17518
16890
18728
16953
17970
16920
19400
15769
17431
16058
15312
16214
15962
15852
15634
17699
16100
16252
17874
14058
14466
14531
14102
14014
16871
14903
16411
14687
14363
16062
15361
16134
14256
15863
14196
14120
14825
16946
23867
24107
24041
24415
24496
24022
24367
23869
24495
23818
24081
24132
23651
23622
23726
23942
24573
23085
22612
22960
22921
23510
22729
23047
22850
23426
22812
22446
23567
23185
22777
23508
23193
23006
22332
22347
23061
22887
22890
22701
22467
22357
22443
22824
22906
23059
23055
22564
18570
20329
19279
19541
19517
6519
7169
8107
10668
6650
5726
5224
6297
5011
5075
5434
11758
4531
5373
6343
20051
5482
5066
5040
5100
4679
10940
6035
5364
4424
4486
4962
10445
5973
5415
17792
5581
4997
6893
10181
7007
6621
7309
6114
5521
5263
5400
6141
5736
16104
10810
5057
5732
4000
4000
4200
3551
4025
5591
3868
3566
4525
3752
3182
6152
3548
6876
3199
3386
3411
6892
4920
3193
3054
3262
3509
3471
3101
5956
6232
5456
3186
3751
2973
5548
3219
6595
4886
3082
3516
3807
3607
3163
4981
3276
3278
3850
3439
5545
4749
3656
3520
4392
3057
6542
2785
3057
4379
23934
23625
26185
23777
24586
25439
24037
25403
25133
24023
23901
24892
24560
24226
24885
25466
24903
23761
23868
26118
25120
26119
25440
24206
25312
24499
24330
24217
25047
25817
25466
25410
26246
25718
26543
26723
26700
24743
25520
25298
26382
25719
24547
25640
26103
24911
25199
25308
17000
12000
20000
3915
3229
6671
5937
3639
4274
3781
5612
4498
3520
6323
3622
4085
3978
3788
3973
3268
6852
6237
9194
9177
6170
6295
5878
7172
5741
7093
5774
5690
7717
6511
6989
9006
6052
5094
6198
8845
6219
5984
7303
6887
8083
18978
25222
6093
7206
8070
16129
7646
5415
10480
5998
6289
6146
12308
7128
7653
10130
8741
7719
8167
7786
8091
8089
7219
7373
20659
7158
7503
7654
7747
8631
6867
17989
6798
7485
7085
7235
8534
7785
7017
5951
6709
6999
6175
5927
6703
6118
4565
6178
5389
5079
7382
4305
4216
7849
4248
4238
4746
4227
4946
4234
4379
5464
4240
5465
5634
3984
6957
4492
3863
3845
3768
6071
3794
4078
3927
3931
5368
5142
5165
4432
5082
6087
4434
4360
5634
7836
5394
4327
4142
5251
4951
4565
4463
5922
4581
7566
5500
5745
6924
5354
5563
5369
5658
5215
5824
6667
7795
5490
5232
7739
5404
6045
6012
6287
5185
8080
7229
5602
5329
5401
8283
6359
5457
5654
6391
5765
6707
8214
5621
6387
8299
6526
5514
6659
6023
5701
6628
5845
5778
5668
5982
8294
5970
7440
5385
6226
6905
7566
6033
3338
2778
2876
3059
2827
3819
3319
5529
2791
6521
2959
4378
6042
3715
6219
2890
3134
3544
3915
3139
2989
2856
5619
3955
3027
3760
6323
3362
6263
5720
3035
6509
3123
3332
3298
4579
2963
5861
4549
6211
2942
3181
5019
6590
4528
3744
3096
2893
3946
2838
2804


Summary of computational transaction
Raw Inputview raw input (R code)
Raw Outputview raw output of R engine
Computing time16 seconds
R Server'Sir Maurice George Kendall' @ kendall.wessa.net

\begin{tabular}{lllllllll}
\hline
Summary of computational transaction \tabularnewline
Raw Input & view raw input (R code)  \tabularnewline
Raw Output & view raw output of R engine  \tabularnewline
Computing time & 16 seconds \tabularnewline
R Server & 'Sir Maurice George Kendall' @ kendall.wessa.net \tabularnewline
\hline
\end{tabular}
%Source: https://freestatistics.org/blog/index.php?pk=285766&T=0

[TABLE]
[ROW][C]Summary of computational transaction[/C][/ROW]
[ROW][C]Raw Input[/C][C]view raw input (R code) [/C][/ROW]
[ROW][C]Raw Output[/C][C]view raw output of R engine [/C][/ROW]
[ROW][C]Computing time[/C][C]16 seconds[/C][/ROW]
[ROW][C]R Server[/C][C]'Sir Maurice George Kendall' @ kendall.wessa.net[/C][/ROW]
[/TABLE]
Source: https://freestatistics.org/blog/index.php?pk=285766&T=0

Globally Unique Identifier (entire table): ba.freestatistics.org/blog/index.php?pk=285766&T=0

As an alternative you can also use a QR Code:  

The GUIDs for individual cells are displayed in the table below:

Summary of computational transaction
Raw Inputview raw input (R code)
Raw Outputview raw output of R engine
Computing time16 seconds
R Server'Sir Maurice George Kendall' @ kendall.wessa.net


Estimation Results of Bootstrap
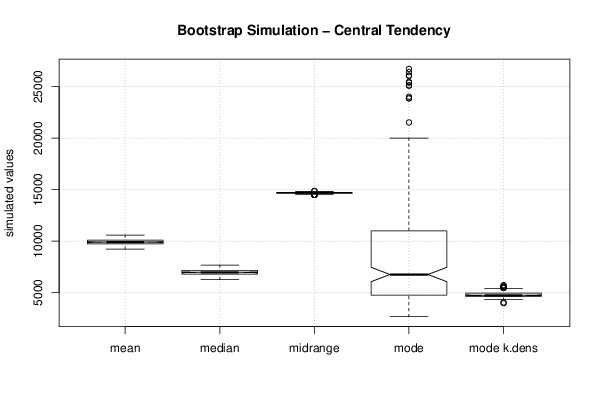
statisticP1P5Q1EstimateQ3P95P99S.D.IQR
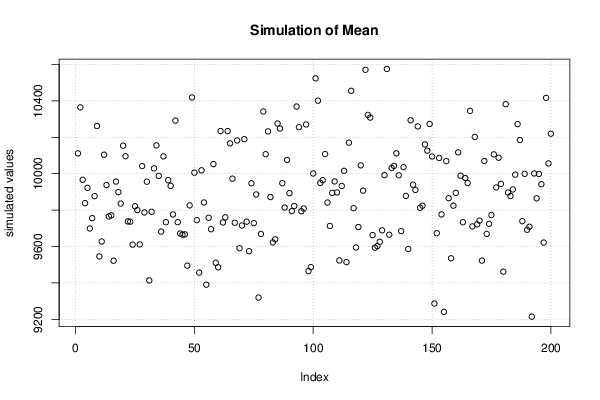
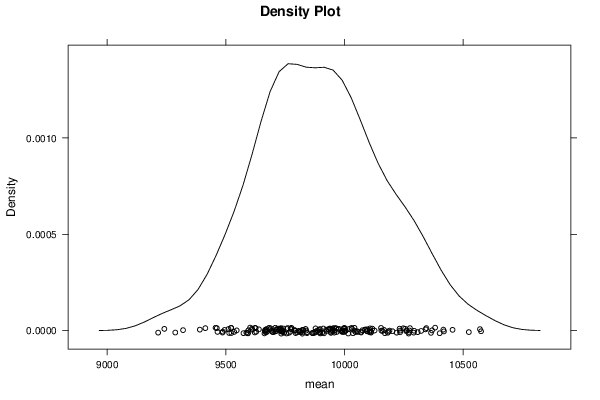
mean9300950097009900100001000011000270360
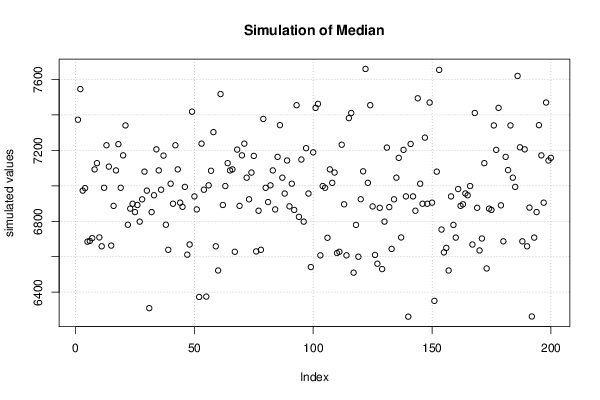
median6300650068007000720075007600280360
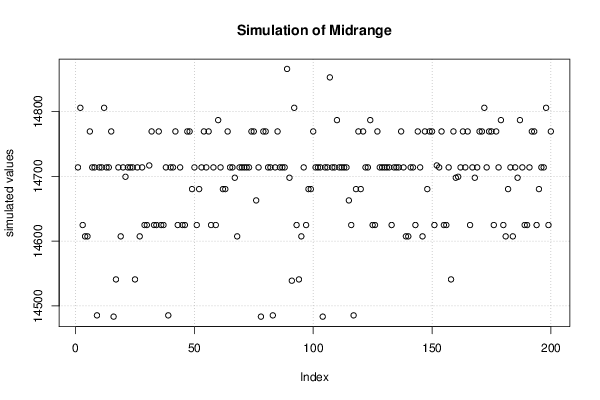
midrange140001500015000150001500015000150007390
mode300036004800620011000240002600057006100
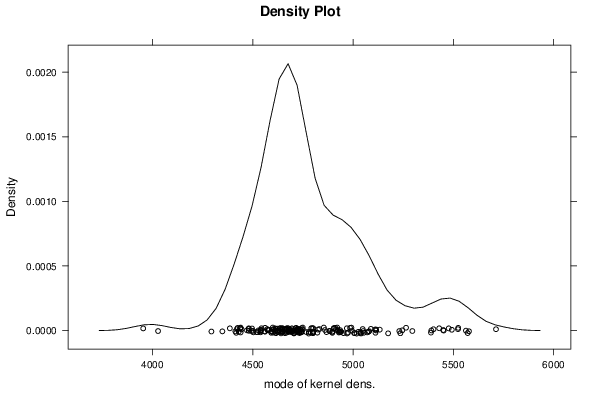
mode k.dens4300440046004700490054005600290320

\begin{tabular}{lllllllll}
\hline
Estimation Results of Bootstrap \tabularnewline
statistic & P1 & P5 & Q1 & Estimate & Q3 & P95 & P99 & S.D. & IQR \tabularnewline
mean & 9300 & 9500 & 9700 & 9900 & 10000 & 10000 & 11000 & 270 & 360 \tabularnewline
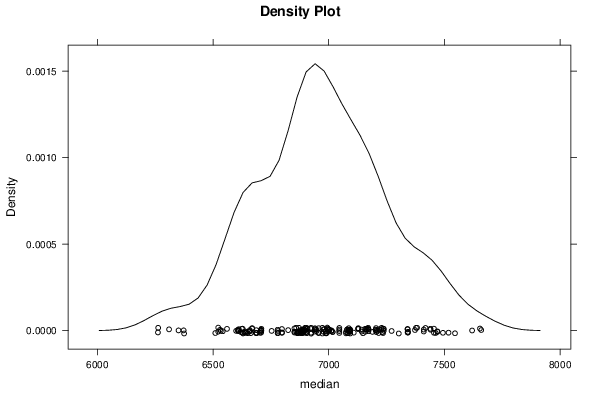
median & 6300 & 6500 & 6800 & 7000 & 7200 & 7500 & 7600 & 280 & 360 \tabularnewline
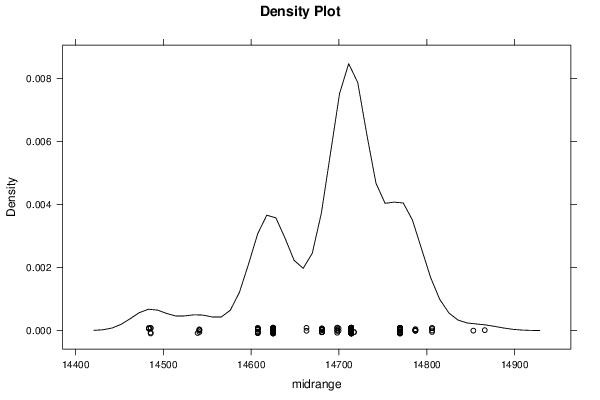
midrange & 14000 & 15000 & 15000 & 15000 & 15000 & 15000 & 15000 & 73 & 90 \tabularnewline
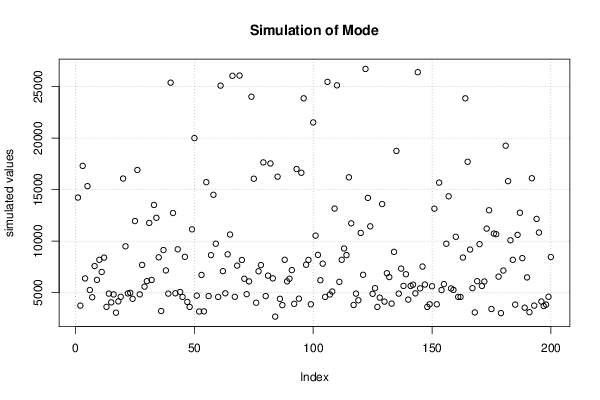
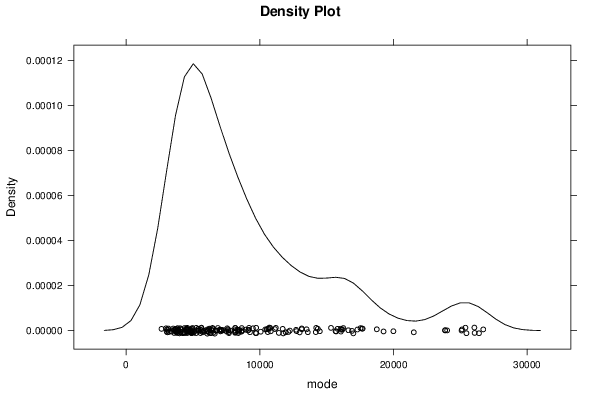
mode & 3000 & 3600 & 4800 & 6200 & 11000 & 24000 & 26000 & 5700 & 6100 \tabularnewline
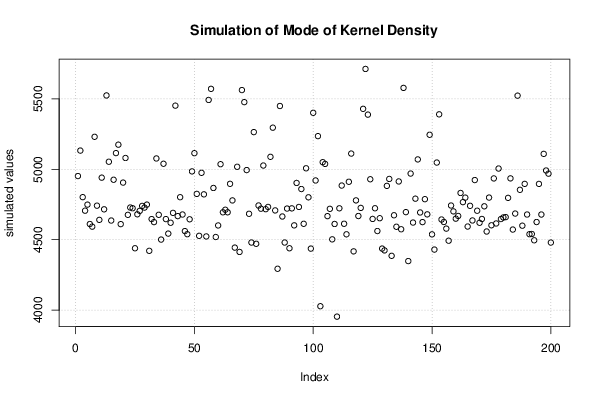
mode k.dens & 4300 & 4400 & 4600 & 4700 & 4900 & 5400 & 5600 & 290 & 320 \tabularnewline
\hline
\end{tabular}
%Source: https://freestatistics.org/blog/index.php?pk=285766&T=1

[TABLE]
[ROW][C]Estimation Results of Bootstrap[/C][/ROW]
[ROW][C]statistic[/C][C]P1[/C][C]P5[/C][C]Q1[/C][C]Estimate[/C][C]Q3[/C][C]P95[/C][C]P99[/C][C]S.D.[/C][C]IQR[/C][/ROW]
[ROW][C]mean[/C][C]9300[/C][C]9500[/C][C]9700[/C][C]9900[/C][C]10000[/C][C]10000[/C][C]11000[/C][C]270[/C][C]360[/C][/ROW]
[ROW][C]median[/C][C]6300[/C][C]6500[/C][C]6800[/C][C]7000[/C][C]7200[/C][C]7500[/C][C]7600[/C][C]280[/C][C]360[/C][/ROW]
[ROW][C]midrange[/C][C]14000[/C][C]15000[/C][C]15000[/C][C]15000[/C][C]15000[/C][C]15000[/C][C]15000[/C][C]73[/C][C]90[/C][/ROW]
[ROW][C]mode[/C][C]3000[/C][C]3600[/C][C]4800[/C][C]6200[/C][C]11000[/C][C]24000[/C][C]26000[/C][C]5700[/C][C]6100[/C][/ROW]
[ROW][C]mode k.dens[/C][C]4300[/C][C]4400[/C][C]4600[/C][C]4700[/C][C]4900[/C][C]5400[/C][C]5600[/C][C]290[/C][C]320[/C][/ROW]
[/TABLE]
Source: https://freestatistics.org/blog/index.php?pk=285766&T=1

Globally Unique Identifier (entire table): ba.freestatistics.org/blog/index.php?pk=285766&T=1

As an alternative you can also use a QR Code:  

The GUIDs for individual cells are displayed in the table below:

Estimation Results of Bootstrap
statisticP1P5Q1EstimateQ3P95P99S.D.IQR
mean9300950097009900100001000011000270360
median6300650068007000720075007600280360
midrange140001500015000150001500015000150007390
mode300036004800620011000240002600057006100
mode k.dens4300440046004700490054005600290320


Parameters (Session):
par1 = 200 ; par2 = 2 ; par3 = 0 ; par4 = P1 P5 Q1 Q3 P95 P99 ;
Parameters (R input):
par1 = 200 ; par2 = 2 ; par3 = 0 ; par4 = P1 P5 Q1 Q3 P95 P99 ;
R code (references can be found in the software module):
par4 <- 'P1 P5 Q1 Q3 P95 P99'
par3 <- '0'
par2 <- '5'
par1 <- '200'
par1 <- as.numeric(par1)
par2 <- as.numeric(par2)
if (par3 == '0') bw <- NULL
if (par3 != '0') bw <- as.numeric(par3)
if (par1 < 10) par1 = 10
if (par1 > 5000) par1 = 5000
library(modeest)
library(lattice)
library(boot)
boot.stat <- function(s,i)
{
s.mean <- mean(s[i])
s.median <- median(s[i])
s.midrange <- (max(s[i]) + min(s[i])) / 2
s.mode <- mlv(s[i], method='mfv')$M
s.kernelmode <- mlv(s[i], method='kernel', bw=bw)$M
c(s.mean, s.median, s.midrange, s.mode, s.kernelmode)
}
x<-na.omit(x)
(r <- boot(x,boot.stat, R=par1, stype='i'))
bitmap(file='plot1.png')
plot(r$t[,1],type='p',ylab='simulated values',main='Simulation of Mean')
grid()
dev.off()
bitmap(file='plot2.png')
plot(r$t[,2],type='p',ylab='simulated values',main='Simulation of Median')
grid()
dev.off()
bitmap(file='plot3.png')
plot(r$t[,3],type='p',ylab='simulated values',main='Simulation of Midrange')
grid()
dev.off()
bitmap(file='plot7.png')
plot(r$t[,4],type='p',ylab='simulated values',main='Simulation of Mode')
grid()
dev.off()
bitmap(file='plot8.png')
plot(r$t[,5],type='p',ylab='simulated values',main='Simulation of Mode of Kernel Density')
grid()
dev.off()
bitmap(file='plot4.png')
densityplot(~r$t[,1],col='black',main='Density Plot',xlab='mean')
dev.off()
bitmap(file='plot5.png')
densityplot(~r$t[,2],col='black',main='Density Plot',xlab='median')
dev.off()
bitmap(file='plot6.png')
densityplot(~r$t[,3],col='black',main='Density Plot',xlab='midrange')
dev.off()
bitmap(file='plot9.png')
densityplot(~r$t[,4],col='black',main='Density Plot',xlab='mode')
dev.off()
bitmap(file='plot10.png')
densityplot(~r$t[,5],col='black',main='Density Plot',xlab='mode of kernel dens.')
dev.off()
z <- data.frame(cbind(r$t[,1],r$t[,2],r$t[,3],r$t[,4],r$t[,5]))
colnames(z) <- list('mean','median','midrange','mode','mode k.dens')
bitmap(file='plot11.png')
boxplot(z,notch=TRUE,ylab='simulated values',main='Bootstrap Simulation - Central Tendency')
grid()
dev.off()
load(file='createtable')
a<-table.start()
a<-table.row.start(a)
a<-table.element(a,'Estimation Results of Bootstrap',10,TRUE)
a<-table.row.end(a)
if (par4 == 'P1 P5 Q1 Q3 P95 P99') {
myq.1 <- 0.01
myq.2 <- 0.05
myq.3 <- 0.95
myq.4 <- 0.99
myl.1 <- 'P1'
myl.2 <- 'P5'
myl.3 <- 'P95'
myl.4 <- 'P99'
}
if (par4 == 'P0.5 P2.5 Q1 Q3 P97.5 P99.5') {
myq.1 <- 0.005
myq.2 <- 0.025
myq.3 <- 0.975
myq.4 <- 0.995
myl.1 <- 'P0.5'
myl.2 <- 'P2.5'
myl.3 <- 'P97.5'
myl.4 <- 'P99.5'
}
if (par4 == 'P10 P20 Q1 Q3 P80 P90') {
myq.1 <- 0.10
myq.2 <- 0.20
myq.3 <- 0.80
myq.4 <- 0.90
myl.1 <- 'P10'
myl.2 <- 'P20'
myl.3 <- 'P80'
myl.4 <- 'P90'
}
a<-table.row.start(a)
a<-table.element(a,'statistic',header=TRUE)
a<-table.element(a,myl.1,header=TRUE)
a<-table.element(a,myl.2,header=TRUE)
a<-table.element(a,'Q1',header=TRUE)
a<-table.element(a,'Estimate',header=TRUE)
a<-table.element(a,'Q3',header=TRUE)
a<-table.element(a,myl.3,header=TRUE)
a<-table.element(a,myl.4,header=TRUE)
a<-table.element(a,'S.D.',header=TRUE)
a<-table.element(a,'IQR',header=TRUE)
a<-table.row.end(a)
a<-table.row.start(a)
a<-table.element(a,'mean',header=TRUE)
q1 <- quantile(r$t[,1],0.25)[[1]]
q3 <- quantile(r$t[,1],0.75)[[1]]
p01 <- quantile(r$t[,1],myq.1)[[1]]
p05 <- quantile(r$t[,1],myq.2)[[1]]
p95 <- quantile(r$t[,1],myq.3)[[1]]
p99 <- quantile(r$t[,1],myq.4)[[1]]
a<-table.element(a,signif(p01,par2))
a<-table.element(a,signif(p05,par2))
a<-table.element(a,signif(q1,par2))
a<-table.element(a,signif(r$t0[1],par2))
a<-table.element(a,signif(q3,par2))
a<-table.element(a,signif(p95,par2))
a<-table.element(a,signif(p99,par2))
a<-table.element( a,signif( sqrt(var(r$t[,1])),par2 ) )
a<-table.element(a,signif(q3-q1,par2))
a<-table.row.end(a)
a<-table.row.start(a)
a<-table.element(a,'median',header=TRUE)
q1 <- quantile(r$t[,2],0.25)[[1]]
q3 <- quantile(r$t[,2],0.75)[[1]]
p01 <- quantile(r$t[,2],myq.1)[[1]]
p05 <- quantile(r$t[,2],myq.2)[[1]]
p95 <- quantile(r$t[,2],myq.3)[[1]]
p99 <- quantile(r$t[,2],myq.4)[[1]]
a<-table.element(a,signif(p01,par2))
a<-table.element(a,signif(p05,par2))
a<-table.element(a,signif(q1,par2))
a<-table.element(a,signif(r$t0[2],par2))
a<-table.element(a,signif(q3,par2))
a<-table.element(a,signif(p95,par2))
a<-table.element(a,signif(p99,par2))
a<-table.element(a,signif(sqrt(var(r$t[,2])),par2))
a<-table.element(a,signif(q3-q1,par2))
a<-table.row.end(a)
a<-table.row.start(a)
a<-table.element(a,'midrange',header=TRUE)
q1 <- quantile(r$t[,3],0.25)[[1]]
q3 <- quantile(r$t[,3],0.75)[[1]]
p01 <- quantile(r$t[,3],myq.1)[[1]]
p05 <- quantile(r$t[,3],myq.2)[[1]]
p95 <- quantile(r$t[,3],myq.3)[[1]]
p99 <- quantile(r$t[,3],myq.4)[[1]]
a<-table.element(a,signif(p01,par2))
a<-table.element(a,signif(p05,par2))
a<-table.element(a,signif(q1,par2))
a<-table.element(a,signif(r$t0[3],par2))
a<-table.element(a,signif(q3,par2))
a<-table.element(a,signif(p95,par2))
a<-table.element(a,signif(p99,par2))
a<-table.element(a,signif(sqrt(var(r$t[,3])),par2))
a<-table.element(a,signif(q3-q1,par2))
a<-table.row.end(a)
a<-table.row.start(a)
a<-table.element(a,'mode',header=TRUE)
q1 <- quantile(r$t[,4],0.25)[[1]]
q3 <- quantile(r$t[,4],0.75)[[1]]
p01 <- quantile(r$t[,4],myq.1)[[1]]
p05 <- quantile(r$t[,4],myq.2)[[1]]
p95 <- quantile(r$t[,4],myq.3)[[1]]
p99 <- quantile(r$t[,4],myq.4)[[1]]
a<-table.element(a,signif(p01,par2))
a<-table.element(a,signif(p05,par2))
a<-table.element(a,signif(q1,par2))
a<-table.element(a,signif(r$t0[4],par2))
a<-table.element(a,signif(q3,par2))
a<-table.element(a,signif(p95,par2))
a<-table.element(a,signif(p99,par2))
a<-table.element(a,signif(sqrt(var(r$t[,4])),par2))
a<-table.element(a,signif(q3-q1,par2))
a<-table.row.end(a)
a<-table.row.start(a)
a<-table.element(a,'mode k.dens',header=TRUE)
q1 <- quantile(r$t[,5],0.25)[[1]]
q3 <- quantile(r$t[,5],0.75)[[1]]
p01 <- quantile(r$t[,5],myq.1)[[1]]
p05 <- quantile(r$t[,5],myq.2)[[1]]
p95 <- quantile(r$t[,5],myq.3)[[1]]
p99 <- quantile(r$t[,5],myq.4)[[1]]
a<-table.element(a,signif(p01,par2))
a<-table.element(a,signif(p05,par2))
a<-table.element(a,signif(q1,par2))
a<-table.element(a,signif(r$t0[5],par2))
a<-table.element(a,signif(q3,par2))
a<-table.element(a,signif(p95,par2))
a<-table.element(a,signif(p99,par2))
a<-table.element(a,signif(sqrt(var(r$t[,5])),par2))
a<-table.element(a,signif(q3-q1,par2))
a<-table.row.end(a)
a<-table.end(a)
table.save(a,file='mytable.tab')