Free Statistics

of Irreproducible Research!

Author's title

Author*The author of this computation has been verified*
R Software Modulerwasp_exponentialsmoothing.wasp
Title produced by softwareExponential Smoothing
Date of computationThu, 10 Dec 2015 18:02:12 +0000
Cite this page as followsStatistical Computations at FreeStatistics.org, Office for Research Development and Education, URL https://freestatistics.org/blog/index.php?v=date/2015/Dec/10/t144977056664gmhkp3ydo131a.htm/, Retrieved Thu, 16 May 2024 17:39:44 +0000
Statistical Computations at FreeStatistics.org, Office for Research Development and Education, URL https://freestatistics.org/blog/index.php?pk=285830, Retrieved Thu, 16 May 2024 17:39:44 +0000
QR Codes:

Original text written by user:
IsPrivate?No (this computation is public)
User-defined keywords
Estimated Impact100
Family? (F = Feedback message, R = changed R code, M = changed R Module, P = changed Parameters, D = changed Data)
-       [Exponential Smoothing] [Triple exponentia...] [2015-12-10 18:02:12] [6044190b28416569d1ec4c3a0214957f] [Current]
Feedback Forum

Post a new message
Dataseries X:
189
229
249
289
260
431
660
777
915
613
485
277
244
296
319
370
313
556
831
960
1152
759
607
371
298
378
373
443
374
660
1004
1153
1388
904
715
411


Summary of computational transaction
Raw Inputview raw input (R code)
Raw Outputview raw output of R engine
Computing time1 seconds
R Server'George Udny Yule' @ yule.wessa.net

\begin{tabular}{lllllllll}
\hline
Summary of computational transaction \tabularnewline
Raw Input & view raw input (R code)  \tabularnewline
Raw Output & view raw output of R engine  \tabularnewline
Computing time & 1 seconds \tabularnewline
R Server & 'George Udny Yule' @ yule.wessa.net \tabularnewline
\hline
\end{tabular}
%Source: https://freestatistics.org/blog/index.php?pk=285830&T=0

[TABLE]
[ROW][C]Summary of computational transaction[/C][/ROW]
[ROW][C]Raw Input[/C][C]view raw input (R code) [/C][/ROW]
[ROW][C]Raw Output[/C][C]view raw output of R engine [/C][/ROW]
[ROW][C]Computing time[/C][C]1 seconds[/C][/ROW]
[ROW][C]R Server[/C][C]'George Udny Yule' @ yule.wessa.net[/C][/ROW]
[/TABLE]
Source: https://freestatistics.org/blog/index.php?pk=285830&T=0

Globally Unique Identifier (entire table): ba.freestatistics.org/blog/index.php?pk=285830&T=0

As an alternative you can also use a QR Code:  

The GUIDs for individual cells are displayed in the table below:

Summary of computational transaction
Raw Inputview raw input (R code)
Raw Outputview raw output of R engine
Computing time1 seconds
R Server'George Udny Yule' @ yule.wessa.net


Estimated Parameters of Exponential Smoothing
ParameterValue
alpha0.578148810227421
beta0
gamma0.393228153941402

\begin{tabular}{lllllllll}
\hline
Estimated Parameters of Exponential Smoothing \tabularnewline
Parameter & Value \tabularnewline
alpha & 0.578148810227421 \tabularnewline
beta & 0 \tabularnewline
gamma & 0.393228153941402 \tabularnewline
\hline
\end{tabular}
%Source: https://freestatistics.org/blog/index.php?pk=285830&T=1

[TABLE]
[ROW][C]Estimated Parameters of Exponential Smoothing[/C][/ROW]
[ROW][C]Parameter[/C][C]Value[/C][/ROW]
[ROW][C]alpha[/C][C]0.578148810227421[/C][/ROW]
[ROW][C]beta[/C][C]0[/C][/ROW]
[ROW][C]gamma[/C][C]0.393228153941402[/C][/ROW]
[/TABLE]
Source: https://freestatistics.org/blog/index.php?pk=285830&T=1

Globally Unique Identifier (entire table): ba.freestatistics.org/blog/index.php?pk=285830&T=1

As an alternative you can also use a QR Code:  

The GUIDs for individual cells are displayed in the table below:

Estimated Parameters of Exponential Smoothing
ParameterValue
alpha0.578148810227421
beta0
gamma0.393228153941402


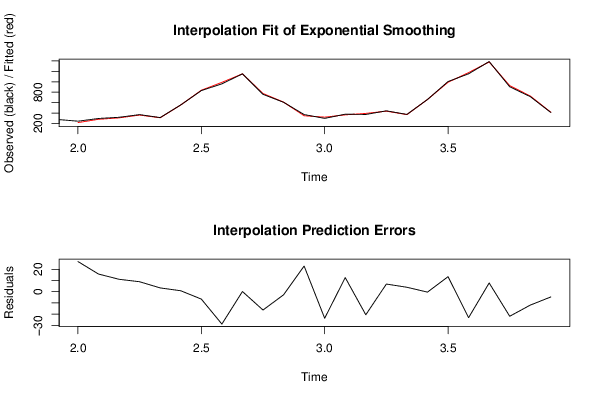
Interpolation Forecasts of Exponential Smoothing
tObservedFittedResiduals
13244217.1208255600226.8791744399797
14296280.26265504144215.7373449585578
15319307.93104347220411.0689565277964
16370361.1240606661298.87593933387132
17313309.613818893753.38618110624981
18556555.1566826905770.843317309423014
19831837.565212825668-6.56521282566837
20960988.822274081581-28.8222740815809
2111521151.819751714250.180248285748803
22759775.330653347399-16.3306533473992
23607609.751976632537-2.75197663253687
24371348.13050076600622.869499233994
25298321.666372093448-23.6663720934484
26378365.42696390121812.5730360987821
27373393.560508063333-20.5605080633331
28443436.179642782846.82035721716011
29374370.0424791823413.95752081765937
30660660.349695793119-0.349695793119395
311004990.60770452266813.3922954773317
3211531176.12239591455-23.1223959145523
3313881380.205925751987.7940742480223
34904925.87553467096-21.8755346709597
35715726.937052285517-11.9370522855172
36411415.661782775076-4.66178277507629

\begin{tabular}{lllllllll}
\hline
Interpolation Forecasts of Exponential Smoothing \tabularnewline
t & Observed & Fitted & Residuals \tabularnewline
13 & 244 & 217.12082556002 & 26.8791744399797 \tabularnewline
14 & 296 & 280.262655041442 & 15.7373449585578 \tabularnewline
15 & 319 & 307.931043472204 & 11.0689565277964 \tabularnewline
16 & 370 & 361.124060666129 & 8.87593933387132 \tabularnewline
17 & 313 & 309.61381889375 & 3.38618110624981 \tabularnewline
18 & 556 & 555.156682690577 & 0.843317309423014 \tabularnewline
19 & 831 & 837.565212825668 & -6.56521282566837 \tabularnewline
20 & 960 & 988.822274081581 & -28.8222740815809 \tabularnewline
21 & 1152 & 1151.81975171425 & 0.180248285748803 \tabularnewline
22 & 759 & 775.330653347399 & -16.3306533473992 \tabularnewline
23 & 607 & 609.751976632537 & -2.75197663253687 \tabularnewline
24 & 371 & 348.130500766006 & 22.869499233994 \tabularnewline
25 & 298 & 321.666372093448 & -23.6663720934484 \tabularnewline
26 & 378 & 365.426963901218 & 12.5730360987821 \tabularnewline
27 & 373 & 393.560508063333 & -20.5605080633331 \tabularnewline
28 & 443 & 436.17964278284 & 6.82035721716011 \tabularnewline
29 & 374 & 370.042479182341 & 3.95752081765937 \tabularnewline
30 & 660 & 660.349695793119 & -0.349695793119395 \tabularnewline
31 & 1004 & 990.607704522668 & 13.3922954773317 \tabularnewline
32 & 1153 & 1176.12239591455 & -23.1223959145523 \tabularnewline
33 & 1388 & 1380.20592575198 & 7.7940742480223 \tabularnewline
34 & 904 & 925.87553467096 & -21.8755346709597 \tabularnewline
35 & 715 & 726.937052285517 & -11.9370522855172 \tabularnewline
36 & 411 & 415.661782775076 & -4.66178277507629 \tabularnewline
\hline
\end{tabular}
%Source: https://freestatistics.org/blog/index.php?pk=285830&T=2

[TABLE]
[ROW][C]Interpolation Forecasts of Exponential Smoothing[/C][/ROW]
[ROW][C]t[/C][C]Observed[/C][C]Fitted[/C][C]Residuals[/C][/ROW]
[ROW][C]13[/C][C]244[/C][C]217.12082556002[/C][C]26.8791744399797[/C][/ROW]
[ROW][C]14[/C][C]296[/C][C]280.262655041442[/C][C]15.7373449585578[/C][/ROW]
[ROW][C]15[/C][C]319[/C][C]307.931043472204[/C][C]11.0689565277964[/C][/ROW]
[ROW][C]16[/C][C]370[/C][C]361.124060666129[/C][C]8.87593933387132[/C][/ROW]
[ROW][C]17[/C][C]313[/C][C]309.61381889375[/C][C]3.38618110624981[/C][/ROW]
[ROW][C]18[/C][C]556[/C][C]555.156682690577[/C][C]0.843317309423014[/C][/ROW]
[ROW][C]19[/C][C]831[/C][C]837.565212825668[/C][C]-6.56521282566837[/C][/ROW]
[ROW][C]20[/C][C]960[/C][C]988.822274081581[/C][C]-28.8222740815809[/C][/ROW]
[ROW][C]21[/C][C]1152[/C][C]1151.81975171425[/C][C]0.180248285748803[/C][/ROW]
[ROW][C]22[/C][C]759[/C][C]775.330653347399[/C][C]-16.3306533473992[/C][/ROW]
[ROW][C]23[/C][C]607[/C][C]609.751976632537[/C][C]-2.75197663253687[/C][/ROW]
[ROW][C]24[/C][C]371[/C][C]348.130500766006[/C][C]22.869499233994[/C][/ROW]
[ROW][C]25[/C][C]298[/C][C]321.666372093448[/C][C]-23.6663720934484[/C][/ROW]
[ROW][C]26[/C][C]378[/C][C]365.426963901218[/C][C]12.5730360987821[/C][/ROW]
[ROW][C]27[/C][C]373[/C][C]393.560508063333[/C][C]-20.5605080633331[/C][/ROW]
[ROW][C]28[/C][C]443[/C][C]436.17964278284[/C][C]6.82035721716011[/C][/ROW]
[ROW][C]29[/C][C]374[/C][C]370.042479182341[/C][C]3.95752081765937[/C][/ROW]
[ROW][C]30[/C][C]660[/C][C]660.349695793119[/C][C]-0.349695793119395[/C][/ROW]
[ROW][C]31[/C][C]1004[/C][C]990.607704522668[/C][C]13.3922954773317[/C][/ROW]
[ROW][C]32[/C][C]1153[/C][C]1176.12239591455[/C][C]-23.1223959145523[/C][/ROW]
[ROW][C]33[/C][C]1388[/C][C]1380.20592575198[/C][C]7.7940742480223[/C][/ROW]
[ROW][C]34[/C][C]904[/C][C]925.87553467096[/C][C]-21.8755346709597[/C][/ROW]
[ROW][C]35[/C][C]715[/C][C]726.937052285517[/C][C]-11.9370522855172[/C][/ROW]
[ROW][C]36[/C][C]411[/C][C]415.661782775076[/C][C]-4.66178277507629[/C][/ROW]
[/TABLE]
Source: https://freestatistics.org/blog/index.php?pk=285830&T=2

Globally Unique Identifier (entire table): ba.freestatistics.org/blog/index.php?pk=285830&T=2

As an alternative you can also use a QR Code:  

The GUIDs for individual cells are displayed in the table below:

Interpolation Forecasts of Exponential Smoothing
tObservedFittedResiduals
13244217.1208255600226.8791744399797
14296280.26265504144215.7373449585578
15319307.93104347220411.0689565277964
16370361.1240606661298.87593933387132
17313309.613818893753.38618110624981
18556555.1566826905770.843317309423014
19831837.565212825668-6.56521282566837
20960988.822274081581-28.8222740815809
2111521151.819751714250.180248285748803
22759775.330653347399-16.3306533473992
23607609.751976632537-2.75197663253687
24371348.13050076600622.869499233994
25298321.666372093448-23.6663720934484
26378365.42696390121812.5730360987821
27373393.560508063333-20.5605080633331
28443436.179642782846.82035721716011
29374370.0424791823413.95752081765937
30660660.349695793119-0.349695793119395
311004990.60770452266813.3922954773317
3211531176.12239591455-23.1223959145523
3313881380.205925751987.7940742480223
34904925.87553467096-21.8755346709597
35715726.937052285517-11.9370522855172
36411415.661782775076-4.66178277507629


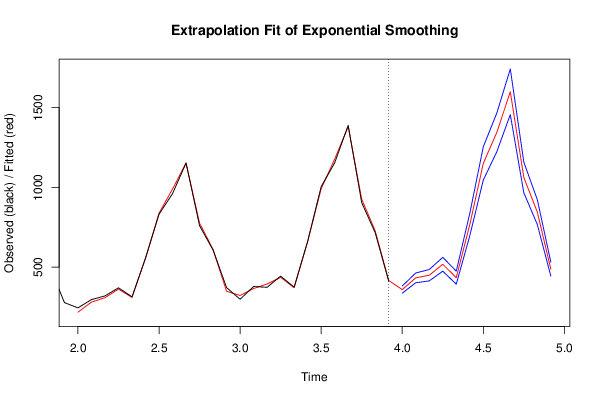
Extrapolation Forecasts of Exponential Smoothing
tForecast95% Lower Bound95% Upper Bound
37358.458929019906336.017789576453380.90006846336
38432.088877872114401.550218588967462.627537155261
39448.696026184173413.03780665442484.354245713926
40517.358949041022473.901129603397560.816768478647
41433.582861667795392.877349403752474.288373931837
42765.845110235633695.66082176831836.029398702955
431149.36607037141045.150725617041253.58141512577
441343.880003583861222.678918663941465.08108850377
451598.595600832481455.532599822311741.65860184264
461061.51561316678965.5578368209031157.47338951266
47844.191638087268766.379416821325922.003859353211
48486.673014431103443.105311711784530.240717150422

\begin{tabular}{lllllllll}
\hline
Extrapolation Forecasts of Exponential Smoothing \tabularnewline
t & Forecast & 95% Lower Bound & 95% Upper Bound \tabularnewline
37 & 358.458929019906 & 336.017789576453 & 380.90006846336 \tabularnewline
38 & 432.088877872114 & 401.550218588967 & 462.627537155261 \tabularnewline
39 & 448.696026184173 & 413.03780665442 & 484.354245713926 \tabularnewline
40 & 517.358949041022 & 473.901129603397 & 560.816768478647 \tabularnewline
41 & 433.582861667795 & 392.877349403752 & 474.288373931837 \tabularnewline
42 & 765.845110235633 & 695.66082176831 & 836.029398702955 \tabularnewline
43 & 1149.3660703714 & 1045.15072561704 & 1253.58141512577 \tabularnewline
44 & 1343.88000358386 & 1222.67891866394 & 1465.08108850377 \tabularnewline
45 & 1598.59560083248 & 1455.53259982231 & 1741.65860184264 \tabularnewline
46 & 1061.51561316678 & 965.557836820903 & 1157.47338951266 \tabularnewline
47 & 844.191638087268 & 766.379416821325 & 922.003859353211 \tabularnewline
48 & 486.673014431103 & 443.105311711784 & 530.240717150422 \tabularnewline
\hline
\end{tabular}
%Source: https://freestatistics.org/blog/index.php?pk=285830&T=3

[TABLE]
[ROW][C]Extrapolation Forecasts of Exponential Smoothing[/C][/ROW]
[ROW][C]t[/C][C]Forecast[/C][C]95% Lower Bound[/C][C]95% Upper Bound[/C][/ROW]
[ROW][C]37[/C][C]358.458929019906[/C][C]336.017789576453[/C][C]380.90006846336[/C][/ROW]
[ROW][C]38[/C][C]432.088877872114[/C][C]401.550218588967[/C][C]462.627537155261[/C][/ROW]
[ROW][C]39[/C][C]448.696026184173[/C][C]413.03780665442[/C][C]484.354245713926[/C][/ROW]
[ROW][C]40[/C][C]517.358949041022[/C][C]473.901129603397[/C][C]560.816768478647[/C][/ROW]
[ROW][C]41[/C][C]433.582861667795[/C][C]392.877349403752[/C][C]474.288373931837[/C][/ROW]
[ROW][C]42[/C][C]765.845110235633[/C][C]695.66082176831[/C][C]836.029398702955[/C][/ROW]
[ROW][C]43[/C][C]1149.3660703714[/C][C]1045.15072561704[/C][C]1253.58141512577[/C][/ROW]
[ROW][C]44[/C][C]1343.88000358386[/C][C]1222.67891866394[/C][C]1465.08108850377[/C][/ROW]
[ROW][C]45[/C][C]1598.59560083248[/C][C]1455.53259982231[/C][C]1741.65860184264[/C][/ROW]
[ROW][C]46[/C][C]1061.51561316678[/C][C]965.557836820903[/C][C]1157.47338951266[/C][/ROW]
[ROW][C]47[/C][C]844.191638087268[/C][C]766.379416821325[/C][C]922.003859353211[/C][/ROW]
[ROW][C]48[/C][C]486.673014431103[/C][C]443.105311711784[/C][C]530.240717150422[/C][/ROW]
[/TABLE]
Source: https://freestatistics.org/blog/index.php?pk=285830&T=3

Globally Unique Identifier (entire table): ba.freestatistics.org/blog/index.php?pk=285830&T=3

As an alternative you can also use a QR Code:  

The GUIDs for individual cells are displayed in the table below:

Extrapolation Forecasts of Exponential Smoothing
tForecast95% Lower Bound95% Upper Bound
37358.458929019906336.017789576453380.90006846336
38432.088877872114401.550218588967462.627537155261
39448.696026184173413.03780665442484.354245713926
40517.358949041022473.901129603397560.816768478647
41433.582861667795392.877349403752474.288373931837
42765.845110235633695.66082176831836.029398702955
431149.36607037141045.150725617041253.58141512577
441343.880003583861222.678918663941465.08108850377
451598.595600832481455.532599822311741.65860184264
461061.51561316678965.5578368209031157.47338951266
47844.191638087268766.379416821325922.003859353211
48486.673014431103443.105311711784530.240717150422


Parameters (Session):
par1 = 12 ; par2 = Triple ; par3 = multiplicative ;
Parameters (R input):
par1 = 12 ; par2 = Triple ; par3 = multiplicative ;
R code (references can be found in the software module):
par1 <- as.numeric(par1)
if (par2 == 'Single') K <- 1
if (par2 == 'Double') K <- 2
if (par2 == 'Triple') K <- par1
nx <- length(x)
nxmK <- nx - K
x <- ts(x, frequency = par1)
if (par2 == 'Single') fit <- HoltWinters(x, gamma=F, beta=F)
if (par2 == 'Double') fit <- HoltWinters(x, gamma=F)
if (par2 == 'Triple') fit <- HoltWinters(x, seasonal=par3)
fit
myresid <- x - fit$fitted[,'xhat']
bitmap(file='test1.png')
op <- par(mfrow=c(2,1))
plot(fit,ylab='Observed (black) / Fitted (red)',main='Interpolation Fit of Exponential Smoothing')
plot(myresid,ylab='Residuals',main='Interpolation Prediction Errors')
par(op)
dev.off()
bitmap(file='test2.png')
p <- predict(fit, par1, prediction.interval=TRUE)
np <- length(p[,1])
plot(fit,p,ylab='Observed (black) / Fitted (red)',main='Extrapolation Fit of Exponential Smoothing')
dev.off()
bitmap(file='test3.png')
op <- par(mfrow = c(2,2))
acf(as.numeric(myresid),lag.max = nx/2,main='Residual ACF')
spectrum(myresid,main='Residals Periodogram')
cpgram(myresid,main='Residal Cumulative Periodogram')
qqnorm(myresid,main='Residual Normal QQ Plot')
qqline(myresid)
par(op)
dev.off()
load(file='createtable')
a<-table.start()
a<-table.row.start(a)
a<-table.element(a,'Estimated Parameters of Exponential Smoothing',2,TRUE)
a<-table.row.end(a)
a<-table.row.start(a)
a<-table.element(a,'Parameter',header=TRUE)
a<-table.element(a,'Value',header=TRUE)
a<-table.row.end(a)
a<-table.row.start(a)
a<-table.element(a,'alpha',header=TRUE)
a<-table.element(a,fit$alpha)
a<-table.row.end(a)
a<-table.row.start(a)
a<-table.element(a,'beta',header=TRUE)
a<-table.element(a,fit$beta)
a<-table.row.end(a)
a<-table.row.start(a)
a<-table.element(a,'gamma',header=TRUE)
a<-table.element(a,fit$gamma)
a<-table.row.end(a)
a<-table.end(a)
table.save(a,file='mytable.tab')
a<-table.start()
a<-table.row.start(a)
a<-table.element(a,'Interpolation Forecasts of Exponential Smoothing',4,TRUE)
a<-table.row.end(a)
a<-table.row.start(a)
a<-table.element(a,'t',header=TRUE)
a<-table.element(a,'Observed',header=TRUE)
a<-table.element(a,'Fitted',header=TRUE)
a<-table.element(a,'Residuals',header=TRUE)
a<-table.row.end(a)
for (i in 1:nxmK) {
a<-table.row.start(a)
a<-table.element(a,i+K,header=TRUE)
a<-table.element(a,x[i+K])
a<-table.element(a,fit$fitted[i,'xhat'])
a<-table.element(a,myresid[i])
a<-table.row.end(a)
}
a<-table.end(a)
table.save(a,file='mytable1.tab')
a<-table.start()
a<-table.row.start(a)
a<-table.element(a,'Extrapolation Forecasts of Exponential Smoothing',4,TRUE)
a<-table.row.end(a)
a<-table.row.start(a)
a<-table.element(a,'t',header=TRUE)
a<-table.element(a,'Forecast',header=TRUE)
a<-table.element(a,'95% Lower Bound',header=TRUE)
a<-table.element(a,'95% Upper Bound',header=TRUE)
a<-table.row.end(a)
for (i in 1:np) {
a<-table.row.start(a)
a<-table.element(a,nx+i,header=TRUE)
a<-table.element(a,p[i,'fit'])
a<-table.element(a,p[i,'lwr'])
a<-table.element(a,p[i,'upr'])
a<-table.row.end(a)
}
a<-table.end(a)
table.save(a,file='mytable2.tab')