Free Statistics

of Irreproducible Research!

Author's title

Author*The author of this computation has been verified*
R Software Modulerwasp_arimaforecasting.wasp
Title produced by softwareARIMA Forecasting
Date of computationThu, 10 Dec 2015 21:16:12 +0000
Cite this page as followsStatistical Computations at FreeStatistics.org, Office for Research Development and Education, URL https://freestatistics.org/blog/index.php?v=date/2015/Dec/10/t1449782444mwai9layacbw3eu.htm/, Retrieved Thu, 16 May 2024 04:24:54 +0000
Statistical Computations at FreeStatistics.org, Office for Research Development and Education, URL https://freestatistics.org/blog/index.php?pk=285847, Retrieved Thu, 16 May 2024 04:24:54 +0000
QR Codes:

Original text written by user:
IsPrivate?No (this computation is public)
User-defined keywords
Estimated Impact80
Family? (F = Feedback message, R = changed R code, M = changed R Module, P = changed Parameters, D = changed Data)
-       [ARIMA Forecasting] [Tasty Cola ARIMA ...] [2015-12-10 21:16:12] [6302022346f8281867db1e7896f8a37d] [Current]
Feedback Forum

Post a new message
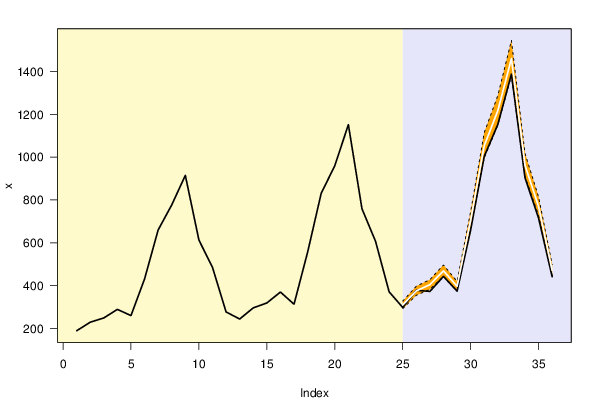
Dataseries X:
189
229
249
289
260
431
660
777
915
613
485
277
244
296
319
370
313
556
831
960
1152
759
607
371
298
378
373
443
374
660
1004
1153
1388
904
715
441


Summary of computational transaction
Raw Inputview raw input (R code)
Raw Outputview raw output of R engine
Computing time1 seconds
R Server'George Udny Yule' @ yule.wessa.net

\begin{tabular}{lllllllll}
\hline
Summary of computational transaction \tabularnewline
Raw Input & view raw input (R code)  \tabularnewline
Raw Output & view raw output of R engine  \tabularnewline
Computing time & 1 seconds \tabularnewline
R Server & 'George Udny Yule' @ yule.wessa.net \tabularnewline
\hline
\end{tabular}
%Source: https://freestatistics.org/blog/index.php?pk=285847&T=0

[TABLE]
[ROW][C]Summary of computational transaction[/C][/ROW]
[ROW][C]Raw Input[/C][C]view raw input (R code) [/C][/ROW]
[ROW][C]Raw Output[/C][C]view raw output of R engine [/C][/ROW]
[ROW][C]Computing time[/C][C]1 seconds[/C][/ROW]
[ROW][C]R Server[/C][C]'George Udny Yule' @ yule.wessa.net[/C][/ROW]
[/TABLE]
Source: https://freestatistics.org/blog/index.php?pk=285847&T=0

Globally Unique Identifier (entire table): ba.freestatistics.org/blog/index.php?pk=285847&T=0

As an alternative you can also use a QR Code:  

The GUIDs for individual cells are displayed in the table below:

Summary of computational transaction
Raw Inputview raw input (R code)
Raw Outputview raw output of R engine
Computing time1 seconds
R Server'George Udny Yule' @ yule.wessa.net


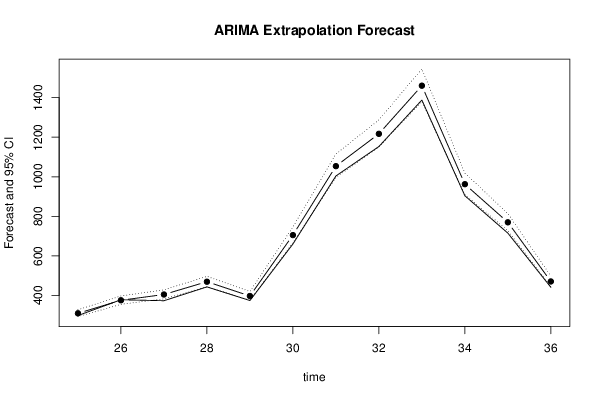
Univariate ARIMA Extrapolation Forecast
timeY[t]F[t]95% LB95% UBp-value(H0: Y[t] = F[t])P(F[t]>Y[t-1])P(F[t]>Y[t-s])P(F[t]>Y[24])
12277-------
13244-------
14296-------
15319-------
16370-------
17313-------
18556-------
19831-------
20960-------
211152-------
22759-------
23607-------
24371-------
25298309.3987292.4457327.33440.1064010
26378375.3361354.7702397.09420.4052110.652
27373404.5007382.3368427.94950.00420.986610.9974
28443469.1701443.4627496.36780.0297111
29374396.8926375.1455419.90030.0256010.9863
30660705.0232666.3926745.89320.0154111
3110041053.7307995.99331114.81520.0553111
3211531217.30631150.60591287.87320.037111
3313881460.76751380.72711545.44780.0461111
34904962.4328909.69781018.22470.02011
35715769.6926727.5185814.31150.0081011
36441470.4381444.6613497.70930.0172011

\begin{tabular}{lllllllll}
\hline
Univariate ARIMA Extrapolation Forecast \tabularnewline
time & Y[t] & F[t] & 95% LB & 95% UB & p-value(H0: Y[t] = F[t]) & P(F[t]>Y[t-1]) & P(F[t]>Y[t-s]) & P(F[t]>Y[24]) \tabularnewline
12 & 277 & - & - & - & - & - & - & - \tabularnewline
13 & 244 & - & - & - & - & - & - & - \tabularnewline
14 & 296 & - & - & - & - & - & - & - \tabularnewline
15 & 319 & - & - & - & - & - & - & - \tabularnewline
16 & 370 & - & - & - & - & - & - & - \tabularnewline
17 & 313 & - & - & - & - & - & - & - \tabularnewline
18 & 556 & - & - & - & - & - & - & - \tabularnewline
19 & 831 & - & - & - & - & - & - & - \tabularnewline
20 & 960 & - & - & - & - & - & - & - \tabularnewline
21 & 1152 & - & - & - & - & - & - & - \tabularnewline
22 & 759 & - & - & - & - & - & - & - \tabularnewline
23 & 607 & - & - & - & - & - & - & - \tabularnewline
24 & 371 & - & - & - & - & - & - & - \tabularnewline
25 & 298 & 309.3987 & 292.4457 & 327.3344 & 0.1064 & 0 & 1 & 0 \tabularnewline
26 & 378 & 375.3361 & 354.7702 & 397.0942 & 0.4052 & 1 & 1 & 0.652 \tabularnewline
27 & 373 & 404.5007 & 382.3368 & 427.9495 & 0.0042 & 0.9866 & 1 & 0.9974 \tabularnewline
28 & 443 & 469.1701 & 443.4627 & 496.3678 & 0.0297 & 1 & 1 & 1 \tabularnewline
29 & 374 & 396.8926 & 375.1455 & 419.9003 & 0.0256 & 0 & 1 & 0.9863 \tabularnewline
30 & 660 & 705.0232 & 666.3926 & 745.8932 & 0.0154 & 1 & 1 & 1 \tabularnewline
31 & 1004 & 1053.7307 & 995.9933 & 1114.8152 & 0.0553 & 1 & 1 & 1 \tabularnewline
32 & 1153 & 1217.3063 & 1150.6059 & 1287.8732 & 0.037 & 1 & 1 & 1 \tabularnewline
33 & 1388 & 1460.7675 & 1380.7271 & 1545.4478 & 0.0461 & 1 & 1 & 1 \tabularnewline
34 & 904 & 962.4328 & 909.6978 & 1018.2247 & 0.02 & 0 & 1 & 1 \tabularnewline
35 & 715 & 769.6926 & 727.5185 & 814.3115 & 0.0081 & 0 & 1 & 1 \tabularnewline
36 & 441 & 470.4381 & 444.6613 & 497.7093 & 0.0172 & 0 & 1 & 1 \tabularnewline
\hline
\end{tabular}
%Source: https://freestatistics.org/blog/index.php?pk=285847&T=1

[TABLE]
[ROW][C]Univariate ARIMA Extrapolation Forecast[/C][/ROW]
[ROW][C]time[/C][C]Y[t][/C][C]F[t][/C][C]95% LB[/C][C]95% UB[/C][C]p-value(H0: Y[t] = F[t])[/C][C]P(F[t]>Y[t-1])[/C][C]P(F[t]>Y[t-s])[/C][C]P(F[t]>Y[24])[/C][/ROW]
[ROW][C]12[/C][C]277[/C][C]-[/C][C]-[/C][C]-[/C][C]-[/C][C]-[/C][C]-[/C][C]-[/C][/ROW]
[ROW][C]13[/C][C]244[/C][C]-[/C][C]-[/C][C]-[/C][C]-[/C][C]-[/C][C]-[/C][C]-[/C][/ROW]
[ROW][C]14[/C][C]296[/C][C]-[/C][C]-[/C][C]-[/C][C]-[/C][C]-[/C][C]-[/C][C]-[/C][/ROW]
[ROW][C]15[/C][C]319[/C][C]-[/C][C]-[/C][C]-[/C][C]-[/C][C]-[/C][C]-[/C][C]-[/C][/ROW]
[ROW][C]16[/C][C]370[/C][C]-[/C][C]-[/C][C]-[/C][C]-[/C][C]-[/C][C]-[/C][C]-[/C][/ROW]
[ROW][C]17[/C][C]313[/C][C]-[/C][C]-[/C][C]-[/C][C]-[/C][C]-[/C][C]-[/C][C]-[/C][/ROW]
[ROW][C]18[/C][C]556[/C][C]-[/C][C]-[/C][C]-[/C][C]-[/C][C]-[/C][C]-[/C][C]-[/C][/ROW]
[ROW][C]19[/C][C]831[/C][C]-[/C][C]-[/C][C]-[/C][C]-[/C][C]-[/C][C]-[/C][C]-[/C][/ROW]
[ROW][C]20[/C][C]960[/C][C]-[/C][C]-[/C][C]-[/C][C]-[/C][C]-[/C][C]-[/C][C]-[/C][/ROW]
[ROW][C]21[/C][C]1152[/C][C]-[/C][C]-[/C][C]-[/C][C]-[/C][C]-[/C][C]-[/C][C]-[/C][/ROW]
[ROW][C]22[/C][C]759[/C][C]-[/C][C]-[/C][C]-[/C][C]-[/C][C]-[/C][C]-[/C][C]-[/C][/ROW]
[ROW][C]23[/C][C]607[/C][C]-[/C][C]-[/C][C]-[/C][C]-[/C][C]-[/C][C]-[/C][C]-[/C][/ROW]
[ROW][C]24[/C][C]371[/C][C]-[/C][C]-[/C][C]-[/C][C]-[/C][C]-[/C][C]-[/C][C]-[/C][/ROW]
[ROW][C]25[/C][C]298[/C][C]309.3987[/C][C]292.4457[/C][C]327.3344[/C][C]0.1064[/C][C]0[/C][C]1[/C][C]0[/C][/ROW]
[ROW][C]26[/C][C]378[/C][C]375.3361[/C][C]354.7702[/C][C]397.0942[/C][C]0.4052[/C][C]1[/C][C]1[/C][C]0.652[/C][/ROW]
[ROW][C]27[/C][C]373[/C][C]404.5007[/C][C]382.3368[/C][C]427.9495[/C][C]0.0042[/C][C]0.9866[/C][C]1[/C][C]0.9974[/C][/ROW]
[ROW][C]28[/C][C]443[/C][C]469.1701[/C][C]443.4627[/C][C]496.3678[/C][C]0.0297[/C][C]1[/C][C]1[/C][C]1[/C][/ROW]
[ROW][C]29[/C][C]374[/C][C]396.8926[/C][C]375.1455[/C][C]419.9003[/C][C]0.0256[/C][C]0[/C][C]1[/C][C]0.9863[/C][/ROW]
[ROW][C]30[/C][C]660[/C][C]705.0232[/C][C]666.3926[/C][C]745.8932[/C][C]0.0154[/C][C]1[/C][C]1[/C][C]1[/C][/ROW]
[ROW][C]31[/C][C]1004[/C][C]1053.7307[/C][C]995.9933[/C][C]1114.8152[/C][C]0.0553[/C][C]1[/C][C]1[/C][C]1[/C][/ROW]
[ROW][C]32[/C][C]1153[/C][C]1217.3063[/C][C]1150.6059[/C][C]1287.8732[/C][C]0.037[/C][C]1[/C][C]1[/C][C]1[/C][/ROW]
[ROW][C]33[/C][C]1388[/C][C]1460.7675[/C][C]1380.7271[/C][C]1545.4478[/C][C]0.0461[/C][C]1[/C][C]1[/C][C]1[/C][/ROW]
[ROW][C]34[/C][C]904[/C][C]962.4328[/C][C]909.6978[/C][C]1018.2247[/C][C]0.02[/C][C]0[/C][C]1[/C][C]1[/C][/ROW]
[ROW][C]35[/C][C]715[/C][C]769.6926[/C][C]727.5185[/C][C]814.3115[/C][C]0.0081[/C][C]0[/C][C]1[/C][C]1[/C][/ROW]
[ROW][C]36[/C][C]441[/C][C]470.4381[/C][C]444.6613[/C][C]497.7093[/C][C]0.0172[/C][C]0[/C][C]1[/C][C]1[/C][/ROW]
[/TABLE]
Source: https://freestatistics.org/blog/index.php?pk=285847&T=1

Globally Unique Identifier (entire table): ba.freestatistics.org/blog/index.php?pk=285847&T=1

As an alternative you can also use a QR Code:  

The GUIDs for individual cells are displayed in the table below:

Univariate ARIMA Extrapolation Forecast
timeY[t]F[t]95% LB95% UBp-value(H0: Y[t] = F[t])P(F[t]>Y[t-1])P(F[t]>Y[t-s])P(F[t]>Y[24])
12277-------
13244-------
14296-------
15319-------
16370-------
17313-------
18556-------
19831-------
20960-------
211152-------
22759-------
23607-------
24371-------
25298309.3987292.4457327.33440.1064010
26378375.3361354.7702397.09420.4052110.652
27373404.5007382.3368427.94950.00420.986610.9974
28443469.1701443.4627496.36780.0297111
29374396.8926375.1455419.90030.0256010.9863
30660705.0232666.3926745.89320.0154111
3110041053.7307995.99331114.81520.0553111
3211531217.30631150.60591287.87320.037111
3313881460.76751380.72711545.44780.0461111
34904962.4328909.69781018.22470.02011
35715769.6926727.5185814.31150.0081011
36441470.4381444.6613497.70930.0172011


Univariate ARIMA Extrapolation Forecast Performance
time% S.E.PEMAPEsMAPESq.EMSERMSEScaledEMASE
250.0296-0.03830.03830.0375129.929700-0.05740.0574
260.02960.0070.02260.02237.096468.51318.27730.01340.0354
270.0296-0.08450.04330.0419992.2956376.440619.4021-0.15860.0765
280.0296-0.05910.04720.0458684.8751453.549221.2967-0.13170.0903
290.0296-0.06120.050.0485524.0693467.653221.6253-0.11520.0953
300.0296-0.06820.0530.05142027.0889727.559226.9733-0.22670.1172
310.0296-0.04950.05250.0512473.145976.928631.2559-0.25040.1362
320.0296-0.05580.05290.05144135.29411371.724237.0368-0.32370.1596
330.0296-0.05240.05290.05135295.10941807.655942.5165-0.36630.1826
340.0296-0.06460.05410.05253414.38691968.32944.3659-0.29420.1938
350.0296-0.07650.05610.05442991.28042061.324645.4018-0.27530.2012
360.0296-0.06680.0570.0552866.60441961.764644.2918-0.14820.1968

\begin{tabular}{lllllllll}
\hline
Univariate ARIMA Extrapolation Forecast Performance \tabularnewline
time & % S.E. & PE & MAPE & sMAPE & Sq.E & MSE & RMSE & ScaledE & MASE \tabularnewline
25 & 0.0296 & -0.0383 & 0.0383 & 0.0375 & 129.9297 & 0 & 0 & -0.0574 & 0.0574 \tabularnewline
26 & 0.0296 & 0.007 & 0.0226 & 0.0223 & 7.0964 & 68.5131 & 8.2773 & 0.0134 & 0.0354 \tabularnewline
27 & 0.0296 & -0.0845 & 0.0433 & 0.0419 & 992.2956 & 376.4406 & 19.4021 & -0.1586 & 0.0765 \tabularnewline
28 & 0.0296 & -0.0591 & 0.0472 & 0.0458 & 684.8751 & 453.5492 & 21.2967 & -0.1317 & 0.0903 \tabularnewline
29 & 0.0296 & -0.0612 & 0.05 & 0.0485 & 524.0693 & 467.6532 & 21.6253 & -0.1152 & 0.0953 \tabularnewline
30 & 0.0296 & -0.0682 & 0.053 & 0.0514 & 2027.0889 & 727.5592 & 26.9733 & -0.2267 & 0.1172 \tabularnewline
31 & 0.0296 & -0.0495 & 0.0525 & 0.051 & 2473.145 & 976.9286 & 31.2559 & -0.2504 & 0.1362 \tabularnewline
32 & 0.0296 & -0.0558 & 0.0529 & 0.0514 & 4135.2941 & 1371.7242 & 37.0368 & -0.3237 & 0.1596 \tabularnewline
33 & 0.0296 & -0.0524 & 0.0529 & 0.0513 & 5295.1094 & 1807.6559 & 42.5165 & -0.3663 & 0.1826 \tabularnewline
34 & 0.0296 & -0.0646 & 0.0541 & 0.0525 & 3414.3869 & 1968.329 & 44.3659 & -0.2942 & 0.1938 \tabularnewline
35 & 0.0296 & -0.0765 & 0.0561 & 0.0544 & 2991.2804 & 2061.3246 & 45.4018 & -0.2753 & 0.2012 \tabularnewline
36 & 0.0296 & -0.0668 & 0.057 & 0.0552 & 866.6044 & 1961.7646 & 44.2918 & -0.1482 & 0.1968 \tabularnewline
\hline
\end{tabular}
%Source: https://freestatistics.org/blog/index.php?pk=285847&T=2

[TABLE]
[ROW][C]Univariate ARIMA Extrapolation Forecast Performance[/C][/ROW]
[ROW][C]time[/C][C]% S.E.[/C][C]PE[/C][C]MAPE[/C][C]sMAPE[/C][C]Sq.E[/C][C]MSE[/C][C]RMSE[/C][C]ScaledE[/C][C]MASE[/C][/ROW]
[ROW][C]25[/C][C]0.0296[/C][C]-0.0383[/C][C]0.0383[/C][C]0.0375[/C][C]129.9297[/C][C]0[/C][C]0[/C][C]-0.0574[/C][C]0.0574[/C][/ROW]
[ROW][C]26[/C][C]0.0296[/C][C]0.007[/C][C]0.0226[/C][C]0.0223[/C][C]7.0964[/C][C]68.5131[/C][C]8.2773[/C][C]0.0134[/C][C]0.0354[/C][/ROW]
[ROW][C]27[/C][C]0.0296[/C][C]-0.0845[/C][C]0.0433[/C][C]0.0419[/C][C]992.2956[/C][C]376.4406[/C][C]19.4021[/C][C]-0.1586[/C][C]0.0765[/C][/ROW]
[ROW][C]28[/C][C]0.0296[/C][C]-0.0591[/C][C]0.0472[/C][C]0.0458[/C][C]684.8751[/C][C]453.5492[/C][C]21.2967[/C][C]-0.1317[/C][C]0.0903[/C][/ROW]
[ROW][C]29[/C][C]0.0296[/C][C]-0.0612[/C][C]0.05[/C][C]0.0485[/C][C]524.0693[/C][C]467.6532[/C][C]21.6253[/C][C]-0.1152[/C][C]0.0953[/C][/ROW]
[ROW][C]30[/C][C]0.0296[/C][C]-0.0682[/C][C]0.053[/C][C]0.0514[/C][C]2027.0889[/C][C]727.5592[/C][C]26.9733[/C][C]-0.2267[/C][C]0.1172[/C][/ROW]
[ROW][C]31[/C][C]0.0296[/C][C]-0.0495[/C][C]0.0525[/C][C]0.051[/C][C]2473.145[/C][C]976.9286[/C][C]31.2559[/C][C]-0.2504[/C][C]0.1362[/C][/ROW]
[ROW][C]32[/C][C]0.0296[/C][C]-0.0558[/C][C]0.0529[/C][C]0.0514[/C][C]4135.2941[/C][C]1371.7242[/C][C]37.0368[/C][C]-0.3237[/C][C]0.1596[/C][/ROW]
[ROW][C]33[/C][C]0.0296[/C][C]-0.0524[/C][C]0.0529[/C][C]0.0513[/C][C]5295.1094[/C][C]1807.6559[/C][C]42.5165[/C][C]-0.3663[/C][C]0.1826[/C][/ROW]
[ROW][C]34[/C][C]0.0296[/C][C]-0.0646[/C][C]0.0541[/C][C]0.0525[/C][C]3414.3869[/C][C]1968.329[/C][C]44.3659[/C][C]-0.2942[/C][C]0.1938[/C][/ROW]
[ROW][C]35[/C][C]0.0296[/C][C]-0.0765[/C][C]0.0561[/C][C]0.0544[/C][C]2991.2804[/C][C]2061.3246[/C][C]45.4018[/C][C]-0.2753[/C][C]0.2012[/C][/ROW]
[ROW][C]36[/C][C]0.0296[/C][C]-0.0668[/C][C]0.057[/C][C]0.0552[/C][C]866.6044[/C][C]1961.7646[/C][C]44.2918[/C][C]-0.1482[/C][C]0.1968[/C][/ROW]
[/TABLE]
Source: https://freestatistics.org/blog/index.php?pk=285847&T=2

Globally Unique Identifier (entire table): ba.freestatistics.org/blog/index.php?pk=285847&T=2

As an alternative you can also use a QR Code:  

The GUIDs for individual cells are displayed in the table below:

Univariate ARIMA Extrapolation Forecast Performance
time% S.E.PEMAPEsMAPESq.EMSERMSEScaledEMASE
250.0296-0.03830.03830.0375129.929700-0.05740.0574
260.02960.0070.02260.02237.096468.51318.27730.01340.0354
270.0296-0.08450.04330.0419992.2956376.440619.4021-0.15860.0765
280.0296-0.05910.04720.0458684.8751453.549221.2967-0.13170.0903
290.0296-0.06120.050.0485524.0693467.653221.6253-0.11520.0953
300.0296-0.06820.0530.05142027.0889727.559226.9733-0.22670.1172
310.0296-0.04950.05250.0512473.145976.928631.2559-0.25040.1362
320.0296-0.05580.05290.05144135.29411371.724237.0368-0.32370.1596
330.0296-0.05240.05290.05135295.10941807.655942.5165-0.36630.1826
340.0296-0.06460.05410.05253414.38691968.32944.3659-0.29420.1938
350.0296-0.07650.05610.05442991.28042061.324645.4018-0.27530.2012
360.0296-0.06680.0570.0552866.60441961.764644.2918-0.14820.1968


Parameters (Session):
par1 = 12 ; par2 = 0.0 ; par3 = 1 ; par4 = 1 ; par5 = 12 ; par6 = 0 ; par7 = 1 ; par8 = 0 ; par9 = 0 ; par10 = FALSE ;
Parameters (R input):
par1 = 12 ; par2 = 0.0 ; par3 = 1 ; par4 = 1 ; par5 = 12 ; par6 = 0 ; par7 = 1 ; par8 = 0 ; par9 = 0 ; par10 = FALSE ;
R code (references can be found in the software module):
par1 <- as.numeric(par1) #cut off periods
par2 <- as.numeric(par2) #lambda
par3 <- as.numeric(par3) #degree of non-seasonal differencing
par4 <- as.numeric(par4) #degree of seasonal differencing
par5 <- as.numeric(par5) #seasonal period
par6 <- as.numeric(par6) #p
par7 <- as.numeric(par7) #q
par8 <- as.numeric(par8) #P
par9 <- as.numeric(par9) #Q
if (par10 == 'TRUE') par10 <- TRUE
if (par10 == 'FALSE') par10 <- FALSE
if (par2 == 0) x <- log(x)
if (par2 != 0) x <- x^par2
lx <- length(x)
first <- lx - 2*par1
nx <- lx - par1
nx1 <- nx + 1
fx <- lx - nx
if (fx < 1) {
fx <- par5
nx1 <- lx + fx - 1
first <- lx - 2*fx
}
first <- 1
if (fx < 3) fx <- round(lx/10,0)
(arima.out <- arima(x[1:nx], order=c(par6,par3,par7), seasonal=list(order=c(par8,par4,par9), period=par5), include.mean=par10, method='ML'))
(forecast <- predict(arima.out,par1))
(lb <- forecast$pred - 1.96 * forecast$se)
(ub <- forecast$pred + 1.96 * forecast$se)
if (par2 == 0) {
x <- exp(x)
forecast$pred <- exp(forecast$pred)
lb <- exp(lb)
ub <- exp(ub)
}
if (par2 != 0) {
x <- x^(1/par2)
forecast$pred <- forecast$pred^(1/par2)
lb <- lb^(1/par2)
ub <- ub^(1/par2)
}
if (par2 < 0) {
olb <- lb
lb <- ub
ub <- olb
}
(actandfor <- c(x[1:nx], forecast$pred))
(perc.se <- (ub-forecast$pred)/1.96/forecast$pred)
bitmap(file='test1.png')
opar <- par(mar=c(4,4,2,2),las=1)
ylim <- c( min(x[first:nx],lb), max(x[first:nx],ub))
plot(x,ylim=ylim,type='n',xlim=c(first,lx))
usr <- par('usr')
rect(usr[1],usr[3],nx+1,usr[4],border=NA,col='lemonchiffon')
rect(nx1,usr[3],usr[2],usr[4],border=NA,col='lavender')
abline(h= (-3:3)*2 , col ='gray', lty =3)
polygon( c(nx1:lx,lx:nx1), c(lb,rev(ub)), col = 'orange', lty=2,border=NA)
lines(nx1:lx, lb , lty=2)
lines(nx1:lx, ub , lty=2)
lines(x, lwd=2)
lines(nx1:lx, forecast$pred , lwd=2 , col ='white')
box()
par(opar)
dev.off()
prob.dec <- array(NA, dim=fx)
prob.sdec <- array(NA, dim=fx)
prob.ldec <- array(NA, dim=fx)
prob.pval <- array(NA, dim=fx)
perf.pe <- array(0, dim=fx)
perf.spe <- array(0, dim=fx)
perf.scalederr <- array(0, dim=fx)
perf.mase <- array(0, dim=fx)
perf.mase1 <- array(0, dim=fx)
perf.mape <- array(0, dim=fx)
perf.smape <- array(0, dim=fx)
perf.mape1 <- array(0, dim=fx)
perf.smape1 <- array(0,dim=fx)
perf.se <- array(0, dim=fx)
perf.mse <- array(0, dim=fx)
perf.mse1 <- array(0, dim=fx)
perf.rmse <- array(0, dim=fx)
perf.scaleddenom <- 0
for (i in 2:fx) {
perf.scaleddenom = perf.scaleddenom + abs(x[nx+i] - x[nx+i-1])
}
perf.scaleddenom = perf.scaleddenom / (fx-1)
for (i in 1:fx) {
locSD <- (ub[i] - forecast$pred[i]) / 1.96
perf.scalederr[i] = (x[nx+i] - forecast$pred[i]) / perf.scaleddenom
perf.pe[i] = (x[nx+i] - forecast$pred[i]) / x[nx+i]
perf.spe[i] = 2*(x[nx+i] - forecast$pred[i]) / (x[nx+i] + forecast$pred[i])
perf.se[i] = (x[nx+i] - forecast$pred[i])^2
prob.dec[i] = pnorm((x[nx+i-1] - forecast$pred[i]) / locSD)
prob.sdec[i] = pnorm((x[nx+i-par5] - forecast$pred[i]) / locSD)
prob.ldec[i] = pnorm((x[nx] - forecast$pred[i]) / locSD)
prob.pval[i] = pnorm(abs(x[nx+i] - forecast$pred[i]) / locSD)
}
perf.mape[1] = abs(perf.pe[1])
perf.smape[1] = abs(perf.spe[1])
perf.mape1[1] = perf.mape[1]
perf.smape1[1] = perf.smape[1]
perf.mse[1] = perf.se[1]
perf.mase[1] = abs(perf.scalederr[1])
perf.mase1[1] = perf.mase[1]
for (i in 2:fx) {
perf.mape[i] = perf.mape[i-1] + abs(perf.pe[i])
perf.mape1[i] = perf.mape[i] / i
perf.smape[i] = perf.smape[i-1] + abs(perf.spe[i])
perf.smape1[i] = perf.smape[i] / i
perf.mse[i] = perf.mse[i-1] + perf.se[i]
perf.mse1[i] = perf.mse[i] / i
perf.mase[i] = perf.mase[i-1] + abs(perf.scalederr[i])
perf.mase1[i] = perf.mase[i] / i
}
perf.rmse = sqrt(perf.mse1)
bitmap(file='test2.png')
plot(forecast$pred, pch=19, type='b',main='ARIMA Extrapolation Forecast', ylab='Forecast and 95% CI', xlab='time',ylim=c(min(lb),max(ub)))
dum <- forecast$pred
dum[1:par1] <- x[(nx+1):lx]
lines(dum, lty=1)
lines(ub,lty=3)
lines(lb,lty=3)
dev.off()
load(file='createtable')
a<-table.start()
a<-table.row.start(a)
a<-table.element(a,'Univariate ARIMA Extrapolation Forecast',9,TRUE)
a<-table.row.end(a)
a<-table.row.start(a)
a<-table.element(a,'time',1,header=TRUE)
a<-table.element(a,'Y[t]',1,header=TRUE)
a<-table.element(a,'F[t]',1,header=TRUE)
a<-table.element(a,'95% LB',1,header=TRUE)
a<-table.element(a,'95% UB',1,header=TRUE)
a<-table.element(a,'p-value
(H0: Y[t] = F[t])',1,header=TRUE)
a<-table.element(a,'P(F[t]>Y[t-1])',1,header=TRUE)
a<-table.element(a,'P(F[t]>Y[t-s])',1,header=TRUE)
mylab <- paste('P(F[t]>Y[',nx,sep='')
mylab <- paste(mylab,'])',sep='')
a<-table.element(a,mylab,1,header=TRUE)
a<-table.row.end(a)
for (i in (nx-par5):nx) {
a<-table.row.start(a)
a<-table.element(a,i,header=TRUE)
a<-table.element(a,x[i])
a<-table.element(a,'-')
a<-table.row.end(a)
}
for (i in 1:fx) {
a<-table.row.start(a)
a<-table.element(a,nx+i,header=TRUE)
a<-table.element(a,round(x[nx+i],4))
a<-table.element(a,round(forecast$pred[i],4))
a<-table.element(a,round(lb[i],4))
a<-table.element(a,round(ub[i],4))
a<-table.element(a,round((1-prob.pval[i]),4))
a<-table.element(a,round((1-prob.dec[i]),4))
a<-table.element(a,round((1-prob.sdec[i]),4))
a<-table.element(a,round((1-prob.ldec[i]),4))
a<-table.row.end(a)
}
a<-table.end(a)
table.save(a,file='mytable.tab')
a<-table.start()
a<-table.row.start(a)
a<-table.element(a,'Univariate ARIMA Extrapolation Forecast Performance',10,TRUE)
a<-table.row.end(a)
a<-table.row.start(a)
a<-table.element(a,'time',1,header=TRUE)
a<-table.element(a,'% S.E.',1,header=TRUE)
a<-table.element(a,'PE',1,header=TRUE)
a<-table.element(a,'MAPE',1,header=TRUE)
a<-table.element(a,'sMAPE',1,header=TRUE)
a<-table.element(a,'Sq.E',1,header=TRUE)
a<-table.element(a,'MSE',1,header=TRUE)
a<-table.element(a,'RMSE',1,header=TRUE)
a<-table.element(a,'ScaledE',1,header=TRUE)
a<-table.element(a,'MASE',1,header=TRUE)
a<-table.row.end(a)
for (i in 1:fx) {
a<-table.row.start(a)
a<-table.element(a,nx+i,header=TRUE)
a<-table.element(a,round(perc.se[i],4))
a<-table.element(a,round(perf.pe[i],4))
a<-table.element(a,round(perf.mape1[i],4))
a<-table.element(a,round(perf.smape1[i],4))
a<-table.element(a,round(perf.se[i],4))
a<-table.element(a,round(perf.mse1[i],4))
a<-table.element(a,round(perf.rmse[i],4))
a<-table.element(a,round(perf.scalederr[i],4))
a<-table.element(a,round(perf.mase1[i],4))
a<-table.row.end(a)
}
a<-table.end(a)
table.save(a,file='mytable1.tab')