Free Statistics

of Irreproducible Research!

Author's title

Author*The author of this computation has been verified*
R Software Modulerwasp_cross.wasp
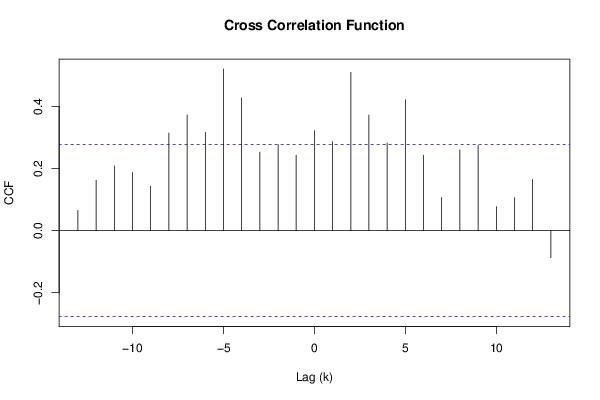
Title produced by softwareCross Correlation Function
Date of computationFri, 11 Dec 2015 09:51:40 +0000
Cite this page as followsStatistical Computations at FreeStatistics.org, Office for Research Development and Education, URL https://freestatistics.org/blog/index.php?v=date/2015/Dec/11/t1449827781k23jbfgnm9au5bh.htm/, Retrieved Thu, 16 May 2024 16:53:04 +0000
Statistical Computations at FreeStatistics.org, Office for Research Development and Education, URL https://freestatistics.org/blog/index.php?pk=285866, Retrieved Thu, 16 May 2024 16:53:04 +0000
QR Codes:

Original text written by user:
IsPrivate?No (this computation is public)
User-defined keywords
Estimated Impact106
Family? (F = Feedback message, R = changed R code, M = changed R Module, P = changed Parameters, D = changed Data)
-       [Cross Correlation Function] [X5 EN X1 Correlatie] [2015-12-11 09:51:40] [a6adb6e41ce68c761989548559553e3d] [Current]
Feedback Forum

Post a new message
Dataseries X:
11
11
18
11
9
8
12
13
7
9
13
4
9
11
12
10
12
7
15
15
22
14
20
26
12
9
19
17
21
18
19
14
19
19
16
13
13
14
9
13
22
17
34
26
23
23
18
15
22
26
Dataseries Y:
478
494
643
341
773
603
484
546
424
548
506
819
541
491
514
371
457
437
570
432
619
357
623
547
792
799
439
867
912
462
859
805
652
776
919
732
657
1419
989
821
1740
815
760
936
863
783
715
1504
1324
940


Summary of computational transaction
Raw Inputview raw input (R code)
Raw Outputview raw output of R engine
Computing time0 seconds
R Server'Herman Ole Andreas Wold' @ wold.wessa.net

\begin{tabular}{lllllllll}
\hline
Summary of computational transaction \tabularnewline
Raw Input & view raw input (R code)  \tabularnewline
Raw Output & view raw output of R engine  \tabularnewline
Computing time & 0 seconds \tabularnewline
R Server & 'Herman Ole Andreas Wold' @ wold.wessa.net \tabularnewline
\hline
\end{tabular}
%Source: https://freestatistics.org/blog/index.php?pk=285866&T=0

[TABLE]
[ROW][C]Summary of computational transaction[/C][/ROW]
[ROW][C]Raw Input[/C][C]view raw input (R code) [/C][/ROW]
[ROW][C]Raw Output[/C][C]view raw output of R engine [/C][/ROW]
[ROW][C]Computing time[/C][C]0 seconds[/C][/ROW]
[ROW][C]R Server[/C][C]'Herman Ole Andreas Wold' @ wold.wessa.net[/C][/ROW]
[/TABLE]
Source: https://freestatistics.org/blog/index.php?pk=285866&T=0

Globally Unique Identifier (entire table): ba.freestatistics.org/blog/index.php?pk=285866&T=0

As an alternative you can also use a QR Code:  

The GUIDs for individual cells are displayed in the table below:

Summary of computational transaction
Raw Inputview raw input (R code)
Raw Outputview raw output of R engine
Computing time0 seconds
R Server'Herman Ole Andreas Wold' @ wold.wessa.net


Cross Correlation Function
ParameterValue
Box-Cox transformation parameter (lambda) of X series1
Degree of non-seasonal differencing (d) of X series0
Degree of seasonal differencing (D) of X series0
Seasonal Period (s)1
Box-Cox transformation parameter (lambda) of Y series1
Degree of non-seasonal differencing (d) of Y series0
Degree of seasonal differencing (D) of Y series0
krho(Y[t],X[t+k])
-130.0649229125156957
-120.162349374299324
-110.208422824820482
-100.186946445489038
-90.143116049871091
-80.314400299491727
-70.373039412552353
-60.31680425757697
-50.521140971446992
-40.427553226208442
-30.25314044703872
-20.276826225306933
-10.243168691326607
00.32251867184634
10.28661485567835
20.510721821901516
30.372378464696305
40.282613576204949
50.422254209552283
60.243177912139331
70.106898172821725
80.260158407602866
90.274717333228855
100.0775654766332806
110.10594593949173
120.165095793369131
13-0.0871665556738937

\begin{tabular}{lllllllll}
\hline
Cross Correlation Function \tabularnewline
Parameter & Value \tabularnewline
Box-Cox transformation parameter (lambda) of X series & 1 \tabularnewline
Degree of non-seasonal differencing (d) of X series & 0 \tabularnewline
Degree of seasonal differencing (D) of X series & 0 \tabularnewline
Seasonal Period (s) & 1 \tabularnewline
Box-Cox transformation parameter (lambda) of Y series & 1 \tabularnewline
Degree of non-seasonal differencing (d) of Y series & 0 \tabularnewline
Degree of seasonal differencing (D) of Y series & 0 \tabularnewline
k & rho(Y[t],X[t+k]) \tabularnewline
-13 & 0.0649229125156957 \tabularnewline
-12 & 0.162349374299324 \tabularnewline
-11 & 0.208422824820482 \tabularnewline
-10 & 0.186946445489038 \tabularnewline
-9 & 0.143116049871091 \tabularnewline
-8 & 0.314400299491727 \tabularnewline
-7 & 0.373039412552353 \tabularnewline
-6 & 0.31680425757697 \tabularnewline
-5 & 0.521140971446992 \tabularnewline
-4 & 0.427553226208442 \tabularnewline
-3 & 0.25314044703872 \tabularnewline
-2 & 0.276826225306933 \tabularnewline
-1 & 0.243168691326607 \tabularnewline
0 & 0.32251867184634 \tabularnewline
1 & 0.28661485567835 \tabularnewline
2 & 0.510721821901516 \tabularnewline
3 & 0.372378464696305 \tabularnewline
4 & 0.282613576204949 \tabularnewline
5 & 0.422254209552283 \tabularnewline
6 & 0.243177912139331 \tabularnewline
7 & 0.106898172821725 \tabularnewline
8 & 0.260158407602866 \tabularnewline
9 & 0.274717333228855 \tabularnewline
10 & 0.0775654766332806 \tabularnewline
11 & 0.10594593949173 \tabularnewline
12 & 0.165095793369131 \tabularnewline
13 & -0.0871665556738937 \tabularnewline
\hline
\end{tabular}
%Source: https://freestatistics.org/blog/index.php?pk=285866&T=1

[TABLE]
[ROW][C]Cross Correlation Function[/C][/ROW]
[ROW][C]Parameter[/C][C]Value[/C][/ROW]
[ROW][C]Box-Cox transformation parameter (lambda) of X series[/C][C]1[/C][/ROW]
[ROW][C]Degree of non-seasonal differencing (d) of X series[/C][C]0[/C][/ROW]
[ROW][C]Degree of seasonal differencing (D) of X series[/C][C]0[/C][/ROW]
[ROW][C]Seasonal Period (s)[/C][C]1[/C][/ROW]
[ROW][C]Box-Cox transformation parameter (lambda) of Y series[/C][C]1[/C][/ROW]
[ROW][C]Degree of non-seasonal differencing (d) of Y series[/C][C]0[/C][/ROW]
[ROW][C]Degree of seasonal differencing (D) of Y series[/C][C]0[/C][/ROW]
[ROW][C]k[/C][C]rho(Y[t],X[t+k])[/C][/ROW]
[ROW][C]-13[/C][C]0.0649229125156957[/C][/ROW]
[ROW][C]-12[/C][C]0.162349374299324[/C][/ROW]
[ROW][C]-11[/C][C]0.208422824820482[/C][/ROW]
[ROW][C]-10[/C][C]0.186946445489038[/C][/ROW]
[ROW][C]-9[/C][C]0.143116049871091[/C][/ROW]
[ROW][C]-8[/C][C]0.314400299491727[/C][/ROW]
[ROW][C]-7[/C][C]0.373039412552353[/C][/ROW]
[ROW][C]-6[/C][C]0.31680425757697[/C][/ROW]
[ROW][C]-5[/C][C]0.521140971446992[/C][/ROW]
[ROW][C]-4[/C][C]0.427553226208442[/C][/ROW]
[ROW][C]-3[/C][C]0.25314044703872[/C][/ROW]
[ROW][C]-2[/C][C]0.276826225306933[/C][/ROW]
[ROW][C]-1[/C][C]0.243168691326607[/C][/ROW]
[ROW][C]0[/C][C]0.32251867184634[/C][/ROW]
[ROW][C]1[/C][C]0.28661485567835[/C][/ROW]
[ROW][C]2[/C][C]0.510721821901516[/C][/ROW]
[ROW][C]3[/C][C]0.372378464696305[/C][/ROW]
[ROW][C]4[/C][C]0.282613576204949[/C][/ROW]
[ROW][C]5[/C][C]0.422254209552283[/C][/ROW]
[ROW][C]6[/C][C]0.243177912139331[/C][/ROW]
[ROW][C]7[/C][C]0.106898172821725[/C][/ROW]
[ROW][C]8[/C][C]0.260158407602866[/C][/ROW]
[ROW][C]9[/C][C]0.274717333228855[/C][/ROW]
[ROW][C]10[/C][C]0.0775654766332806[/C][/ROW]
[ROW][C]11[/C][C]0.10594593949173[/C][/ROW]
[ROW][C]12[/C][C]0.165095793369131[/C][/ROW]
[ROW][C]13[/C][C]-0.0871665556738937[/C][/ROW]
[/TABLE]
Source: https://freestatistics.org/blog/index.php?pk=285866&T=1

Globally Unique Identifier (entire table): ba.freestatistics.org/blog/index.php?pk=285866&T=1

As an alternative you can also use a QR Code:  

The GUIDs for individual cells are displayed in the table below:

Cross Correlation Function
ParameterValue
Box-Cox transformation parameter (lambda) of X series1
Degree of non-seasonal differencing (d) of X series0
Degree of seasonal differencing (D) of X series0
Seasonal Period (s)1
Box-Cox transformation parameter (lambda) of Y series1
Degree of non-seasonal differencing (d) of Y series0
Degree of seasonal differencing (D) of Y series0
krho(Y[t],X[t+k])
-130.0649229125156957
-120.162349374299324
-110.208422824820482
-100.186946445489038
-90.143116049871091
-80.314400299491727
-70.373039412552353
-60.31680425757697
-50.521140971446992
-40.427553226208442
-30.25314044703872
-20.276826225306933
-10.243168691326607
00.32251867184634
10.28661485567835
20.510721821901516
30.372378464696305
40.282613576204949
50.422254209552283
60.243177912139331
70.106898172821725
80.260158407602866
90.274717333228855
100.0775654766332806
110.10594593949173
120.165095793369131
13-0.0871665556738937


Parameters (Session):
par1 = 1 ; par2 = 0 ; par3 = 0 ; par4 = 1 ; par5 = 1 ; par6 = 0 ; par7 = 0 ; par8 = na.fail ;
Parameters (R input):
par1 = 1 ; par2 = 0 ; par3 = 0 ; par4 = 1 ; par5 = 1 ; par6 = 0 ; par7 = 0 ; par8 = na.fail ;
R code (references can be found in the software module):
par1 <- as.numeric(par1)
par2 <- as.numeric(par2)
par3 <- as.numeric(par3)
par4 <- as.numeric(par4)
par5 <- as.numeric(par5)
par6 <- as.numeric(par6)
par7 <- as.numeric(par7)
if (par8=='na.fail') par8 <- na.fail else par8 <- na.pass
ccf <- function (x, y, lag.max = NULL, type = c('correlation', 'covariance'), plot = TRUE, na.action = na.fail, ...) {
type <- match.arg(type)
if (is.matrix(x) || is.matrix(y))
stop('univariate time series only')
X <- na.action(ts.intersect(as.ts(x), as.ts(y)))
colnames(X) <- c(deparse(substitute(x))[1L], deparse(substitute(y))[1L])
acf.out <- acf(X, lag.max = lag.max, plot = FALSE, type = type, na.action=na.action)
lag <- c(rev(acf.out$lag[-1, 2, 1]), acf.out$lag[, 1, 2])
y <- c(rev(acf.out$acf[-1, 2, 1]), acf.out$acf[, 1, 2])
acf.out$acf <- array(y, dim = c(length(y), 1L, 1L))
acf.out$lag <- array(lag, dim = c(length(y), 1L, 1L))
acf.out$snames <- paste(acf.out$snames, collapse = ' & ')
if (plot) {
plot(acf.out, ...)
return(invisible(acf.out))
}
else return(acf.out)
}
if (par1 == 0) {
x <- log(x)
} else {
x <- (x ^ par1 - 1) / par1
}
if (par5 == 0) {
y <- log(y)
} else {
y <- (y ^ par5 - 1) / par5
}
if (par2 > 0) x <- diff(x,lag=1,difference=par2)
if (par6 > 0) y <- diff(y,lag=1,difference=par6)
if (par3 > 0) x <- diff(x,lag=par4,difference=par3)
if (par7 > 0) y <- diff(y,lag=par4,difference=par7)
x
y
bitmap(file='test1.png')
(r <- ccf(x,y,na.action=par8,main='Cross Correlation Function',ylab='CCF',xlab='Lag (k)'))
dev.off()
load(file='createtable')
a<-table.start()
a<-table.row.start(a)
a<-table.element(a,'Cross Correlation Function',2,TRUE)
a<-table.row.end(a)
a<-table.row.start(a)
a<-table.element(a,'Parameter',header=TRUE)
a<-table.element(a,'Value',header=TRUE)
a<-table.row.end(a)
a<-table.row.start(a)
a<-table.element(a,'Box-Cox transformation parameter (lambda) of X series',header=TRUE)
a<-table.element(a,par1)
a<-table.row.end(a)
a<-table.row.start(a)
a<-table.element(a,'Degree of non-seasonal differencing (d) of X series',header=TRUE)
a<-table.element(a,par2)
a<-table.row.end(a)
a<-table.row.start(a)
a<-table.element(a,'Degree of seasonal differencing (D) of X series',header=TRUE)
a<-table.element(a,par3)
a<-table.row.end(a)
a<-table.row.start(a)
a<-table.element(a,'Seasonal Period (s)',header=TRUE)
a<-table.element(a,par4)
a<-table.row.end(a)
a<-table.row.start(a)
a<-table.element(a,'Box-Cox transformation parameter (lambda) of Y series',header=TRUE)
a<-table.element(a,par5)
a<-table.row.end(a)
a<-table.row.start(a)
a<-table.element(a,'Degree of non-seasonal differencing (d) of Y series',header=TRUE)
a<-table.element(a,par6)
a<-table.row.end(a)
a<-table.row.start(a)
a<-table.element(a,'Degree of seasonal differencing (D) of Y series',header=TRUE)
a<-table.element(a,par7)
a<-table.row.end(a)
a<-table.row.start(a)
a<-table.element(a,'k',header=TRUE)
a<-table.element(a,'rho(Y[t],X[t+k])',header=TRUE)
a<-table.row.end(a)
mylength <- length(r$acf)
myhalf <- floor((mylength-1)/2)
for (i in 1:mylength) {
a<-table.row.start(a)
a<-table.element(a,i-myhalf-1,header=TRUE)
a<-table.element(a,r$acf[i])
a<-table.row.end(a)
}
a<-table.end(a)
table.save(a,file='mytable.tab')