Free Statistics
of Irreproducible Research!
Description of Statistical Computation | |||||||||||||||||||||||||||||||||||||||||||||||||
|---|---|---|---|---|---|---|---|---|---|---|---|---|---|---|---|---|---|---|---|---|---|---|---|---|---|---|---|---|---|---|---|---|---|---|---|---|---|---|---|---|---|---|---|---|---|---|---|---|---|
| Author's title | |||||||||||||||||||||||||||||||||||||||||||||||||
| Author | *The author of this computation has been verified* | ||||||||||||||||||||||||||||||||||||||||||||||||
| R Software Module | rwasp_tukeylambda.wasp | ||||||||||||||||||||||||||||||||||||||||||||||||
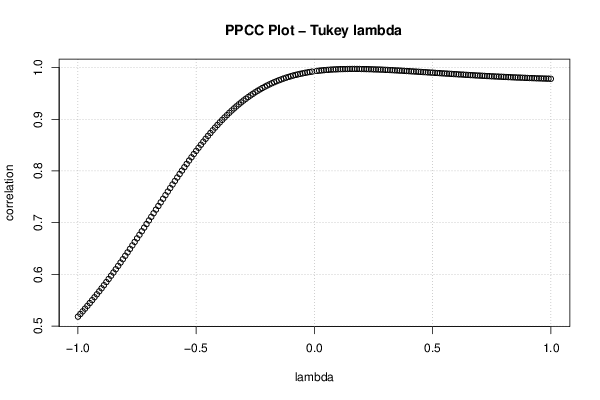
| Title produced by software | Tukey lambda PPCC Plot | ||||||||||||||||||||||||||||||||||||||||||||||||
| Date of computation | Fri, 11 Dec 2015 11:39:49 +0000 | ||||||||||||||||||||||||||||||||||||||||||||||||
| Cite this page as follows | Statistical Computations at FreeStatistics.org, Office for Research Development and Education, URL https://freestatistics.org/blog/index.php?v=date/2015/Dec/11/t14498340066npta1q0p8tg0ql.htm/, Retrieved Thu, 16 May 2024 11:09:05 +0000 | ||||||||||||||||||||||||||||||||||||||||||||||||
| Statistical Computations at FreeStatistics.org, Office for Research Development and Education, URL https://freestatistics.org/blog/index.php?pk=285893, Retrieved Thu, 16 May 2024 11:09:05 +0000 | |||||||||||||||||||||||||||||||||||||||||||||||||
| QR Codes: | |||||||||||||||||||||||||||||||||||||||||||||||||
|
| |||||||||||||||||||||||||||||||||||||||||||||||||
| Original text written by user: | |||||||||||||||||||||||||||||||||||||||||||||||||
| IsPrivate? | No (this computation is public) | ||||||||||||||||||||||||||||||||||||||||||||||||
| User-defined keywords | |||||||||||||||||||||||||||||||||||||||||||||||||
| Estimated Impact | 106 | ||||||||||||||||||||||||||||||||||||||||||||||||
Tree of Dependent Computations | |||||||||||||||||||||||||||||||||||||||||||||||||
| Family? (F = Feedback message, R = changed R code, M = changed R Module, P = changed Parameters, D = changed Data) | |||||||||||||||||||||||||||||||||||||||||||||||||
| - [Tukey lambda PPCC Plot] [tukey lambda - head] [2015-12-11 11:39:49] [a05da232bd4bc389022edd498fae0565] [Current] - D [Tukey lambda PPCC Plot] [] [2015-12-18 09:58:56] [bcd8153d44f369b7624d3c1b4621c4c3] | |||||||||||||||||||||||||||||||||||||||||||||||||
| Feedback Forum | |||||||||||||||||||||||||||||||||||||||||||||||||
Post a new message | |||||||||||||||||||||||||||||||||||||||||||||||||
Dataset | |||||||||||||||||||||||||||||||||||||||||||||||||
| Dataseries X: | |||||||||||||||||||||||||||||||||||||||||||||||||
4512 3738 4261 3777 4177 3585 3785 3559 3613 3982 3443 3993 3640 4208 3832 3876 3497 3466 3095 4424 3878 4046 3804 3710 4747 4423 4036 4022 3454 4175 3787 3796 4103 4161 4158 3814 3527 3748 3334 3492 3962 3505 4315 3804 3863 4034 4308 3165 3641 3644 3891 3793 4270 4063 4012 3458 3890 4166 3935 3669 3866 3393 4442 4253 3727 3329 3415 3372 4430 4381 4008 3858 4121 4057 3824 3394 3558 3362 3930 3835 3830 3856 3249 3577 3933 3850 3309 3406 3506 3907 4160 3318 3662 3899 3700 3779 3473 3490 3654 3478 3495 3834 3876 3661 3618 3648 4032 3399 3916 4430 3695 3524 3571 3594 3383 3499 3589 3900 4114 3937 3399 4200 4488 3614 4051 3782 3391 3124 4053 3582 3666 3532 4046 3667 2857 3436 3791 3302 3104 3171 3572 3530 3175 3438 3903 3899 3401 3267 3451 3090 3413 3323 3680 3439 3853 3156 3279 3707 4006 3269 3071 3779 3548 3292 3497 3082 3248 3358 3803 3566 3145 3503 3571 3724 3615 3203 3609 3561 3979 3533 3689 3158 4005 3181 3479 3642 3632 3069 3394 3703 3165 3354 3000 3687 3556 2773 3058 3344 3493 3297 3360 3228 3277 3851 3067 3692 3402 3995 3318 2720 2937 3580 2939 2989 3586 3156 3246 3170 3268 3389 3381 2864 3740 3479 3647 3716 3284 4204 3735 3218 3685 3704 3214 3394 3233 3352 3391 | |||||||||||||||||||||||||||||||||||||||||||||||||
Tables (Output of Computation) | |||||||||||||||||||||||||||||||||||||||||||||||||
| |||||||||||||||||||||||||||||||||||||||||||||||||
Figures (Output of Computation) | |||||||||||||||||||||||||||||||||||||||||||||||||
Input Parameters & R Code | |||||||||||||||||||||||||||||||||||||||||||||||||
| Parameters (Session): | |||||||||||||||||||||||||||||||||||||||||||||||||
| Parameters (R input): | |||||||||||||||||||||||||||||||||||||||||||||||||
| R code (references can be found in the software module): | |||||||||||||||||||||||||||||||||||||||||||||||||
gp <- function(lambda, p) | |||||||||||||||||||||||||||||||||||||||||||||||||