Free Statistics

of Irreproducible Research!

Author's title

Author*The author of this computation has been verified*
R Software Modulerwasp_autocorrelation.wasp
Title produced by software(Partial) Autocorrelation Function
Date of computationFri, 11 Dec 2015 12:50:57 +0000
Cite this page as followsStatistical Computations at FreeStatistics.org, Office for Research Development and Education, URL https://freestatistics.org/blog/index.php?v=date/2015/Dec/11/t1449838270nyg7ltk4sx8vvxd.htm/, Retrieved Thu, 16 May 2024 16:02:55 +0000
Statistical Computations at FreeStatistics.org, Office for Research Development and Education, URL https://freestatistics.org/blog/index.php?pk=285924, Retrieved Thu, 16 May 2024 16:02:55 +0000
QR Codes:

Original text written by user:
IsPrivate?No (this computation is public)
User-defined keywords
Estimated Impact61
Family? (F = Feedback message, R = changed R code, M = changed R Module, P = changed Parameters, D = changed Data)
-     [Univariate Data Series] [data set] [2008-12-01 19:54:57] [b98453cac15ba1066b407e146608df68]
- RMPD    [(Partial) Autocorrelation Function] [autocorrelatie to...] [2015-12-11 12:50:57] [20fcaaf1d4bc4a12bf87c6c50d624c14] [Current]
- R  D      [(Partial) Autocorrelation Function] [autocorrelatie to...] [2015-12-11 12:52:40] [22b6f4a061c8797aa483199554a73d13]
- RMPD      [Variance Reduction Matrix] [variantie totaal ...] [2015-12-11 12:59:29] [22b6f4a061c8797aa483199554a73d13]
- RMPD      [Variance Reduction Matrix] [variantie totaal ...] [2015-12-11 13:05:33] [22b6f4a061c8797aa483199554a73d13]
Feedback Forum

Post a new message
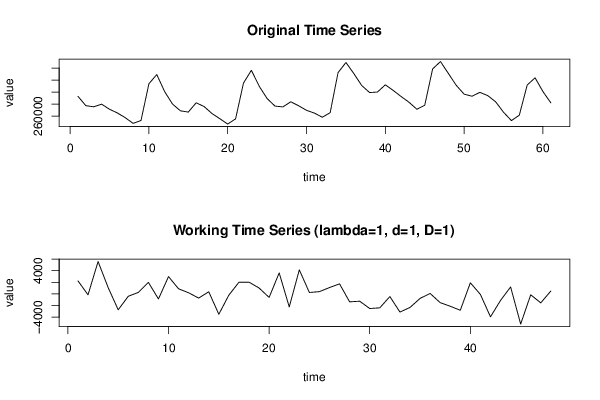
Dataseries X:
276444
268606
267679
269879
265641
262525
258597
253849
256221
286895
294610
280363
269926
264341
263269
271045
267915
262078
257751
253271
257638
287452
298152
284793
274560
268270
267577
271866
268546
264722
262425
258973
262751
296186
304659
295442
285466
279575
279985
286012
281337
276270
271472
265637
268974
299299
305452
295468
285584
278204
276505
279732
276980
271832
263105
256162
260705
285857
291870
280358
270981


Summary of computational transaction
Raw Inputview raw input (R code)
Raw Outputview raw output of R engine
Computing time1 seconds
R Server'Gwilym Jenkins' @ jenkins.wessa.net

\begin{tabular}{lllllllll}
\hline
Summary of computational transaction \tabularnewline
Raw Input & view raw input (R code)  \tabularnewline
Raw Output & view raw output of R engine  \tabularnewline
Computing time & 1 seconds \tabularnewline
R Server & 'Gwilym Jenkins' @ jenkins.wessa.net \tabularnewline
\hline
\end{tabular}
%Source: https://freestatistics.org/blog/index.php?pk=285924&T=0

[TABLE]
[ROW][C]Summary of computational transaction[/C][/ROW]
[ROW][C]Raw Input[/C][C]view raw input (R code) [/C][/ROW]
[ROW][C]Raw Output[/C][C]view raw output of R engine [/C][/ROW]
[ROW][C]Computing time[/C][C]1 seconds[/C][/ROW]
[ROW][C]R Server[/C][C]'Gwilym Jenkins' @ jenkins.wessa.net[/C][/ROW]
[/TABLE]
Source: https://freestatistics.org/blog/index.php?pk=285924&T=0

Globally Unique Identifier (entire table): ba.freestatistics.org/blog/index.php?pk=285924&T=0

As an alternative you can also use a QR Code:  

The GUIDs for individual cells are displayed in the table below:

Summary of computational transaction
Raw Inputview raw input (R code)
Raw Outputview raw output of R engine
Computing time1 seconds
R Server'Gwilym Jenkins' @ jenkins.wessa.net


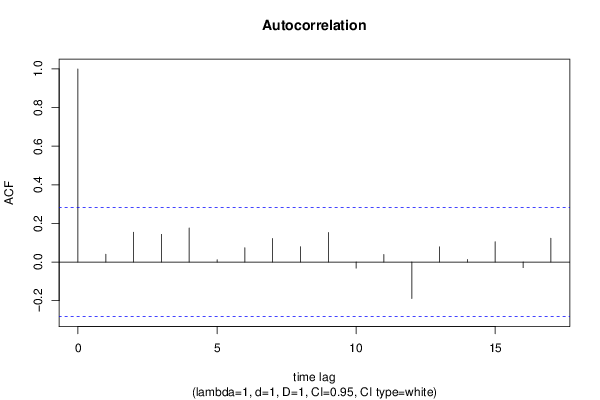
Autocorrelation Function
Time lag kACF(k)T-STATP-value
10.0406550.28170.389705
20.1543541.06940.14512
30.1434830.99410.162585
40.1765781.22340.113581
50.0122940.08520.466237
60.0736220.51010.306171
70.1218960.84450.201283
80.0795760.55130.291987
90.1527941.05860.147544
10-0.031637-0.21920.413718
110.039430.27320.392944
12-0.188958-1.30910.09836
130.0785550.54420.294396
140.0127790.08850.464909
150.1048530.72640.235547
16-0.029174-0.20210.420337
170.123350.85460.19851

\begin{tabular}{lllllllll}
\hline
Autocorrelation Function \tabularnewline
Time lag k & ACF(k) & T-STAT & P-value \tabularnewline
1 & 0.040655 & 0.2817 & 0.389705 \tabularnewline
2 & 0.154354 & 1.0694 & 0.14512 \tabularnewline
3 & 0.143483 & 0.9941 & 0.162585 \tabularnewline
4 & 0.176578 & 1.2234 & 0.113581 \tabularnewline
5 & 0.012294 & 0.0852 & 0.466237 \tabularnewline
6 & 0.073622 & 0.5101 & 0.306171 \tabularnewline
7 & 0.121896 & 0.8445 & 0.201283 \tabularnewline
8 & 0.079576 & 0.5513 & 0.291987 \tabularnewline
9 & 0.152794 & 1.0586 & 0.147544 \tabularnewline
10 & -0.031637 & -0.2192 & 0.413718 \tabularnewline
11 & 0.03943 & 0.2732 & 0.392944 \tabularnewline
12 & -0.188958 & -1.3091 & 0.09836 \tabularnewline
13 & 0.078555 & 0.5442 & 0.294396 \tabularnewline
14 & 0.012779 & 0.0885 & 0.464909 \tabularnewline
15 & 0.104853 & 0.7264 & 0.235547 \tabularnewline
16 & -0.029174 & -0.2021 & 0.420337 \tabularnewline
17 & 0.12335 & 0.8546 & 0.19851 \tabularnewline
\hline
\end{tabular}
%Source: https://freestatistics.org/blog/index.php?pk=285924&T=1

[TABLE]
[ROW][C]Autocorrelation Function[/C][/ROW]
[ROW][C]Time lag k[/C][C]ACF(k)[/C][C]T-STAT[/C][C]P-value[/C][/ROW]
[ROW][C]1[/C][C]0.040655[/C][C]0.2817[/C][C]0.389705[/C][/ROW]
[ROW][C]2[/C][C]0.154354[/C][C]1.0694[/C][C]0.14512[/C][/ROW]
[ROW][C]3[/C][C]0.143483[/C][C]0.9941[/C][C]0.162585[/C][/ROW]
[ROW][C]4[/C][C]0.176578[/C][C]1.2234[/C][C]0.113581[/C][/ROW]
[ROW][C]5[/C][C]0.012294[/C][C]0.0852[/C][C]0.466237[/C][/ROW]
[ROW][C]6[/C][C]0.073622[/C][C]0.5101[/C][C]0.306171[/C][/ROW]
[ROW][C]7[/C][C]0.121896[/C][C]0.8445[/C][C]0.201283[/C][/ROW]
[ROW][C]8[/C][C]0.079576[/C][C]0.5513[/C][C]0.291987[/C][/ROW]
[ROW][C]9[/C][C]0.152794[/C][C]1.0586[/C][C]0.147544[/C][/ROW]
[ROW][C]10[/C][C]-0.031637[/C][C]-0.2192[/C][C]0.413718[/C][/ROW]
[ROW][C]11[/C][C]0.03943[/C][C]0.2732[/C][C]0.392944[/C][/ROW]
[ROW][C]12[/C][C]-0.188958[/C][C]-1.3091[/C][C]0.09836[/C][/ROW]
[ROW][C]13[/C][C]0.078555[/C][C]0.5442[/C][C]0.294396[/C][/ROW]
[ROW][C]14[/C][C]0.012779[/C][C]0.0885[/C][C]0.464909[/C][/ROW]
[ROW][C]15[/C][C]0.104853[/C][C]0.7264[/C][C]0.235547[/C][/ROW]
[ROW][C]16[/C][C]-0.029174[/C][C]-0.2021[/C][C]0.420337[/C][/ROW]
[ROW][C]17[/C][C]0.12335[/C][C]0.8546[/C][C]0.19851[/C][/ROW]
[/TABLE]
Source: https://freestatistics.org/blog/index.php?pk=285924&T=1

Globally Unique Identifier (entire table): ba.freestatistics.org/blog/index.php?pk=285924&T=1

As an alternative you can also use a QR Code:  

The GUIDs for individual cells are displayed in the table below:

Autocorrelation Function
Time lag kACF(k)T-STATP-value
10.0406550.28170.389705
20.1543541.06940.14512
30.1434830.99410.162585
40.1765781.22340.113581
50.0122940.08520.466237
60.0736220.51010.306171
70.1218960.84450.201283
80.0795760.55130.291987
90.1527941.05860.147544
10-0.031637-0.21920.413718
110.039430.27320.392944
12-0.188958-1.30910.09836
130.0785550.54420.294396
140.0127790.08850.464909
150.1048530.72640.235547
16-0.029174-0.20210.420337
170.123350.85460.19851


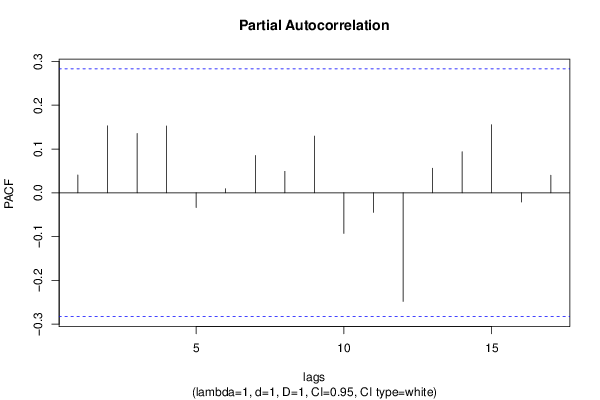
Partial Autocorrelation Function
Time lag kPACF(k)T-STATP-value
10.0406550.28170.389705
20.1529541.05970.147294
30.1353330.93760.176568
40.1527641.05840.14759
5-0.033466-0.23190.408817
60.009390.06510.474199
70.08510.58960.279114
80.0490110.33960.367835
90.1295430.89750.186966
10-0.092752-0.64260.26177
11-0.0448-0.31040.378807
12-0.247988-1.71810.04611
130.0559230.38740.35007
140.0938460.65020.259336
150.155411.07670.143495
16-0.021122-0.14630.442135
170.0400680.27760.391256

\begin{tabular}{lllllllll}
\hline
Partial Autocorrelation Function \tabularnewline
Time lag k & PACF(k) & T-STAT & P-value \tabularnewline
1 & 0.040655 & 0.2817 & 0.389705 \tabularnewline
2 & 0.152954 & 1.0597 & 0.147294 \tabularnewline
3 & 0.135333 & 0.9376 & 0.176568 \tabularnewline
4 & 0.152764 & 1.0584 & 0.14759 \tabularnewline
5 & -0.033466 & -0.2319 & 0.408817 \tabularnewline
6 & 0.00939 & 0.0651 & 0.474199 \tabularnewline
7 & 0.0851 & 0.5896 & 0.279114 \tabularnewline
8 & 0.049011 & 0.3396 & 0.367835 \tabularnewline
9 & 0.129543 & 0.8975 & 0.186966 \tabularnewline
10 & -0.092752 & -0.6426 & 0.26177 \tabularnewline
11 & -0.0448 & -0.3104 & 0.378807 \tabularnewline
12 & -0.247988 & -1.7181 & 0.04611 \tabularnewline
13 & 0.055923 & 0.3874 & 0.35007 \tabularnewline
14 & 0.093846 & 0.6502 & 0.259336 \tabularnewline
15 & 0.15541 & 1.0767 & 0.143495 \tabularnewline
16 & -0.021122 & -0.1463 & 0.442135 \tabularnewline
17 & 0.040068 & 0.2776 & 0.391256 \tabularnewline
\hline
\end{tabular}
%Source: https://freestatistics.org/blog/index.php?pk=285924&T=2

[TABLE]
[ROW][C]Partial Autocorrelation Function[/C][/ROW]
[ROW][C]Time lag k[/C][C]PACF(k)[/C][C]T-STAT[/C][C]P-value[/C][/ROW]
[ROW][C]1[/C][C]0.040655[/C][C]0.2817[/C][C]0.389705[/C][/ROW]
[ROW][C]2[/C][C]0.152954[/C][C]1.0597[/C][C]0.147294[/C][/ROW]
[ROW][C]3[/C][C]0.135333[/C][C]0.9376[/C][C]0.176568[/C][/ROW]
[ROW][C]4[/C][C]0.152764[/C][C]1.0584[/C][C]0.14759[/C][/ROW]
[ROW][C]5[/C][C]-0.033466[/C][C]-0.2319[/C][C]0.408817[/C][/ROW]
[ROW][C]6[/C][C]0.00939[/C][C]0.0651[/C][C]0.474199[/C][/ROW]
[ROW][C]7[/C][C]0.0851[/C][C]0.5896[/C][C]0.279114[/C][/ROW]
[ROW][C]8[/C][C]0.049011[/C][C]0.3396[/C][C]0.367835[/C][/ROW]
[ROW][C]9[/C][C]0.129543[/C][C]0.8975[/C][C]0.186966[/C][/ROW]
[ROW][C]10[/C][C]-0.092752[/C][C]-0.6426[/C][C]0.26177[/C][/ROW]
[ROW][C]11[/C][C]-0.0448[/C][C]-0.3104[/C][C]0.378807[/C][/ROW]
[ROW][C]12[/C][C]-0.247988[/C][C]-1.7181[/C][C]0.04611[/C][/ROW]
[ROW][C]13[/C][C]0.055923[/C][C]0.3874[/C][C]0.35007[/C][/ROW]
[ROW][C]14[/C][C]0.093846[/C][C]0.6502[/C][C]0.259336[/C][/ROW]
[ROW][C]15[/C][C]0.15541[/C][C]1.0767[/C][C]0.143495[/C][/ROW]
[ROW][C]16[/C][C]-0.021122[/C][C]-0.1463[/C][C]0.442135[/C][/ROW]
[ROW][C]17[/C][C]0.040068[/C][C]0.2776[/C][C]0.391256[/C][/ROW]
[/TABLE]
Source: https://freestatistics.org/blog/index.php?pk=285924&T=2

Globally Unique Identifier (entire table): ba.freestatistics.org/blog/index.php?pk=285924&T=2

As an alternative you can also use a QR Code:  

The GUIDs for individual cells are displayed in the table below:

Partial Autocorrelation Function
Time lag kPACF(k)T-STATP-value
10.0406550.28170.389705
20.1529541.05970.147294
30.1353330.93760.176568
40.1527641.05840.14759
5-0.033466-0.23190.408817
60.009390.06510.474199
70.08510.58960.279114
80.0490110.33960.367835
90.1295430.89750.186966
10-0.092752-0.64260.26177
11-0.0448-0.31040.378807
12-0.247988-1.71810.04611
130.0559230.38740.35007
140.0938460.65020.259336
150.155411.07670.143495
16-0.021122-0.14630.442135
170.0400680.27760.391256


Parameters (Session):
par1 = Default ; par2 = 1 ; par3 = 1 ; par4 = 1 ; par5 = 12 ; par6 = White Noise ; par7 = 0.95 ;
Parameters (R input):
par1 = Default ; par2 = 1 ; par3 = 1 ; par4 = 1 ; par5 = 12 ; par6 = White Noise ; par7 = 0.95 ; par8 = ;
R code (references can be found in the software module):
par8 <- ''
par7 <- '0.95'
par6 <- 'White Noise'
par5 <- '12'
par4 <- '1'
par3 <- '0'
par2 <- '1'
par1 <- 'Default'
if (par1 == 'Default') {
par1 = 10*log10(length(x))
} else {
par1 <- as.numeric(par1)
}
par2 <- as.numeric(par2)
par3 <- as.numeric(par3)
par4 <- as.numeric(par4)
par5 <- as.numeric(par5)
if (par6 == 'White Noise') par6 <- 'white' else par6 <- 'ma'
par7 <- as.numeric(par7)
if (par8 != '') par8 <- as.numeric(par8)
x <- na.omit(x)
ox <- x
if (par8 == '') {
if (par2 == 0) {
x <- log(x)
} else {
x <- (x ^ par2 - 1) / par2
}
} else {
x <- log(x,base=par8)
}
if (par3 > 0) x <- diff(x,lag=1,difference=par3)
if (par4 > 0) x <- diff(x,lag=par5,difference=par4)
bitmap(file='picts.png')
op <- par(mfrow=c(2,1))
plot(ox,type='l',main='Original Time Series',xlab='time',ylab='value')
if (par8=='') {
mytitle <- paste('Working Time Series (lambda=',par2,', d=',par3,', D=',par4,')',sep='')
mysub <- paste('(lambda=',par2,', d=',par3,', D=',par4,', CI=', par7, ', CI type=',par6,')',sep='')
} else {
mytitle <- paste('Working Time Series (base=',par8,', d=',par3,', D=',par4,')',sep='')
mysub <- paste('(base=',par8,', d=',par3,', D=',par4,', CI=', par7, ', CI type=',par6,')',sep='')
}
plot(x,type='l', main=mytitle,xlab='time',ylab='value')
par(op)
dev.off()
bitmap(file='pic1.png')
racf <- acf(x, par1, main='Autocorrelation', xlab='time lag', ylab='ACF', ci.type=par6, ci=par7, sub=mysub)
dev.off()
bitmap(file='pic2.png')
rpacf <- pacf(x,par1,main='Partial Autocorrelation',xlab='lags',ylab='PACF',sub=mysub)
dev.off()
(myacf <- c(racf$acf))
(mypacf <- c(rpacf$acf))
lengthx <- length(x)
sqrtn <- sqrt(lengthx)
load(file='createtable')
a<-table.start()
a<-table.row.start(a)
a<-table.element(a,'Autocorrelation Function',4,TRUE)
a<-table.row.end(a)
a<-table.row.start(a)
a<-table.element(a,'Time lag k',header=TRUE)
a<-table.element(a,hyperlink('basics.htm','ACF(k)','click here for more information about the Autocorrelation Function'),header=TRUE)
a<-table.element(a,'T-STAT',header=TRUE)
a<-table.element(a,'P-value',header=TRUE)
a<-table.row.end(a)
for (i in 2:(par1+1)) {
a<-table.row.start(a)
a<-table.element(a,i-1,header=TRUE)
a<-table.element(a,round(myacf[i],6))
mytstat <- myacf[i]*sqrtn
a<-table.element(a,round(mytstat,4))
a<-table.element(a,round(1-pt(abs(mytstat),lengthx),6))
a<-table.row.end(a)
}
a<-table.end(a)
table.save(a,file='mytable.tab')
a<-table.start()
a<-table.row.start(a)
a<-table.element(a,'Partial Autocorrelation Function',4,TRUE)
a<-table.row.end(a)
a<-table.row.start(a)
a<-table.element(a,'Time lag k',header=TRUE)
a<-table.element(a,hyperlink('basics.htm','PACF(k)','click here for more information about the Partial Autocorrelation Function'),header=TRUE)
a<-table.element(a,'T-STAT',header=TRUE)
a<-table.element(a,'P-value',header=TRUE)
a<-table.row.end(a)
for (i in 1:par1) {
a<-table.row.start(a)
a<-table.element(a,i,header=TRUE)
a<-table.element(a,round(mypacf[i],6))
mytstat <- mypacf[i]*sqrtn
a<-table.element(a,round(mytstat,4))
a<-table.element(a,round(1-pt(abs(mytstat),lengthx),6))
a<-table.row.end(a)
}
a<-table.end(a)
table.save(a,file='mytable1.tab')