Free Statistics

of Irreproducible Research!

Author's title

Author*The author of this computation has been verified*
R Software Modulerwasp_pairs.wasp
Title produced by softwareKendall tau Correlation Matrix
Date of computationFri, 11 Dec 2015 13:02:11 +0000
Cite this page as followsStatistical Computations at FreeStatistics.org, Office for Research Development and Education, URL https://freestatistics.org/blog/index.php?v=date/2015/Dec/11/t1449838977jmu4fcp3mjtwtk5.htm/, Retrieved Thu, 16 May 2024 21:37:53 +0000
Statistical Computations at FreeStatistics.org, Office for Research Development and Education, URL https://freestatistics.org/blog/index.php?pk=285931, Retrieved Thu, 16 May 2024 21:37:53 +0000
QR Codes:

Original text written by user:
IsPrivate?No (this computation is public)
User-defined keywords
Estimated Impact68
Family? (F = Feedback message, R = changed R code, M = changed R Module, P = changed Parameters, D = changed Data)
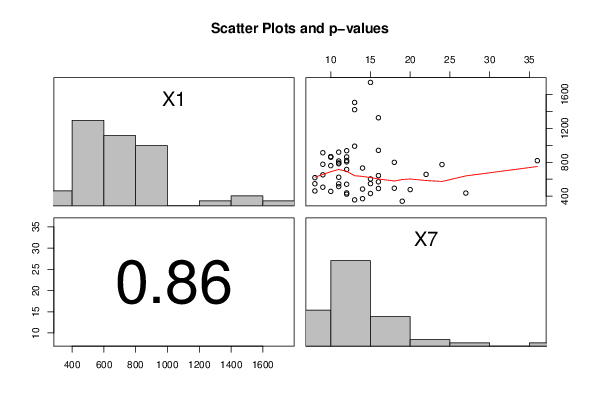
-       [Kendall tau Correlation Matrix] [Scatterplot x7] [2015-12-11 13:02:11] [53e3a4862cc086c76cbd8c4287fcb14b] [Current]
Feedback Forum

Post a new message
Dataseries X:
478 20
494 18
643 16
341 19
773 24
603 15
484 14
546 11
424 12
548 15
506 9
819 36
541 12
491 16
514 11
371 14
457 10
437 27
570 16
432 15
619 8
357 13
623 11
547 8
792 11
799 18
439 12
867 10
912 9
462 8
859 10
805 12
652 9
776 9
919 11
732 14
657 22
1419 13
989 13
821 12
1740 15
815 11
760 10
936 12
863 12
783 11
715 12
1504 13
1324 16
940 16


Summary of computational transaction
Raw Inputview raw input (R code)
Raw Outputview raw output of R engine
Computing time0 seconds
R Server'Gwilym Jenkins' @ jenkins.wessa.net

\begin{tabular}{lllllllll}
\hline
Summary of computational transaction \tabularnewline
Raw Input & view raw input (R code)  \tabularnewline
Raw Output & view raw output of R engine  \tabularnewline
Computing time & 0 seconds \tabularnewline
R Server & 'Gwilym Jenkins' @ jenkins.wessa.net \tabularnewline
\hline
\end{tabular}
%Source: https://freestatistics.org/blog/index.php?pk=285931&T=0

[TABLE]
[ROW][C]Summary of computational transaction[/C][/ROW]
[ROW][C]Raw Input[/C][C]view raw input (R code) [/C][/ROW]
[ROW][C]Raw Output[/C][C]view raw output of R engine [/C][/ROW]
[ROW][C]Computing time[/C][C]0 seconds[/C][/ROW]
[ROW][C]R Server[/C][C]'Gwilym Jenkins' @ jenkins.wessa.net[/C][/ROW]
[/TABLE]
Source: https://freestatistics.org/blog/index.php?pk=285931&T=0

Globally Unique Identifier (entire table): ba.freestatistics.org/blog/index.php?pk=285931&T=0

As an alternative you can also use a QR Code:  

The GUIDs for individual cells are displayed in the table below:

Summary of computational transaction
Raw Inputview raw input (R code)
Raw Outputview raw output of R engine
Computing time0 seconds
R Server'Gwilym Jenkins' @ jenkins.wessa.net


Correlations for all pairs of data series (method=pearson)
X1X7
X11-0.026
X7-0.0261

\begin{tabular}{lllllllll}
\hline
Correlations for all pairs of data series (method=pearson) \tabularnewline
  & X1 & X7 \tabularnewline
X1 & 1 & -0.026 \tabularnewline
X7 & -0.026 & 1 \tabularnewline
\hline
\end{tabular}
%Source: https://freestatistics.org/blog/index.php?pk=285931&T=1

[TABLE]
[ROW][C]Correlations for all pairs of data series (method=pearson)[/C][/ROW]
[ROW][C] [/C][C]X1[/C][C]X7[/C][/ROW]
[ROW][C]X1[/C][C]1[/C][C]-0.026[/C][/ROW]
[ROW][C]X7[/C][C]-0.026[/C][C]1[/C][/ROW]
[/TABLE]
Source: https://freestatistics.org/blog/index.php?pk=285931&T=1

Globally Unique Identifier (entire table): ba.freestatistics.org/blog/index.php?pk=285931&T=1

As an alternative you can also use a QR Code:  

The GUIDs for individual cells are displayed in the table below:

Correlations for all pairs of data series (method=pearson)
X1X7
X11-0.026
X7-0.0261


Correlations for all pairs of data series with p-values
pairPearson rSpearman rhoKendall tau
X1;X7-0.0263-0.0801-0.0348
p-value(0.8562)(0.5802)(0.7301)

\begin{tabular}{lllllllll}
\hline
Correlations for all pairs of data series with p-values \tabularnewline
pair & Pearson r & Spearman rho & Kendall tau \tabularnewline
X1;X7 & -0.0263 & -0.0801 & -0.0348 \tabularnewline
p-value & (0.8562) & (0.5802) & (0.7301) \tabularnewline
\hline
\end{tabular}
%Source: https://freestatistics.org/blog/index.php?pk=285931&T=2

[TABLE]
[ROW][C]Correlations for all pairs of data series with p-values[/C][/ROW]
[ROW][C]pair[/C][C]Pearson r[/C][C]Spearman rho[/C][C]Kendall tau[/C][/ROW]
[ROW][C]X1;X7[/C][C]-0.0263[/C][C]-0.0801[/C][C]-0.0348[/C][/ROW]
[ROW][C]p-value[/C][C](0.8562)[/C][C](0.5802)[/C][C](0.7301)[/C][/ROW]
[/TABLE]
Source: https://freestatistics.org/blog/index.php?pk=285931&T=2

Globally Unique Identifier (entire table): ba.freestatistics.org/blog/index.php?pk=285931&T=2

As an alternative you can also use a QR Code:  

The GUIDs for individual cells are displayed in the table below:

Correlations for all pairs of data series with p-values
pairPearson rSpearman rhoKendall tau
X1;X7-0.0263-0.0801-0.0348
p-value(0.8562)(0.5802)(0.7301)


Meta Analysis of Correlation Tests
Number of significant by total number of Correlations
Type I errorPearson rSpearman rhoKendall tau
0.01000
0.02000
0.03000
0.04000
0.05000
0.06000
0.07000
0.08000
0.09000
0.1000

\begin{tabular}{lllllllll}
\hline
Meta Analysis of Correlation Tests \tabularnewline
Number of significant by total number of Correlations \tabularnewline
Type I error & Pearson r & Spearman rho & Kendall tau \tabularnewline
0.01 & 0 & 0 & 0 \tabularnewline
0.02 & 0 & 0 & 0 \tabularnewline
0.03 & 0 & 0 & 0 \tabularnewline
0.04 & 0 & 0 & 0 \tabularnewline
0.05 & 0 & 0 & 0 \tabularnewline
0.06 & 0 & 0 & 0 \tabularnewline
0.07 & 0 & 0 & 0 \tabularnewline
0.08 & 0 & 0 & 0 \tabularnewline
0.09 & 0 & 0 & 0 \tabularnewline
0.1 & 0 & 0 & 0 \tabularnewline
\hline
\end{tabular}
%Source: https://freestatistics.org/blog/index.php?pk=285931&T=3

[TABLE]
[ROW][C]Meta Analysis of Correlation Tests[/C][/ROW]
[ROW][C]Number of significant by total number of Correlations[/C][/ROW]
[ROW][C]Type I error[/C][C]Pearson r[/C][C]Spearman rho[/C][C]Kendall tau[/C][/ROW]
[ROW][C]0.01[/C][C]0[/C][C]0[/C][C]0[/C][/ROW]
[ROW][C]0.02[/C][C]0[/C][C]0[/C][C]0[/C][/ROW]
[ROW][C]0.03[/C][C]0[/C][C]0[/C][C]0[/C][/ROW]
[ROW][C]0.04[/C][C]0[/C][C]0[/C][C]0[/C][/ROW]
[ROW][C]0.05[/C][C]0[/C][C]0[/C][C]0[/C][/ROW]
[ROW][C]0.06[/C][C]0[/C][C]0[/C][C]0[/C][/ROW]
[ROW][C]0.07[/C][C]0[/C][C]0[/C][C]0[/C][/ROW]
[ROW][C]0.08[/C][C]0[/C][C]0[/C][C]0[/C][/ROW]
[ROW][C]0.09[/C][C]0[/C][C]0[/C][C]0[/C][/ROW]
[ROW][C]0.1[/C][C]0[/C][C]0[/C][C]0[/C][/ROW]
[/TABLE]
Source: https://freestatistics.org/blog/index.php?pk=285931&T=3

Globally Unique Identifier (entire table): ba.freestatistics.org/blog/index.php?pk=285931&T=3

As an alternative you can also use a QR Code:  

The GUIDs for individual cells are displayed in the table below:

Meta Analysis of Correlation Tests
Number of significant by total number of Correlations
Type I errorPearson rSpearman rhoKendall tau
0.01000
0.02000
0.03000
0.04000
0.05000
0.06000
0.07000
0.08000
0.09000
0.1000


Parameters (Session):
par1 = pearson ;
Parameters (R input):
par1 = pearson ;
R code (references can be found in the software module):
panel.tau <- function(x, y, digits=2, prefix='', cex.cor)
{
usr <- par('usr'); on.exit(par(usr))
par(usr = c(0, 1, 0, 1))
rr <- cor.test(x, y, method=par1)
r <- round(rr$p.value,2)
txt <- format(c(r, 0.123456789), digits=digits)[1]
txt <- paste(prefix, txt, sep='')
if(missing(cex.cor)) cex <- 0.5/strwidth(txt)
text(0.5, 0.5, txt, cex = cex)
}
panel.hist <- function(x, ...)
{
usr <- par('usr'); on.exit(par(usr))
par(usr = c(usr[1:2], 0, 1.5) )
h <- hist(x, plot = FALSE)
breaks <- h$breaks; nB <- length(breaks)
y <- h$counts; y <- y/max(y)
rect(breaks[-nB], 0, breaks[-1], y, col='grey', ...)
}
x <- na.omit(x)
y <- t(na.omit(t(y)))
bitmap(file='test1.png')
pairs(t(y),diag.panel=panel.hist, upper.panel=panel.smooth, lower.panel=panel.tau, main=main)
dev.off()
load(file='createtable')
n <- length(y[,1])
n
a<-table.start()
a<-table.row.start(a)
a<-table.element(a,paste('Correlations for all pairs of data series (method=',par1,')',sep=''),n+1,TRUE)
a<-table.row.end(a)
a<-table.row.start(a)
a<-table.element(a,' ',header=TRUE)
for (i in 1:n) {
a<-table.element(a,dimnames(t(x))[[2]][i],header=TRUE)
}
a<-table.row.end(a)
for (i in 1:n) {
a<-table.row.start(a)
a<-table.element(a,dimnames(t(x))[[2]][i],header=TRUE)
for (j in 1:n) {
r <- cor.test(y[i,],y[j,],method=par1)
a<-table.element(a,round(r$estimate,3))
}
a<-table.row.end(a)
}
a<-table.end(a)
table.save(a,file='mytable.tab')
ncorrs <- (n*n -n)/2
mycorrs <- array(0, dim=c(10,3))
a<-table.start()
a<-table.row.start(a)
a<-table.element(a,'Correlations for all pairs of data series with p-values',4,TRUE)
a<-table.row.end(a)
a<-table.row.start(a)
a<-table.element(a,'pair',1,TRUE)
a<-table.element(a,'Pearson r',1,TRUE)
a<-table.element(a,'Spearman rho',1,TRUE)
a<-table.element(a,'Kendall tau',1,TRUE)
a<-table.row.end(a)
cor.test(y[1,],y[2,],method=par1)
for (i in 1:(n-1))
{
for (j in (i+1):n)
{
a<-table.row.start(a)
dum <- paste(dimnames(t(x))[[2]][i],';',dimnames(t(x))[[2]][j],sep='')
a<-table.element(a,dum,header=TRUE)
rp <- cor.test(y[i,],y[j,],method='pearson')
a<-table.element(a,round(rp$estimate,4))
rs <- cor.test(y[i,],y[j,],method='spearman')
a<-table.element(a,round(rs$estimate,4))
rk <- cor.test(y[i,],y[j,],method='kendall')
a<-table.element(a,round(rk$estimate,4))
a<-table.row.end(a)
a<-table.row.start(a)
a<-table.element(a,'p-value',header=T)
a<-table.element(a,paste('(',round(rp$p.value,4),')',sep=''))
a<-table.element(a,paste('(',round(rs$p.value,4),')',sep=''))
a<-table.element(a,paste('(',round(rk$p.value,4),')',sep=''))
a<-table.row.end(a)
for (iii in 1:10) {
iiid100 <- iii / 100
if (rp$p.value < iiid100) mycorrs[iii, 1] = mycorrs[iii, 1] + 1
if (rs$p.value < iiid100) mycorrs[iii, 2] = mycorrs[iii, 2] + 1
if (rk$p.value < iiid100) mycorrs[iii, 3] = mycorrs[iii, 3] + 1
}
}
}
a<-table.end(a)
table.save(a,file='mytable1.tab')
a<-table.start()
a<-table.row.start(a)
a<-table.element(a,'Meta Analysis of Correlation Tests',4,TRUE)
a<-table.row.end(a)
a<-table.row.start(a)
a<-table.element(a,'Number of significant by total number of Correlations',4,TRUE)
a<-table.row.end(a)
a<-table.row.start(a)
a<-table.element(a,'Type I error',1,TRUE)
a<-table.element(a,'Pearson r',1,TRUE)
a<-table.element(a,'Spearman rho',1,TRUE)
a<-table.element(a,'Kendall tau',1,TRUE)
a<-table.row.end(a)
for (iii in 1:10) {
iiid100 <- iii / 100
a<-table.row.start(a)
a<-table.element(a,round(iiid100,2),header=T)
a<-table.element(a,round(mycorrs[iii,1]/ncorrs,2))
a<-table.element(a,round(mycorrs[iii,2]/ncorrs,2))
a<-table.element(a,round(mycorrs[iii,3]/ncorrs,2))
a<-table.row.end(a)
}
a<-table.end(a)
table.save(a,file='mytable2.tab')