Free Statistics

of Irreproducible Research!

Author's title

Author*The author of this computation has been verified*
R Software Modulerwasp_bootstrapplot.wasp
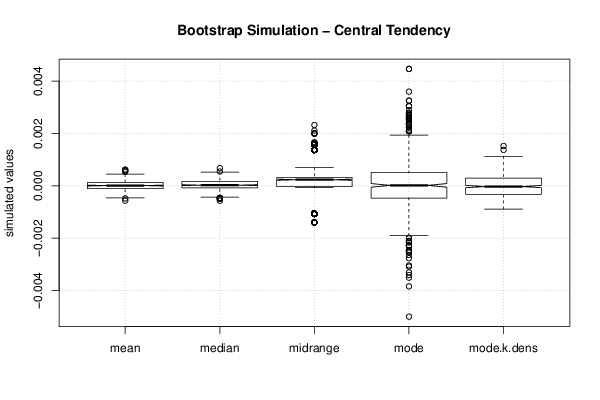
Title produced by softwareBlocked Bootstrap Plot - Central Tendency
Date of computationFri, 11 Dec 2015 14:54:35 +0000
Cite this page as followsStatistical Computations at FreeStatistics.org, Office for Research Development and Education, URL https://freestatistics.org/blog/index.php?v=date/2015/Dec/11/t1449845713t12g7zox7u539ml.htm/, Retrieved Thu, 16 May 2024 19:11:59 +0000
Statistical Computations at FreeStatistics.org, Office for Research Development and Education, URL https://freestatistics.org/blog/index.php?pk=285969, Retrieved Thu, 16 May 2024 19:11:59 +0000
QR Codes:

Original text written by user:
IsPrivate?No (this computation is public)
User-defined keywords
Estimated Impact52
Family? (F = Feedback message, R = changed R code, M = changed R Module, P = changed Parameters, D = changed Data)
-       [Blocked Bootstrap Plot - Central Tendency] [Blocked Bootstrap...] [2015-12-11 14:54:35] [4bfd98e85da8d65970e2f1f883f9da72] [Current]
Feedback Forum

Post a new message
Dataseries X:
-0.000830616394377666
-0.00217087736686087
-0.00074420026186913
0.000866119841126281
0.00110874338598884
-0.00331026578193515
-0.00351361885042004
-0.00153118277282079
-0.0015144884022786
0.00128356993671869
0.00149155950956391
-0.00384596939991697
-0.00500439657674154
0.000907992107513854
-0.00276740950533674
0.00194123854071811
-0.00727148922439195
0.00446821195533995
0.0025675129169935
0.00111852907130615
0.000177657731460723
-0.0023080927267596
-0.00441769167207709
0.00162132463434916
-0.00049312198322883
0.000423749128236736
0.00511269751267707
0.00234072362027584
-0.000725515857422071
-0.00451519874980857
0.00210677907882325
-0.00200516421155062
0.00270728256038345
-0.00273563233018959
-0.00335525321364332
0.0013869246532538
0.00117275074699273
0.00411699520424155
-0.002112949845863
-0.00459962697401286
-0.00080868132220656
0.0044677884107055
0.00273416738878983
0.000797867790875228
0.00159034082068879
-0.00019429421298422
0.00185743250696807
0.0031536832361225
0.00142341371089048
0.00773690474936147
-0.00122796502113955
-0.000890201308304278
-0.00298483986549153
-0.00195899271811672
-0.00308854990361402
0.00173856199021156
0.000489803948920651
-7.72593594471491e-05
-0.0014929759440083
0.000355095235735099
-0.00213617186542915
0.000393237730359364
0.00314473906383679
-0.00128434623221824
-0.000499750275298062
-0.00210944855096696
-0.00235575372970138
0.00159015201133718
-0.000716011784037044
-0.000490589918802115
-1.9602998838638e-05
-0.00127204426096681
0.000147208797153351
1.32222078370964e-05
0.00220588003083355
0.000508748080129951
-0.000381693428320164
-0.00127543262710258
0.00120489050471911
0.000554161916804196
0.000471588988376432
0.000834013191674272
-0.00111566511058388
0.0011742776161158
0.000546117666793331
0.00127274282648352
0.000315423274288868
0.000369279485536819
-0.000374510269234132
-0.0010602179474654
0.000844734586164225
-0.000784692130776965
0.000164220602010325
0.000325140613146788
-0.000561904703047603
0.00224392259503174
0.00193384438190774
0.00252908555751111
0.00305429788271937
0.00232446856739655
-0.000444269271333975
-0.00105044905897234
-0.000781602944646357
-0.00211856556150784
0.00304184657900462
-0.000281481641659432
0.000346705980444821
0.00232321302099502
-0.00123221575118798
-0.000427009570773048
-0.000989407962138414
-0.000644459441726152
-0.00186615523708969
0.00208155260264458
-0.00042367049061435
-0.000810192534237934
-1.99748996837454e-05
-0.000651268353576058
-0.00181652506593953
-0.000751369959354825
0.000343749939033168
0.000753240688615269
0.00514546595725425
-0.00373880123457549
-0.000765740544340116
0.00115914031069109
-7.70375461684578e-05
0.00163688286465245
0.000141637907034179
-0.00200888870528688
0.000503575269585197
0.000851149357146722


Summary of computational transaction
Raw Inputview raw input (R code)
Raw Outputview raw output of R engine
Computing time7 seconds
R Server'Herman Ole Andreas Wold' @ wold.wessa.net

\begin{tabular}{lllllllll}
\hline
Summary of computational transaction \tabularnewline
Raw Input & view raw input (R code)  \tabularnewline
Raw Output & view raw output of R engine  \tabularnewline
Computing time & 7 seconds \tabularnewline
R Server & 'Herman Ole Andreas Wold' @ wold.wessa.net \tabularnewline
\hline
\end{tabular}
%Source: https://freestatistics.org/blog/index.php?pk=285969&T=0

[TABLE]
[ROW][C]Summary of computational transaction[/C][/ROW]
[ROW][C]Raw Input[/C][C]view raw input (R code) [/C][/ROW]
[ROW][C]Raw Output[/C][C]view raw output of R engine [/C][/ROW]
[ROW][C]Computing time[/C][C]7 seconds[/C][/ROW]
[ROW][C]R Server[/C][C]'Herman Ole Andreas Wold' @ wold.wessa.net[/C][/ROW]
[/TABLE]
Source: https://freestatistics.org/blog/index.php?pk=285969&T=0

Globally Unique Identifier (entire table): ba.freestatistics.org/blog/index.php?pk=285969&T=0

As an alternative you can also use a QR Code:  

The GUIDs for individual cells are displayed in the table below:

Summary of computational transaction
Raw Inputview raw input (R code)
Raw Outputview raw output of R engine
Computing time7 seconds
R Server'Herman Ole Andreas Wold' @ wold.wessa.net


Estimation Results of Blocked Bootstrap
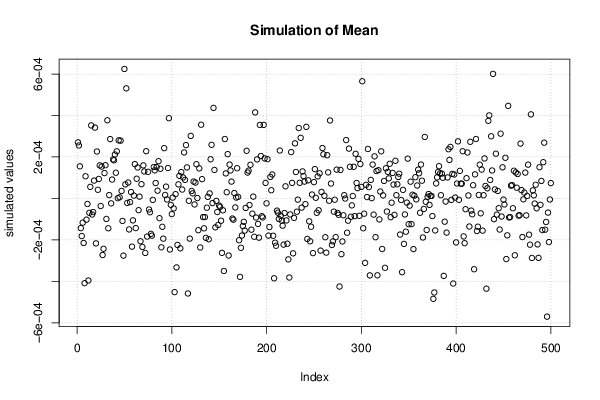
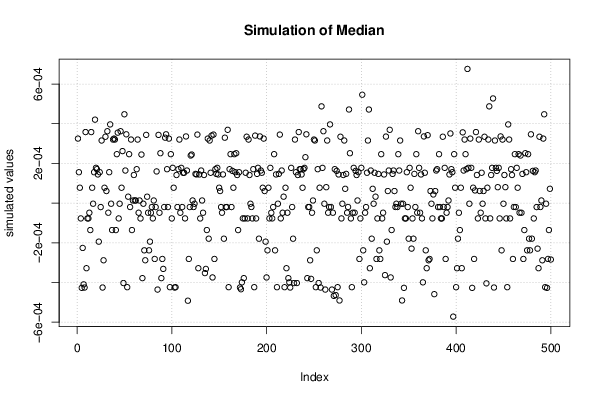
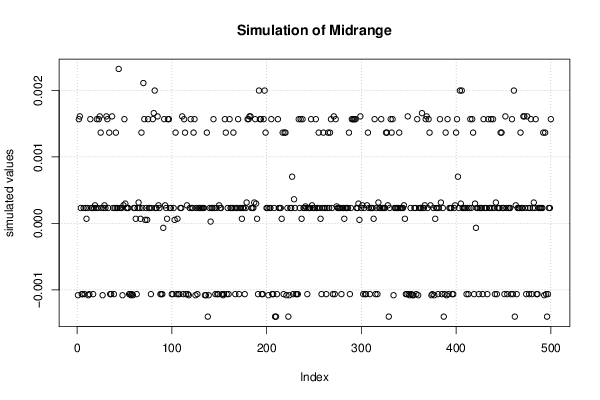
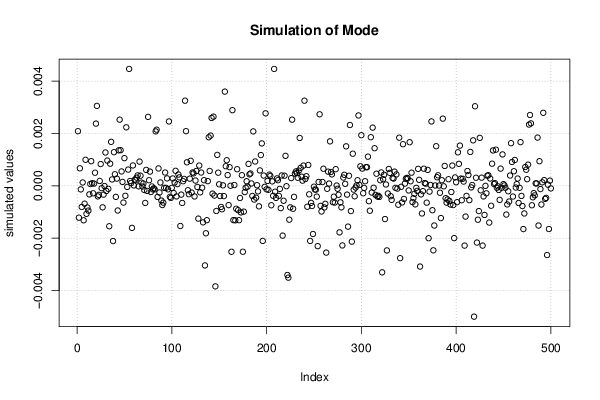
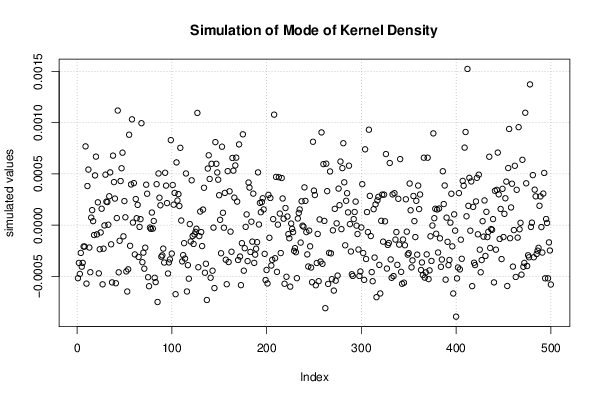
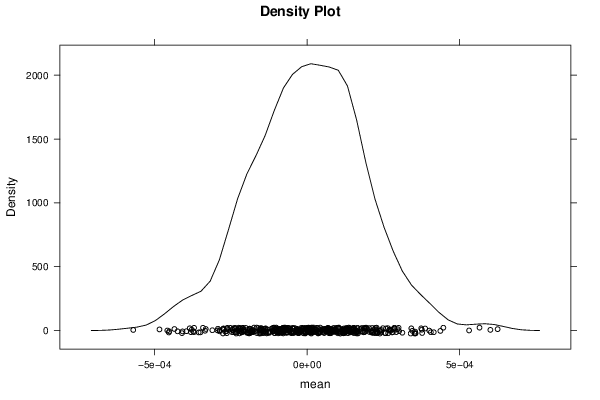
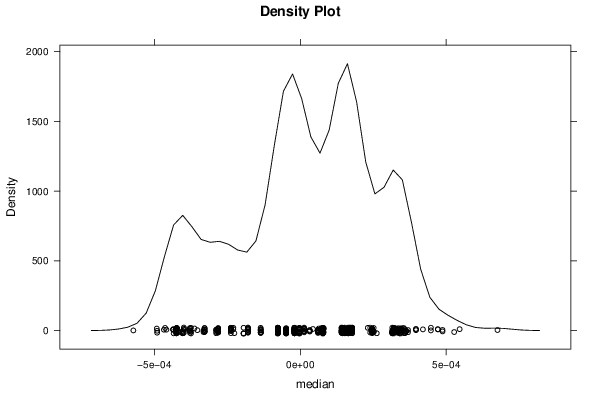
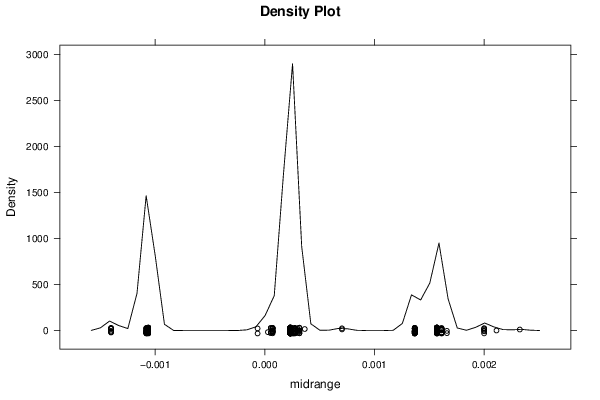
statisticP1P5Q1EstimateQ3P95P99S.D.IQR
mean-0.00043527-0.00028663-0.00010893-5.6411e-070.00012790.000286860.000436830.000183750.00023684
median-0.00046342-0.00042367-7.7259e-05-3.1904e-060.000170940.000351110.000471750.000240890.0002482
midrange-0.0014016-0.00107944.5911e-060.000232710.000315130.00161090.00199910.000923310.00031054
mode-0.0030908-0.0019098-0.00046797-5.6411e-070.000509070.00224010.00305630.00115750.00097705
mode k.dens-0.00067246-0.00056747-0.00032953-9.2152e-050.00029630.000740270.00107750.000413780.00062583

\begin{tabular}{lllllllll}
\hline
Estimation Results of Blocked Bootstrap \tabularnewline
statistic & P1 & P5 & Q1 & Estimate & Q3 & P95 & P99 & S.D. & IQR \tabularnewline
mean & -0.00043527 & -0.00028663 & -0.00010893 & -5.6411e-07 & 0.0001279 & 0.00028686 & 0.00043683 & 0.00018375 & 0.00023684 \tabularnewline
median & -0.00046342 & -0.00042367 & -7.7259e-05 & -3.1904e-06 & 0.00017094 & 0.00035111 & 0.00047175 & 0.00024089 & 0.0002482 \tabularnewline
midrange & -0.0014016 & -0.0010794 & 4.5911e-06 & 0.00023271 & 0.00031513 & 0.0016109 & 0.0019991 & 0.00092331 & 0.00031054 \tabularnewline
mode & -0.0030908 & -0.0019098 & -0.00046797 & -5.6411e-07 & 0.00050907 & 0.0022401 & 0.0030563 & 0.0011575 & 0.00097705 \tabularnewline
mode k.dens & -0.00067246 & -0.00056747 & -0.00032953 & -9.2152e-05 & 0.0002963 & 0.00074027 & 0.0010775 & 0.00041378 & 0.00062583 \tabularnewline
\hline
\end{tabular}
%Source: https://freestatistics.org/blog/index.php?pk=285969&T=1

[TABLE]
[ROW][C]Estimation Results of Blocked Bootstrap[/C][/ROW]
[ROW][C]statistic[/C][C]P1[/C][C]P5[/C][C]Q1[/C][C]Estimate[/C][C]Q3[/C][C]P95[/C][C]P99[/C][C]S.D.[/C][C]IQR[/C][/ROW]
[ROW][C]mean[/C][C]-0.00043527[/C][C]-0.00028663[/C][C]-0.00010893[/C][C]-5.6411e-07[/C][C]0.0001279[/C][C]0.00028686[/C][C]0.00043683[/C][C]0.00018375[/C][C]0.00023684[/C][/ROW]
[ROW][C]median[/C][C]-0.00046342[/C][C]-0.00042367[/C][C]-7.7259e-05[/C][C]-3.1904e-06[/C][C]0.00017094[/C][C]0.00035111[/C][C]0.00047175[/C][C]0.00024089[/C][C]0.0002482[/C][/ROW]
[ROW][C]midrange[/C][C]-0.0014016[/C][C]-0.0010794[/C][C]4.5911e-06[/C][C]0.00023271[/C][C]0.00031513[/C][C]0.0016109[/C][C]0.0019991[/C][C]0.00092331[/C][C]0.00031054[/C][/ROW]
[ROW][C]mode[/C][C]-0.0030908[/C][C]-0.0019098[/C][C]-0.00046797[/C][C]-5.6411e-07[/C][C]0.00050907[/C][C]0.0022401[/C][C]0.0030563[/C][C]0.0011575[/C][C]0.00097705[/C][/ROW]
[ROW][C]mode k.dens[/C][C]-0.00067246[/C][C]-0.00056747[/C][C]-0.00032953[/C][C]-9.2152e-05[/C][C]0.0002963[/C][C]0.00074027[/C][C]0.0010775[/C][C]0.00041378[/C][C]0.00062583[/C][/ROW]
[/TABLE]
Source: https://freestatistics.org/blog/index.php?pk=285969&T=1

Globally Unique Identifier (entire table): ba.freestatistics.org/blog/index.php?pk=285969&T=1

As an alternative you can also use a QR Code:  

The GUIDs for individual cells are displayed in the table below:

Estimation Results of Blocked Bootstrap
statisticP1P5Q1EstimateQ3P95P99S.D.IQR
mean-0.00043527-0.00028663-0.00010893-5.6411e-070.00012790.000286860.000436830.000183750.00023684
median-0.00046342-0.00042367-7.7259e-05-3.1904e-060.000170940.000351110.000471750.000240890.0002482
midrange-0.0014016-0.00107944.5911e-060.000232710.000315130.00161090.00199910.000923310.00031054
mode-0.0030908-0.0019098-0.00046797-5.6411e-070.000509070.00224010.00305630.00115750.00097705
mode k.dens-0.00067246-0.00056747-0.00032953-9.2152e-050.00029630.000740270.00107750.000413780.00062583


Parameters (Session):
par1 = 500 ; par2 = 12 ; par3 = 5 ; par4 = P1 P5 Q1 Q3 P95 P99 ;
Parameters (R input):
par1 = 500 ; par2 = 12 ; par3 = 5 ; par4 = P1 P5 Q1 Q3 P95 P99 ;
R code (references can be found in the software module):
par1 <- as.numeric(par1)
par2 <- as.numeric(par2)
par3 <- as.numeric(par3)
if (par1 < 10) par1 = 10
if (par1 > 5000) par1 = 5000
if (par2 < 3) par2 = 3
if (par2 > length(x)) par2 = length(x)
library(modeest)
library(lattice)
library(boot)
boot.stat <- function(s)
{
s.mean <- mean(s)
s.median <- median(s)
s.midrange <- (max(s) + min(s)) / 2
s.mode <- mlv(s,method='mfv')$M
s.kernelmode <- mlv(s, method='kernel')$M
c(s.mean, s.median, s.midrange, s.mode, s.kernelmode)
}
(r <- tsboot(x, boot.stat, R=par1, l=12, sim='fixed'))
bitmap(file='plot1.png')
plot(r$t[,1],type='p',ylab='simulated values',main='Simulation of Mean')
grid()
dev.off()
bitmap(file='plot2.png')
plot(r$t[,2],type='p',ylab='simulated values',main='Simulation of Median')
grid()
dev.off()
bitmap(file='plot3.png')
plot(r$t[,3],type='p',ylab='simulated values',main='Simulation of Midrange')
grid()
dev.off()
bitmap(file='plot7a.png')
plot(r$t[,4],type='p',ylab='simulated values',main='Simulation of Mode')
grid()
dev.off()
bitmap(file='plot8a.png')
plot(r$t[,5],type='p',ylab='simulated values',main='Simulation of Mode of Kernel Density')
grid()
dev.off()
bitmap(file='plot4.png')
densityplot(~r$t[,1],col='black',main='Density Plot',xlab='mean')
dev.off()
bitmap(file='plot5.png')
densityplot(~r$t[,2],col='black',main='Density Plot',xlab='median')
dev.off()
bitmap(file='plot6.png')
densityplot(~r$t[,3],col='black',main='Density Plot',xlab='midrange')
dev.off()
z <- data.frame(cbind(r$t[,1],r$t[,2],r$t[,3],r$t[,4],r$t[,5]) )
colnames(z) <- list('mean','median','midrange','mode','mode.k.dens')
bitmap(file='plot7.png')
boxplot(z,notch=TRUE,ylab='simulated values',main='Bootstrap Simulation - Central Tendency')
grid()
dev.off()
if (par4 == 'P1 P5 Q1 Q3 P95 P99') {
myq.1 <- 0.01
myq.2 <- 0.05
myq.3 <- 0.95
myq.4 <- 0.99
myl.1 <- 'P1'
myl.2 <- 'P5'
myl.3 <- 'P95'
myl.4 <- 'P99'
}
if (par4 == 'P0.5 P2.5 Q1 Q3 P97.5 P99.5') {
myq.1 <- 0.005
myq.2 <- 0.025
myq.3 <- 0.975
myq.4 <- 0.995
myl.1 <- 'P0.5'
myl.2 <- 'P2.5'
myl.3 <- 'P97.5'
myl.4 <- 'P99.5'
}
if (par4 == 'P10 P20 Q1 Q3 P80 P90') {
myq.1 <- 0.10
myq.2 <- 0.20
myq.3 <- 0.80
myq.4 <- 0.90
myl.1 <- 'P10'
myl.2 <- 'P20'
myl.3 <- 'P80'
myl.4 <- 'P90'
}
load(file='createtable')
a<-table.start()
a<-table.row.start(a)
a<-table.element(a,'Estimation Results of Blocked Bootstrap',10,TRUE)
a<-table.row.end(a)
a<-table.row.start(a)
a<-table.element(a,'statistic',header=TRUE)
a<-table.element(a,myl.1,header=TRUE)
a<-table.element(a,myl.2,header=TRUE)
a<-table.element(a,'Q1',header=TRUE)
a<-table.element(a,'Estimate',header=TRUE)
a<-table.element(a,'Q3',header=TRUE)
a<-table.element(a,myl.3,header=TRUE)
a<-table.element(a,myl.4,header=TRUE)
a<-table.element(a,'S.D.',header=TRUE)
a<-table.element(a,'IQR',header=TRUE)
a<-table.row.end(a)
a<-table.row.start(a)
a<-table.element(a,'mean',header=TRUE)
q1 <- quantile(r$t[,1],0.25)[[1]]
q3 <- quantile(r$t[,1],0.75)[[1]]
p01 <- quantile(r$t[,1],myq.1)[[1]]
p05 <- quantile(r$t[,1],myq.2)[[1]]
p95 <- quantile(r$t[,1],myq.3)[[1]]
p99 <- quantile(r$t[,1],myq.4)[[1]]
a<-table.element(a,signif(p01,par3))
a<-table.element(a,signif(p05,par3))
a<-table.element(a,signif(q1,par3))
a<-table.element(a,signif(r$t0[1],par3))
a<-table.element(a,signif(q3,par3))
a<-table.element(a,signif(p95,par3))
a<-table.element(a,signif(p99,par3))
a<-table.element( a,signif( sqrt(var(r$t[,1])),par3 ) )
a<-table.element(a,signif(q3-q1,par3))
a<-table.row.end(a)
a<-table.row.start(a)
a<-table.element(a,'median',header=TRUE)
q1 <- quantile(r$t[,2],0.25)[[1]]
q3 <- quantile(r$t[,2],0.75)[[1]]
p01 <- quantile(r$t[,2],myq.1)[[1]]
p05 <- quantile(r$t[,2],myq.2)[[1]]
p95 <- quantile(r$t[,2],myq.3)[[1]]
p99 <- quantile(r$t[,2],myq.4)[[1]]
a<-table.element(a,signif(p01,par3))
a<-table.element(a,signif(p05,par3))
a<-table.element(a,signif(q1,par3))
a<-table.element(a,signif(r$t0[2],par3))
a<-table.element(a,signif(q3,par3))
a<-table.element(a,signif(p95,par3))
a<-table.element(a,signif(p99,par3))
a<-table.element(a,signif(sqrt(var(r$t[,2])),par3))
a<-table.element(a,signif(q3-q1,par3))
a<-table.row.end(a)
a<-table.row.start(a)
a<-table.element(a,'midrange',header=TRUE)
q1 <- quantile(r$t[,3],0.25)[[1]]
q3 <- quantile(r$t[,3],0.75)[[1]]
p01 <- quantile(r$t[,3],myq.1)[[1]]
p05 <- quantile(r$t[,3],myq.2)[[1]]
p95 <- quantile(r$t[,3],myq.3)[[1]]
p99 <- quantile(r$t[,3],myq.4)[[1]]
a<-table.element(a,signif(p01,par3))
a<-table.element(a,signif(p05,par3))
a<-table.element(a,signif(q1,par3))
a<-table.element(a,signif(r$t0[3],par3))
a<-table.element(a,signif(q3,par3))
a<-table.element(a,signif(p95,par3))
a<-table.element(a,signif(p99,par3))
a<-table.element(a,signif(sqrt(var(r$t[,3])),par3))
a<-table.element(a,signif(q3-q1,par3))
a<-table.row.end(a)
a<-table.row.start(a)
a<-table.element(a,'mode',header=TRUE)
q1 <- quantile(r$t[,4],0.25)[[1]]
q3 <- quantile(r$t[,4],0.75)[[1]]
p01 <- quantile(r$t[,4],myq.1)[[1]]
p05 <- quantile(r$t[,4],myq.2)[[1]]
p95 <- quantile(r$t[,4],myq.3)[[1]]
p99 <- quantile(r$t[,4],myq.4)[[1]]
a<-table.element(a,signif(p01,par3))
a<-table.element(a,signif(p05,par3))
a<-table.element(a,signif(q1,par3))
a<-table.element(a,signif(r$t0[4],par3))
a<-table.element(a,signif(q3,par3))
a<-table.element(a,signif(p95,par3))
a<-table.element(a,signif(p99,par3))
a<-table.element(a,signif(sqrt(var(r$t[,4])),par3))
a<-table.element(a,signif(q3-q1,par3))
a<-table.row.end(a)
a<-table.row.start(a)
a<-table.element(a,'mode k.dens',header=TRUE)
q1 <- quantile(r$t[,5],0.25)[[1]]
q3 <- quantile(r$t[,5],0.75)[[1]]
p01 <- quantile(r$t[,5],myq.1)[[1]]
p05 <- quantile(r$t[,5],myq.2)[[1]]
p95 <- quantile(r$t[,5],myq.3)[[1]]
p99 <- quantile(r$t[,5],myq.4)[[1]]
a<-table.element(a,signif(p01,par3))
a<-table.element(a,signif(p05,par3))
a<-table.element(a,signif(q1,par3))
a<-table.element(a,signif(r$t0[5],par3))
a<-table.element(a,signif(q3,par3))
a<-table.element(a,signif(p95,par3))
a<-table.element(a,signif(p99,par3))
a<-table.element(a,signif(sqrt(var(r$t[,5])),par3))
a<-table.element(a,signif(q3-q1,par3))
a<-table.row.end(a)
a<-table.end(a)
table.save(a,file='mytable.tab')