Free Statistics

of Irreproducible Research!

Author's title

Author*The author of this computation has been verified*
R Software Modulerwasp_boxcoxnorm.wasp
Title produced by softwareBox-Cox Normality Plot
Date of computationFri, 11 Dec 2015 21:57:36 +0000
Cite this page as followsStatistical Computations at FreeStatistics.org, Office for Research Development and Education, URL https://freestatistics.org/blog/index.php?v=date/2015/Dec/11/t1449871067loyxsuof5r4tyhh.htm/, Retrieved Thu, 16 May 2024 15:31:37 +0000
Statistical Computations at FreeStatistics.org, Office for Research Development and Education, URL https://freestatistics.org/blog/index.php?pk=286040, Retrieved Thu, 16 May 2024 15:31:37 +0000
QR Codes:

Original text written by user:
IsPrivate?No (this computation is public)
User-defined keywords
Estimated Impact91
Family? (F = Feedback message, R = changed R code, M = changed R Module, P = changed Parameters, D = changed Data)
-     [Two-Way ANOVA] [] [2015-11-16 17:14:42] [32b17a345b130fdf5cc88718ed94a974]
- RMPD  [Exponential Smoothing] [] [2015-12-11 21:11:55] [0e2e3dbefef1c665f3752d42409bac25]
- RM D    [(Partial) Autocorrelation Function] [] [2015-12-11 21:47:51] [0e2e3dbefef1c665f3752d42409bac25]
- RM D        [Box-Cox Normality Plot] [] [2015-12-11 21:57:36] [074449c5cdcdb4dafd7dd3585d12ae02] [Current]
Feedback Forum

Post a new message
Dataseries X:
1.4
1.5
1.8
1.8
1.8
1.7
1.5
1.1
1.3
1.6
1.9
1.9
2
2.2
2.2
2
2.3
2.6
3.2
3.2
3.1
2.8
2.3
1.9
1.9
2
2
1.8
1.6
1.4
0.2
0.3
0.4
0.7
1
1.1
0.8
0.8
1
1.1
1
0.8
1.6
1.5
1.6
1.6
1.6
1.9
2
1.9
2
2.1
2.3
2.3
2.6
2.6
2.7
2.6
2.6
2.4
2.5
2.5
2.5
2.4
2.1
2.1
2.3
2.3
2.3
2.9
2.8
2.9
3
3
2.9
2.6
2.8
2.9
3.1
2.8
2.4
1.6
1.5
1.7


Summary of computational transaction
Raw Inputview raw input (R code)
Raw Outputview raw output of R engine
Computing time5 seconds
R Server'George Udny Yule' @ yule.wessa.net

\begin{tabular}{lllllllll}
\hline
Summary of computational transaction \tabularnewline
Raw Input & view raw input (R code)  \tabularnewline
Raw Output & view raw output of R engine  \tabularnewline
Computing time & 5 seconds \tabularnewline
R Server & 'George Udny Yule' @ yule.wessa.net \tabularnewline
\hline
\end{tabular}
%Source: https://freestatistics.org/blog/index.php?pk=286040&T=0

[TABLE]
[ROW][C]Summary of computational transaction[/C][/ROW]
[ROW][C]Raw Input[/C][C]view raw input (R code) [/C][/ROW]
[ROW][C]Raw Output[/C][C]view raw output of R engine [/C][/ROW]
[ROW][C]Computing time[/C][C]5 seconds[/C][/ROW]
[ROW][C]R Server[/C][C]'George Udny Yule' @ yule.wessa.net[/C][/ROW]
[/TABLE]
Source: https://freestatistics.org/blog/index.php?pk=286040&T=0

Globally Unique Identifier (entire table): ba.freestatistics.org/blog/index.php?pk=286040&T=0

As an alternative you can also use a QR Code:  

The GUIDs for individual cells are displayed in the table below:

Summary of computational transaction
Raw Inputview raw input (R code)
Raw Outputview raw output of R engine
Computing time5 seconds
R Server'George Udny Yule' @ yule.wessa.net


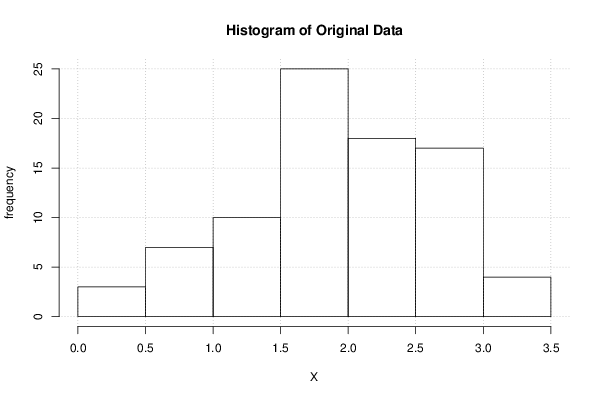
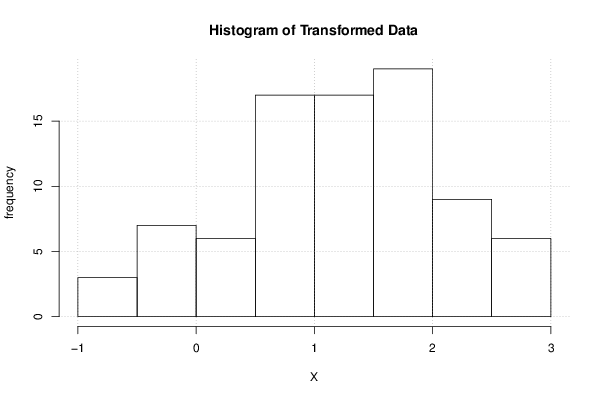
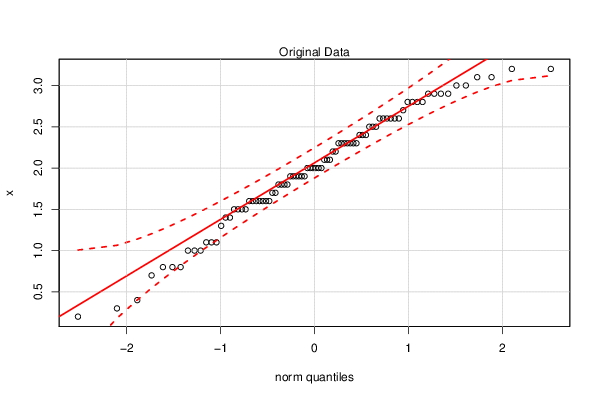
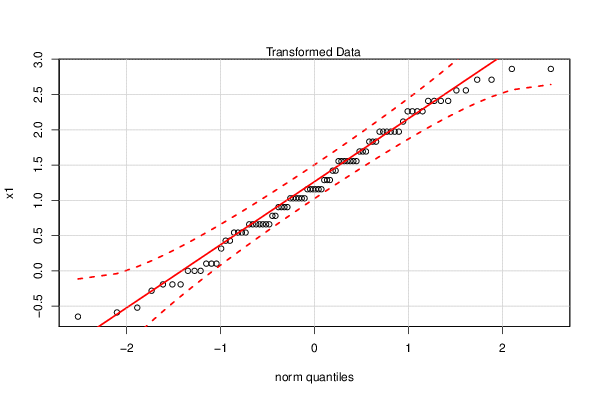
Box-Cox Normality Plot
# observations x84
maximum correlation0.992613173536299
optimal lambda1.37
transformation formulafor all lambda <> 0 : T(Y) = (Y^lambda - 1) / lambda

\begin{tabular}{lllllllll}
\hline
Box-Cox Normality Plot \tabularnewline
# observations x & 84 \tabularnewline
maximum correlation & 0.992613173536299 \tabularnewline
optimal lambda & 1.37 \tabularnewline
transformation formula & for all lambda <> 0 : T(Y) = (Y^lambda - 1) / lambda \tabularnewline
\hline
\end{tabular}
%Source: https://freestatistics.org/blog/index.php?pk=286040&T=1

[TABLE]
[ROW][C]Box-Cox Normality Plot[/C][/ROW]
[ROW][C]# observations x[/C][C]84[/C][/ROW]
[ROW][C]maximum correlation[/C][C]0.992613173536299[/C][/ROW]
[ROW][C]optimal lambda[/C][C]1.37[/C][/ROW]
[ROW][C]transformation formula[/C][C]for all lambda <> 0 : T(Y) = (Y^lambda - 1) / lambda[/C][/ROW]
[/TABLE]
Source: https://freestatistics.org/blog/index.php?pk=286040&T=1

Globally Unique Identifier (entire table): ba.freestatistics.org/blog/index.php?pk=286040&T=1

As an alternative you can also use a QR Code:  

The GUIDs for individual cells are displayed in the table below:

Box-Cox Normality Plot
# observations x84
maximum correlation0.992613173536299
optimal lambda1.37
transformation formulafor all lambda <> 0 : T(Y) = (Y^lambda - 1) / lambda


Obs.OriginalTransformed
11.40.427449977073897
21.50.542182380945475
31.80.903135337074741
41.80.903135337074741
51.80.903135337074741
61.70.780133866993087
71.50.542182380945475
81.10.101812654591103
91.30.31571211889867
101.60.65978179747346
111.91.02869241874922
121.91.02869241874922
1321.15671946078466
142.21.41987520549572
152.21.41987520549572
1621.15671946078466
172.31.55486445994355
182.61.97274236183518
193.22.8620612079205
203.22.8620612079205
213.12.70917417456483
222.82.26155183643942
232.31.55486445994355
241.91.02869241874922
251.91.02869241874922
2621.15671946078466
2721.15671946078466
281.80.903135337074741
291.60.65978179747346
301.40.427449977073897
310.2-0.649446533048873
320.3-0.589666452695153
330.4-0.521908669882174
340.7-0.282147980962377
3510
361.10.101812654591103
370.8-0.192260832928292
380.8-0.192260832928292
3910
401.10.101812654591103
4110
420.8-0.192260832928292
431.60.65978179747346
441.50.542182380945475
451.60.65978179747346
461.60.65978179747346
471.60.65978179747346
481.91.02869241874922
4921.15671946078466
501.91.02869241874922
5121.15671946078466
522.11.28713786745724
532.31.55486445994355
542.31.55486445994355
552.61.97274236183518
562.61.97274236183518
572.72.11615749031873
582.61.97274236183518
592.61.97274236183518
602.41.69204340864528
612.51.83135409224422
622.51.83135409224422
632.51.83135409224422
642.41.69204340864528
652.11.28713786745724
662.11.28713786745724
672.31.55486445994355
682.31.55486445994355
692.31.55486445994355
702.92.40888055272437
712.82.26155183643942
722.92.40888055272437
7332.55810133025798
7432.55810133025798
752.92.40888055272437
762.61.97274236183518
772.82.26155183643942
782.92.40888055272437
793.12.70917417456483
802.82.26155183643942
812.41.69204340864528
821.60.65978179747346
831.50.542182380945475
841.70.780133866993087

\begin{tabular}{lllllllll}
\hline
Obs. & Original & Transformed \tabularnewline
1 & 1.4 & 0.427449977073897 \tabularnewline
2 & 1.5 & 0.542182380945475 \tabularnewline
3 & 1.8 & 0.903135337074741 \tabularnewline
4 & 1.8 & 0.903135337074741 \tabularnewline
5 & 1.8 & 0.903135337074741 \tabularnewline
6 & 1.7 & 0.780133866993087 \tabularnewline
7 & 1.5 & 0.542182380945475 \tabularnewline
8 & 1.1 & 0.101812654591103 \tabularnewline
9 & 1.3 & 0.31571211889867 \tabularnewline
10 & 1.6 & 0.65978179747346 \tabularnewline
11 & 1.9 & 1.02869241874922 \tabularnewline
12 & 1.9 & 1.02869241874922 \tabularnewline
13 & 2 & 1.15671946078466 \tabularnewline
14 & 2.2 & 1.41987520549572 \tabularnewline
15 & 2.2 & 1.41987520549572 \tabularnewline
16 & 2 & 1.15671946078466 \tabularnewline
17 & 2.3 & 1.55486445994355 \tabularnewline
18 & 2.6 & 1.97274236183518 \tabularnewline
19 & 3.2 & 2.8620612079205 \tabularnewline
20 & 3.2 & 2.8620612079205 \tabularnewline
21 & 3.1 & 2.70917417456483 \tabularnewline
22 & 2.8 & 2.26155183643942 \tabularnewline
23 & 2.3 & 1.55486445994355 \tabularnewline
24 & 1.9 & 1.02869241874922 \tabularnewline
25 & 1.9 & 1.02869241874922 \tabularnewline
26 & 2 & 1.15671946078466 \tabularnewline
27 & 2 & 1.15671946078466 \tabularnewline
28 & 1.8 & 0.903135337074741 \tabularnewline
29 & 1.6 & 0.65978179747346 \tabularnewline
30 & 1.4 & 0.427449977073897 \tabularnewline
31 & 0.2 & -0.649446533048873 \tabularnewline
32 & 0.3 & -0.589666452695153 \tabularnewline
33 & 0.4 & -0.521908669882174 \tabularnewline
34 & 0.7 & -0.282147980962377 \tabularnewline
35 & 1 & 0 \tabularnewline
36 & 1.1 & 0.101812654591103 \tabularnewline
37 & 0.8 & -0.192260832928292 \tabularnewline
38 & 0.8 & -0.192260832928292 \tabularnewline
39 & 1 & 0 \tabularnewline
40 & 1.1 & 0.101812654591103 \tabularnewline
41 & 1 & 0 \tabularnewline
42 & 0.8 & -0.192260832928292 \tabularnewline
43 & 1.6 & 0.65978179747346 \tabularnewline
44 & 1.5 & 0.542182380945475 \tabularnewline
45 & 1.6 & 0.65978179747346 \tabularnewline
46 & 1.6 & 0.65978179747346 \tabularnewline
47 & 1.6 & 0.65978179747346 \tabularnewline
48 & 1.9 & 1.02869241874922 \tabularnewline
49 & 2 & 1.15671946078466 \tabularnewline
50 & 1.9 & 1.02869241874922 \tabularnewline
51 & 2 & 1.15671946078466 \tabularnewline
52 & 2.1 & 1.28713786745724 \tabularnewline
53 & 2.3 & 1.55486445994355 \tabularnewline
54 & 2.3 & 1.55486445994355 \tabularnewline
55 & 2.6 & 1.97274236183518 \tabularnewline
56 & 2.6 & 1.97274236183518 \tabularnewline
57 & 2.7 & 2.11615749031873 \tabularnewline
58 & 2.6 & 1.97274236183518 \tabularnewline
59 & 2.6 & 1.97274236183518 \tabularnewline
60 & 2.4 & 1.69204340864528 \tabularnewline
61 & 2.5 & 1.83135409224422 \tabularnewline
62 & 2.5 & 1.83135409224422 \tabularnewline
63 & 2.5 & 1.83135409224422 \tabularnewline
64 & 2.4 & 1.69204340864528 \tabularnewline
65 & 2.1 & 1.28713786745724 \tabularnewline
66 & 2.1 & 1.28713786745724 \tabularnewline
67 & 2.3 & 1.55486445994355 \tabularnewline
68 & 2.3 & 1.55486445994355 \tabularnewline
69 & 2.3 & 1.55486445994355 \tabularnewline
70 & 2.9 & 2.40888055272437 \tabularnewline
71 & 2.8 & 2.26155183643942 \tabularnewline
72 & 2.9 & 2.40888055272437 \tabularnewline
73 & 3 & 2.55810133025798 \tabularnewline
74 & 3 & 2.55810133025798 \tabularnewline
75 & 2.9 & 2.40888055272437 \tabularnewline
76 & 2.6 & 1.97274236183518 \tabularnewline
77 & 2.8 & 2.26155183643942 \tabularnewline
78 & 2.9 & 2.40888055272437 \tabularnewline
79 & 3.1 & 2.70917417456483 \tabularnewline
80 & 2.8 & 2.26155183643942 \tabularnewline
81 & 2.4 & 1.69204340864528 \tabularnewline
82 & 1.6 & 0.65978179747346 \tabularnewline
83 & 1.5 & 0.542182380945475 \tabularnewline
84 & 1.7 & 0.780133866993087 \tabularnewline
\hline
\end{tabular}
%Source: https://freestatistics.org/blog/index.php?pk=286040&T=2

[TABLE]
[ROW][C]Obs.[/C][C]Original[/C][C]Transformed[/C][/ROW]
[ROW][C]1[/C][C]1.4[/C][C]0.427449977073897[/C][/ROW]
[ROW][C]2[/C][C]1.5[/C][C]0.542182380945475[/C][/ROW]
[ROW][C]3[/C][C]1.8[/C][C]0.903135337074741[/C][/ROW]
[ROW][C]4[/C][C]1.8[/C][C]0.903135337074741[/C][/ROW]
[ROW][C]5[/C][C]1.8[/C][C]0.903135337074741[/C][/ROW]
[ROW][C]6[/C][C]1.7[/C][C]0.780133866993087[/C][/ROW]
[ROW][C]7[/C][C]1.5[/C][C]0.542182380945475[/C][/ROW]
[ROW][C]8[/C][C]1.1[/C][C]0.101812654591103[/C][/ROW]
[ROW][C]9[/C][C]1.3[/C][C]0.31571211889867[/C][/ROW]
[ROW][C]10[/C][C]1.6[/C][C]0.65978179747346[/C][/ROW]
[ROW][C]11[/C][C]1.9[/C][C]1.02869241874922[/C][/ROW]
[ROW][C]12[/C][C]1.9[/C][C]1.02869241874922[/C][/ROW]
[ROW][C]13[/C][C]2[/C][C]1.15671946078466[/C][/ROW]
[ROW][C]14[/C][C]2.2[/C][C]1.41987520549572[/C][/ROW]
[ROW][C]15[/C][C]2.2[/C][C]1.41987520549572[/C][/ROW]
[ROW][C]16[/C][C]2[/C][C]1.15671946078466[/C][/ROW]
[ROW][C]17[/C][C]2.3[/C][C]1.55486445994355[/C][/ROW]
[ROW][C]18[/C][C]2.6[/C][C]1.97274236183518[/C][/ROW]
[ROW][C]19[/C][C]3.2[/C][C]2.8620612079205[/C][/ROW]
[ROW][C]20[/C][C]3.2[/C][C]2.8620612079205[/C][/ROW]
[ROW][C]21[/C][C]3.1[/C][C]2.70917417456483[/C][/ROW]
[ROW][C]22[/C][C]2.8[/C][C]2.26155183643942[/C][/ROW]
[ROW][C]23[/C][C]2.3[/C][C]1.55486445994355[/C][/ROW]
[ROW][C]24[/C][C]1.9[/C][C]1.02869241874922[/C][/ROW]
[ROW][C]25[/C][C]1.9[/C][C]1.02869241874922[/C][/ROW]
[ROW][C]26[/C][C]2[/C][C]1.15671946078466[/C][/ROW]
[ROW][C]27[/C][C]2[/C][C]1.15671946078466[/C][/ROW]
[ROW][C]28[/C][C]1.8[/C][C]0.903135337074741[/C][/ROW]
[ROW][C]29[/C][C]1.6[/C][C]0.65978179747346[/C][/ROW]
[ROW][C]30[/C][C]1.4[/C][C]0.427449977073897[/C][/ROW]
[ROW][C]31[/C][C]0.2[/C][C]-0.649446533048873[/C][/ROW]
[ROW][C]32[/C][C]0.3[/C][C]-0.589666452695153[/C][/ROW]
[ROW][C]33[/C][C]0.4[/C][C]-0.521908669882174[/C][/ROW]
[ROW][C]34[/C][C]0.7[/C][C]-0.282147980962377[/C][/ROW]
[ROW][C]35[/C][C]1[/C][C]0[/C][/ROW]
[ROW][C]36[/C][C]1.1[/C][C]0.101812654591103[/C][/ROW]
[ROW][C]37[/C][C]0.8[/C][C]-0.192260832928292[/C][/ROW]
[ROW][C]38[/C][C]0.8[/C][C]-0.192260832928292[/C][/ROW]
[ROW][C]39[/C][C]1[/C][C]0[/C][/ROW]
[ROW][C]40[/C][C]1.1[/C][C]0.101812654591103[/C][/ROW]
[ROW][C]41[/C][C]1[/C][C]0[/C][/ROW]
[ROW][C]42[/C][C]0.8[/C][C]-0.192260832928292[/C][/ROW]
[ROW][C]43[/C][C]1.6[/C][C]0.65978179747346[/C][/ROW]
[ROW][C]44[/C][C]1.5[/C][C]0.542182380945475[/C][/ROW]
[ROW][C]45[/C][C]1.6[/C][C]0.65978179747346[/C][/ROW]
[ROW][C]46[/C][C]1.6[/C][C]0.65978179747346[/C][/ROW]
[ROW][C]47[/C][C]1.6[/C][C]0.65978179747346[/C][/ROW]
[ROW][C]48[/C][C]1.9[/C][C]1.02869241874922[/C][/ROW]
[ROW][C]49[/C][C]2[/C][C]1.15671946078466[/C][/ROW]
[ROW][C]50[/C][C]1.9[/C][C]1.02869241874922[/C][/ROW]
[ROW][C]51[/C][C]2[/C][C]1.15671946078466[/C][/ROW]
[ROW][C]52[/C][C]2.1[/C][C]1.28713786745724[/C][/ROW]
[ROW][C]53[/C][C]2.3[/C][C]1.55486445994355[/C][/ROW]
[ROW][C]54[/C][C]2.3[/C][C]1.55486445994355[/C][/ROW]
[ROW][C]55[/C][C]2.6[/C][C]1.97274236183518[/C][/ROW]
[ROW][C]56[/C][C]2.6[/C][C]1.97274236183518[/C][/ROW]
[ROW][C]57[/C][C]2.7[/C][C]2.11615749031873[/C][/ROW]
[ROW][C]58[/C][C]2.6[/C][C]1.97274236183518[/C][/ROW]
[ROW][C]59[/C][C]2.6[/C][C]1.97274236183518[/C][/ROW]
[ROW][C]60[/C][C]2.4[/C][C]1.69204340864528[/C][/ROW]
[ROW][C]61[/C][C]2.5[/C][C]1.83135409224422[/C][/ROW]
[ROW][C]62[/C][C]2.5[/C][C]1.83135409224422[/C][/ROW]
[ROW][C]63[/C][C]2.5[/C][C]1.83135409224422[/C][/ROW]
[ROW][C]64[/C][C]2.4[/C][C]1.69204340864528[/C][/ROW]
[ROW][C]65[/C][C]2.1[/C][C]1.28713786745724[/C][/ROW]
[ROW][C]66[/C][C]2.1[/C][C]1.28713786745724[/C][/ROW]
[ROW][C]67[/C][C]2.3[/C][C]1.55486445994355[/C][/ROW]
[ROW][C]68[/C][C]2.3[/C][C]1.55486445994355[/C][/ROW]
[ROW][C]69[/C][C]2.3[/C][C]1.55486445994355[/C][/ROW]
[ROW][C]70[/C][C]2.9[/C][C]2.40888055272437[/C][/ROW]
[ROW][C]71[/C][C]2.8[/C][C]2.26155183643942[/C][/ROW]
[ROW][C]72[/C][C]2.9[/C][C]2.40888055272437[/C][/ROW]
[ROW][C]73[/C][C]3[/C][C]2.55810133025798[/C][/ROW]
[ROW][C]74[/C][C]3[/C][C]2.55810133025798[/C][/ROW]
[ROW][C]75[/C][C]2.9[/C][C]2.40888055272437[/C][/ROW]
[ROW][C]76[/C][C]2.6[/C][C]1.97274236183518[/C][/ROW]
[ROW][C]77[/C][C]2.8[/C][C]2.26155183643942[/C][/ROW]
[ROW][C]78[/C][C]2.9[/C][C]2.40888055272437[/C][/ROW]
[ROW][C]79[/C][C]3.1[/C][C]2.70917417456483[/C][/ROW]
[ROW][C]80[/C][C]2.8[/C][C]2.26155183643942[/C][/ROW]
[ROW][C]81[/C][C]2.4[/C][C]1.69204340864528[/C][/ROW]
[ROW][C]82[/C][C]1.6[/C][C]0.65978179747346[/C][/ROW]
[ROW][C]83[/C][C]1.5[/C][C]0.542182380945475[/C][/ROW]
[ROW][C]84[/C][C]1.7[/C][C]0.780133866993087[/C][/ROW]
[/TABLE]
Source: https://freestatistics.org/blog/index.php?pk=286040&T=2

Globally Unique Identifier (entire table): ba.freestatistics.org/blog/index.php?pk=286040&T=2

As an alternative you can also use a QR Code:  

The GUIDs for individual cells are displayed in the table below:

Obs.OriginalTransformed
11.40.427449977073897
21.50.542182380945475
31.80.903135337074741
41.80.903135337074741
51.80.903135337074741
61.70.780133866993087
71.50.542182380945475
81.10.101812654591103
91.30.31571211889867
101.60.65978179747346
111.91.02869241874922
121.91.02869241874922
1321.15671946078466
142.21.41987520549572
152.21.41987520549572
1621.15671946078466
172.31.55486445994355
182.61.97274236183518
193.22.8620612079205
203.22.8620612079205
213.12.70917417456483
222.82.26155183643942
232.31.55486445994355
241.91.02869241874922
251.91.02869241874922
2621.15671946078466
2721.15671946078466
281.80.903135337074741
291.60.65978179747346
301.40.427449977073897
310.2-0.649446533048873
320.3-0.589666452695153
330.4-0.521908669882174
340.7-0.282147980962377
3510
361.10.101812654591103
370.8-0.192260832928292
380.8-0.192260832928292
3910
401.10.101812654591103
4110
420.8-0.192260832928292
431.60.65978179747346
441.50.542182380945475
451.60.65978179747346
461.60.65978179747346
471.60.65978179747346
481.91.02869241874922
4921.15671946078466
501.91.02869241874922
5121.15671946078466
522.11.28713786745724
532.31.55486445994355
542.31.55486445994355
552.61.97274236183518
562.61.97274236183518
572.72.11615749031873
582.61.97274236183518
592.61.97274236183518
602.41.69204340864528
612.51.83135409224422
622.51.83135409224422
632.51.83135409224422
642.41.69204340864528
652.11.28713786745724
662.11.28713786745724
672.31.55486445994355
682.31.55486445994355
692.31.55486445994355
702.92.40888055272437
712.82.26155183643942
722.92.40888055272437
7332.55810133025798
7432.55810133025798
752.92.40888055272437
762.61.97274236183518
772.82.26155183643942
782.92.40888055272437
793.12.70917417456483
802.82.26155183643942
812.41.69204340864528
821.60.65978179747346
831.50.542182380945475
841.70.780133866993087


Maximum Likelihood Estimation of Lambda
> summary(mypT)
bcPower Transformation to Normality 
  Est.Power Std.Err. Wald Lower Bound Wald Upper Bound
x    1.2483   0.2299           0.7977           1.6988
Likelihood ratio tests about transformation parameters
                            LRT df         pval
LR test, lambda = (0) 43.569629  1 4.091394e-11
LR test, lambda = (1)  1.251589  1 2.632493e-01

\begin{tabular}{lllllllll}
\hline
Maximum Likelihood Estimation of Lambda \tabularnewline
> summary(mypT)
bcPower Transformation to Normality 
  Est.Power Std.Err. Wald Lower Bound Wald Upper Bound
x    1.2483   0.2299           0.7977           1.6988
Likelihood ratio tests about transformation parameters
                            LRT df         pval
LR test, lambda = (0) 43.569629  1 4.091394e-11
LR test, lambda = (1)  1.251589  1 2.632493e-01
\tabularnewline \hline \end{tabular} %Source: https://freestatistics.org/blog/index.php?pk=286040&T=3

[TABLE]
[ROW][C]Maximum Likelihood Estimation of Lambda[/C][/ROW]
[ROW][C]
> summary(mypT)
bcPower Transformation to Normality 
  Est.Power Std.Err. Wald Lower Bound Wald Upper Bound
x    1.2483   0.2299           0.7977           1.6988
Likelihood ratio tests about transformation parameters
                            LRT df         pval
LR test, lambda = (0) 43.569629  1 4.091394e-11
LR test, lambda = (1)  1.251589  1 2.632493e-01
[/C][/ROW] [/TABLE] Source: https://freestatistics.org/blog/index.php?pk=286040&T=3

Globally Unique Identifier (entire table): ba.freestatistics.org/blog/index.php?pk=286040&T=3

As an alternative you can also use a QR Code:  

The GUIDs for individual cells are displayed in the table below:

Maximum Likelihood Estimation of Lambda
> summary(mypT)
bcPower Transformation to Normality 
  Est.Power Std.Err. Wald Lower Bound Wald Upper Bound
x    1.2483   0.2299           0.7977           1.6988
Likelihood ratio tests about transformation parameters
                            LRT df         pval
LR test, lambda = (0) 43.569629  1 4.091394e-11
LR test, lambda = (1)  1.251589  1 2.632493e-01


Parameters (Session):
Parameters (R input):
par1 = Full Box-Cox transform ; par2 = -8 ; par3 = 8 ; par4 = 0 ; par5 = Yes ;
R code (references can be found in the software module):
library(car)
par2 <- abs(as.numeric(par2)*100)
par3 <- as.numeric(par3)*100
if(par4=='') par4 <- 0
par4 <- as.numeric(par4)
numlam <- par2 + par3 + 1
x <- x + par4
n <- length(x)
c <- array(NA,dim=c(numlam))
l <- array(NA,dim=c(numlam))
mx <- -1
mxli <- -999
for (i in 1:numlam)
{
l[i] <- (i-par2-1)/100
if (l[i] != 0)
{
if (par1 == 'Full Box-Cox transform') x1 <- (x^l[i] - 1) / l[i]
if (par1 == 'Simple Box-Cox transform') x1 <- x^l[i]
} else {
x1 <- log(x)
}
c[i] <- cor(qnorm(ppoints(x), mean=0, sd=1),sort(x1))
if (mx < c[i])
{
mx <- c[i]
mxli <- l[i]
x1.best <- x1
}
}
c
mx
mxli
x1.best
if (mxli != 0)
{
if (par1 == 'Full Box-Cox transform') x1 <- (x^mxli - 1) / mxli
if (par1 == 'Simple Box-Cox transform') x1 <- x^mxli
} else {
x1 <- log(x)
}
mypT <- powerTransform(x)
summary(mypT)
bitmap(file='test1.png')
plot(l,c,main='Box-Cox Normality Plot', xlab='Lambda',ylab='correlation')
mtext(paste('Optimal Lambda =',mxli))
grid()
dev.off()
bitmap(file='test2.png')
hist(x,main='Histogram of Original Data',xlab='X',ylab='frequency')
grid()
dev.off()
bitmap(file='test3.png')
hist(x1,main='Histogram of Transformed Data', xlab='X',ylab='frequency')
grid()
dev.off()
bitmap(file='test4.png')
qqPlot(x)
grid()
mtext('Original Data')
dev.off()
bitmap(file='test5.png')
qqPlot(x1)
grid()
mtext('Transformed Data')
dev.off()
load(file='createtable')
a<-table.start()
a<-table.row.start(a)
a<-table.element(a,'Box-Cox Normality Plot',2,TRUE)
a<-table.row.end(a)
a<-table.row.start(a)
a<-table.element(a,'# observations x',header=TRUE)
a<-table.element(a,n)
a<-table.row.end(a)
a<-table.row.start(a)
a<-table.element(a,'maximum correlation',header=TRUE)
a<-table.element(a,mx)
a<-table.row.end(a)
a<-table.row.start(a)
a<-table.element(a,'optimal lambda',header=TRUE)
a<-table.element(a,mxli)
a<-table.row.end(a)
a<-table.row.start(a)
a<-table.element(a,'transformation formula',header=TRUE)
if (par1 == 'Full Box-Cox transform') {
a<-table.element(a,'for all lambda <> 0 : T(Y) = (Y^lambda - 1) / lambda')
} else {
a<-table.element(a,'for all lambda <> 0 : T(Y) = Y^lambda')
}
a<-table.row.end(a)
if(mx<0) {
a<-table.row.start(a)
a<-table.element(a,'Warning: maximum correlation is negative! The Box-Cox transformation must not be used.',2)
a<-table.row.end(a)
}
a<-table.end(a)
table.save(a,file='mytable.tab')
if(par5=='Yes') {
a<-table.start()
a<-table.row.start(a)
a<-table.element(a,'Obs.',header=T)
a<-table.element(a,'Original',header=T)
a<-table.element(a,'Transformed',header=T)
a<-table.row.end(a)
for (i in 1:n) {
a<-table.row.start(a)
a<-table.element(a,i)
a<-table.element(a,x[i])
a<-table.element(a,x1.best[i])
a<-table.row.end(a)
}
a<-table.end(a)
table.save(a,file='mytable1.tab')
}
a<-table.start()
a<-table.row.start(a)
a<-table.element(a,'Maximum Likelihood Estimation of Lambda',1,TRUE)
a<-table.row.end(a)
a<-table.row.start(a)
a<-table.element(a,paste('
',RC.texteval('summary(mypT)'),'
',sep=''))
a<-table.row.end(a)
a<-table.end(a)
table.save(a,file='mytable3.tab')