Free Statistics
of Irreproducible Research!
Description of Statistical Computation | |||||||||||||||||||||||||||||||||||||||
|---|---|---|---|---|---|---|---|---|---|---|---|---|---|---|---|---|---|---|---|---|---|---|---|---|---|---|---|---|---|---|---|---|---|---|---|---|---|---|---|
| Author's title | |||||||||||||||||||||||||||||||||||||||
| Author | *The author of this computation has been verified* | ||||||||||||||||||||||||||||||||||||||
| R Software Module | rwasp_fitdistrnorm.wasp | ||||||||||||||||||||||||||||||||||||||
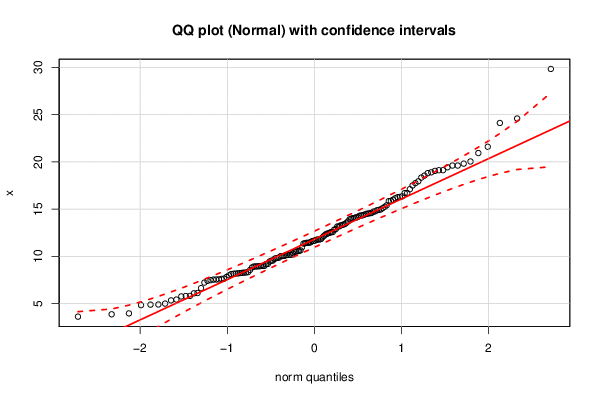
| Title produced by software | ML Fitting and QQ Plot- Normal Distribution | ||||||||||||||||||||||||||||||||||||||
| Date of computation | Sat, 12 Dec 2015 11:25:04 +0000 | ||||||||||||||||||||||||||||||||||||||
| Cite this page as follows | Statistical Computations at FreeStatistics.org, Office for Research Development and Education, URL https://freestatistics.org/blog/index.php?v=date/2015/Dec/12/t1449919546ccwtpstp9jn23nx.htm/, Retrieved Thu, 16 May 2024 17:39:24 +0000 | ||||||||||||||||||||||||||||||||||||||
| Statistical Computations at FreeStatistics.org, Office for Research Development and Education, URL https://freestatistics.org/blog/index.php?pk=286055, Retrieved Thu, 16 May 2024 17:39:24 +0000 | |||||||||||||||||||||||||||||||||||||||
| QR Codes: | |||||||||||||||||||||||||||||||||||||||
|
| |||||||||||||||||||||||||||||||||||||||
| Original text written by user: | |||||||||||||||||||||||||||||||||||||||
| IsPrivate? | No (this computation is public) | ||||||||||||||||||||||||||||||||||||||
| User-defined keywords | |||||||||||||||||||||||||||||||||||||||
| Estimated Impact | 91 | ||||||||||||||||||||||||||||||||||||||
Tree of Dependent Computations | |||||||||||||||||||||||||||||||||||||||
| Family? (F = Feedback message, R = changed R code, M = changed R Module, P = changed Parameters, D = changed Data) | |||||||||||||||||||||||||||||||||||||||
| - [ML Fitting and QQ Plot- Normal Distribution] [t4 h3] [2015-12-12 11:25:04] [a3c9582f1a47633c0b9d0c2ac629e9ce] [Current] | |||||||||||||||||||||||||||||||||||||||
| Feedback Forum | |||||||||||||||||||||||||||||||||||||||
Post a new message | |||||||||||||||||||||||||||||||||||||||
Dataset | |||||||||||||||||||||||||||||||||||||||
| Dataseries X: | |||||||||||||||||||||||||||||||||||||||
15.41476056 6.650648762 11.45819478 20.05069636 10.19271009 14.5734109 14.2922178 12.88458206 18.90378557 14.73749173 14.41740208 8.212692268 8.961032717 5.773379111 11.3613924 11.39345073 7.552213029 9.008089235 16.70271231 13.97682729 14.50209207 12.39689421 10.527181 10.04723258 4.918247324 19.12995825 13.42618965 14.07856088 13.16518896 9.008710278 29.84032079 10.97467472 6.098914768 13.26478526 3.97574219 16.27240585 7.234440234 12.57461265 11.8015315 11.44038449 5.816648937 19.62094874 8.292784878 21.6090806 7.648528714 9.565075321 8.193016497 13.16605121 7.825361991 9.184193348 13.69867021 8.006524215 9.846874576 3.632968119 16.70996402 15.25554628 13.56377475 11.79659411 11.63636591 12.51428947 11.64398646 16.16332697 17.7581236 12.30972154 3.885472083 5.01372146 13.9253049 16.36138118 24.12374756 10.15647907 10.64942473 11.44834177 10.18000366 8.933131346 5.825103332 9.457448323 14.59495968 14.5304523 19.12689097 10.55772642 18.55389137 17.51328284 17.9515454 16.29813549 14.975293 10.31946532 9.753708439 14.06195556 10.0519918 8.347517679 14.35889834 16.00691133 8.305898421 9.816238478 13.37499419 12.01595005 12.45825221 4.852503009 8.836779565 11.50798977 12.58339021 8.171492461 15.85820497 8.962697258 18.81714881 5.351970198 13.32215154 8.98981509 14.76626088 10.04456152 10.48837009 14.12768758 8.569785537 9.212731276 6.136692647 9.54200998 8.263908186 8.141896705 5.44217752 14.33811186 19.82212408 7.573084448 10.58392756 9.888537128 15.88228309 18.34456066 17.11746184 8.939946033 7.632129344 8.24475525 10.11729856 14.92696627 4.903136735 10.17387715 11.69284388 7.564961763 24.59523603 11.84898569 12.17394968 12.83605764 14.16669857 19.05430534 11.76780917 19.43732627 19.62008295 20.94263869 15.11367887 7.49484645 7.42193167 14.88509175 | |||||||||||||||||||||||||||||||||||||||
Tables (Output of Computation) | |||||||||||||||||||||||||||||||||||||||
| |||||||||||||||||||||||||||||||||||||||
Figures (Output of Computation) | |||||||||||||||||||||||||||||||||||||||
Input Parameters & R Code | |||||||||||||||||||||||||||||||||||||||
| Parameters (Session): | |||||||||||||||||||||||||||||||||||||||
| par1 = 8 ; par2 = 0 ; | |||||||||||||||||||||||||||||||||||||||
| Parameters (R input): | |||||||||||||||||||||||||||||||||||||||
| par1 = 8 ; par2 = 0 ; | |||||||||||||||||||||||||||||||||||||||
| R code (references can be found in the software module): | |||||||||||||||||||||||||||||||||||||||
par2 <- '0' | |||||||||||||||||||||||||||||||||||||||