Free Statistics

of Irreproducible Research!

Author's title

Author*The author of this computation has been verified*
R Software Modulerwasp_Simple Regression Y ~ X.wasp
Title produced by softwareSimple Linear Regression
Date of computationSat, 12 Dec 2015 11:38:48 +0000
Cite this page as followsStatistical Computations at FreeStatistics.org, Office for Research Development and Education, URL https://freestatistics.org/blog/index.php?v=date/2015/Dec/12/t1449920360tprykm3npvsna88.htm/, Retrieved Thu, 16 May 2024 14:02:23 +0000
Statistical Computations at FreeStatistics.org, Office for Research Development and Education, URL https://freestatistics.org/blog/index.php?pk=286057, Retrieved Thu, 16 May 2024 14:02:23 +0000
QR Codes:

Original text written by user:
IsPrivate?No (this computation is public)
User-defined keywords
Estimated Impact84
Family? (F = Feedback message, R = changed R code, M = changed R Module, P = changed Parameters, D = changed Data)
-       [Simple Linear Regression] [Simple linear reg...] [2015-12-12 11:38:48] [b6628d6ea1d7803ffc2dc825d38ead4a] [Current]
Feedback Forum

Post a new message
Dataseries X:
421 0.458
493 0.714
515 0.715
NA 0.831
398 0.521
400 0.772
598 0.804
477 0.724
597 0.928
573 0.879
532 0.743
433 0.789
384 0.812
501 0.549
517 0.78
556 0.784
578 0.88
423 0.717
464 0.471
449 0.471
407 0.579
474 0.579
494 0.729
450 0.678
554 0.74
534 0.846
582 0.774
433 0.376
413 0.384
403 0.575
442 0.498
563 0.9
NA 0.631
NA 0.361
NA 0.365
551 0.815
592 0.71
498 0.71
580 0.483
438 0.549
524 0.758
489 0.812
483 0.819
547 0.85
568 0.861
545 0.899
NA 0.461
411 0.718
435 0.695
NA 0.695
468 0.705
471 0.679
499 0.657
NA 0.553
355 0.377
552 0.836
444 0.422
448 0.722
510 0.879
564 0.882
395 0.666
397 0.436
524 0.736
565 0.908
444 0.566
529 0.854
367 0.747
500 0.62
390 0.387
NA 0.402
468 0.632
408 0.466
466 0.615
583 0.817
545 0.89
581 0.581
516 0.678
519 0.678
390 0.639
563 0.9
485 0.885
563 0.872
453 0.872
444 0.714
541 0.887
433 0.744
479 0.75
432 0.527
NA 0.599
NA 0.886
579 0.886
385 0.81
529 0.618
404 0.618
581 0.804
488 0.764
483 0.476
323 0.402
326 0.753
NA 0.887
557 0.828
537 0.881
475 0.881
533 0.495
420 0.411
553 0.768
NA 0.692
405 0.405
578 0.823
NA 0.823
NA 0.475
576 0.759
499 0.752
NA 0.752
544 0.627
621 0.656
469 0.682
NA 0.787
515 0.612
347 0.384
441 0.517
395 0.616
NA 0.616
472 0.533
540 0.914
602 0.904
465 0.608
344 0.328
437 0.496
509 0.941
323 0.781
508 0.531
NA 0.77
411 0.679
453 0.757
NA 0.484
534 0.672
540 0.727
525 0.652
540 0.83
538 0.819
431 0.843
318 0.843
572 0.782
556 0.782
373 0.463
360 0.745
448 0.718
NA 0.69
NA 0.69
330 0.825
461 0.483
NA 0.744
509 0.744
NA 0.749
389 0.36
593 0.896
570 0.827
573 0.874
362 0.494
474 0.646
NA 0.646
576 0.868
492 0.74
427 0.74
420 0.468
NA 0.701
419 0.53
515 0.896
558 0.914
453 0.662
538 0.662
362 0.6
392 0.6
495 0.716
424 0.467
484 0.702
488 0.764
541 0.716
543 0.752
481 0.69
389 0.477
539 0.73
376 0.824
584 0.891
531 0.911
589 0.783
506 0.653
NA 0.618
490 0.618
518 0.632
367 0.497
416 0.543
493 0.473


Summary of computational transaction
Raw Inputview raw input (R code)
Raw Outputview raw output of R engine
Computing time6 seconds
R Server'Gertrude Mary Cox' @ cox.wessa.net

\begin{tabular}{lllllllll}
\hline
Summary of computational transaction \tabularnewline
Raw Input & view raw input (R code)  \tabularnewline
Raw Output & view raw output of R engine  \tabularnewline
Computing time & 6 seconds \tabularnewline
R Server & 'Gertrude Mary Cox' @ cox.wessa.net \tabularnewline
\hline
\end{tabular}
%Source: https://freestatistics.org/blog/index.php?pk=286057&T=0

[TABLE]
[ROW][C]Summary of computational transaction[/C][/ROW]
[ROW][C]Raw Input[/C][C]view raw input (R code) [/C][/ROW]
[ROW][C]Raw Output[/C][C]view raw output of R engine [/C][/ROW]
[ROW][C]Computing time[/C][C]6 seconds[/C][/ROW]
[ROW][C]R Server[/C][C]'Gertrude Mary Cox' @ cox.wessa.net[/C][/ROW]
[/TABLE]
Source: https://freestatistics.org/blog/index.php?pk=286057&T=0

Globally Unique Identifier (entire table): ba.freestatistics.org/blog/index.php?pk=286057&T=0

As an alternative you can also use a QR Code:  

The GUIDs for individual cells are displayed in the table below:

Summary of computational transaction
Raw Inputview raw input (R code)
Raw Outputview raw output of R engine
Computing time6 seconds
R Server'Gertrude Mary Cox' @ cox.wessa.net


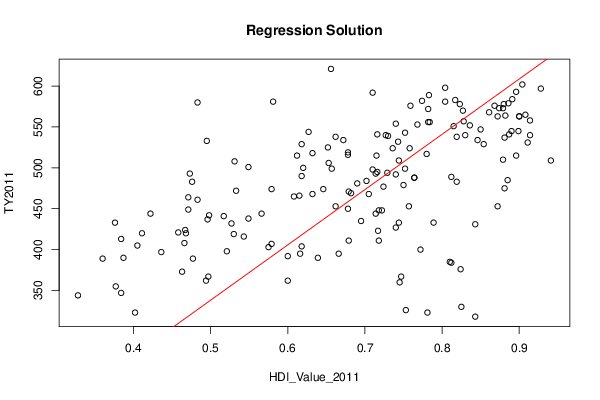
Linear Regression Model
Y ~ X - 1
coefficients:
EstimateStd. Errort valuePr(>|t|)
X676.3369.73269.4990
- - -
Residual Std. Err. 89.438 on 167 df
Multiple R-sq. 0.967
95% CI Multiple R-sq. [0.173, 0.433]
Adjusted R-sq. 0.966

\begin{tabular}{lllllllll}
\hline
Linear Regression Model \tabularnewline
Y ~ X - 1 \tabularnewline
coefficients: &   \tabularnewline
  & Estimate & Std. Error & t value & Pr(>|t|) \tabularnewline
X & 676.336 & 9.732 & 69.499 & 0 \tabularnewline
- - -  &   \tabularnewline
Residual Std. Err.  & 89.438  on  167 df \tabularnewline
Multiple R-sq.  & 0.967 \tabularnewline
95% CI Multiple R-sq.  & [0.173, 0.433] \tabularnewline
Adjusted R-sq.  & 0.966 \tabularnewline
\hline
\end{tabular}
%Source: https://freestatistics.org/blog/index.php?pk=286057&T=1

[TABLE]
[ROW][C]Linear Regression Model[/C][/ROW]
[ROW][C]Y ~ X - 1[/C][/ROW]
[ROW][C]coefficients:[/C][C] [/C][/ROW]
[ROW][C] [/C][C]Estimate[/C][C]Std. Error[/C][C]t value[/C][C]Pr(>|t|)[/C][/ROW]
[C]X[/C][C]676.336[/C][C]9.732[/C][C]69.499[/C][C]0[/C][/ROW]
[ROW][C]- - - [/C][C] [/C][/ROW]
[ROW][C]Residual Std. Err. [/C][C]89.438  on  167 df[/C][/ROW]
[ROW][C]Multiple R-sq. [/C][C]0.967[/C][/ROW]
[ROW][C]95% CI Multiple R-sq. [/C][C][0.173, 0.433][/C][/ROW]
[ROW][C]Adjusted R-sq. [/C][C]0.966[/C][/ROW]
[/TABLE]
Source: https://freestatistics.org/blog/index.php?pk=286057&T=1

Globally Unique Identifier (entire table): ba.freestatistics.org/blog/index.php?pk=286057&T=1

As an alternative you can also use a QR Code:  

The GUIDs for individual cells are displayed in the table below:

Linear Regression Model
Y ~ X - 1
coefficients:
EstimateStd. Errort valuePr(>|t|)
X676.3369.73269.4990
- - -
Residual Std. Err. 89.438 on 167 df
Multiple R-sq. 0.967
95% CI Multiple R-sq. [0.173, 0.433]
Adjusted R-sq. 0.966


ANOVA Statistics
DfSum SqMean SqF valuePr(>F)
HDI_Value_2011138636610.18738636610.1874830.0430
Residuals1671335870.8137999.226

\begin{tabular}{lllllllll}
\hline
ANOVA Statistics \tabularnewline
  & Df & Sum Sq & Mean Sq & F value & Pr(>F) \tabularnewline
HDI_Value_2011 & 1 & 38636610.187 & 38636610.187 & 4830.043 & 0 \tabularnewline
Residuals & 167 & 1335870.813 & 7999.226 &   &   \tabularnewline
\hline
\end{tabular}
%Source: https://freestatistics.org/blog/index.php?pk=286057&T=2

[TABLE]
[ROW][C]ANOVA Statistics[/C][/ROW]
[ROW][C] [/C][C]Df[/C][C]Sum Sq[/C][C]Mean Sq[/C][C]F value[/C][C]Pr(>F)[/C][/ROW]
[ROW][C]HDI_Value_2011[/C][C]1[/C][C]38636610.187[/C][C]38636610.187[/C][C]4830.043[/C][C]0[/C][/ROW]
[ROW][C]Residuals[/C][C]167[/C][C]1335870.813[/C][C]7999.226[/C][C] [/C][C] [/C][/ROW]
[/TABLE]
Source: https://freestatistics.org/blog/index.php?pk=286057&T=2

Globally Unique Identifier (entire table): ba.freestatistics.org/blog/index.php?pk=286057&T=2

As an alternative you can also use a QR Code:  

The GUIDs for individual cells are displayed in the table below:

ANOVA Statistics
DfSum SqMean SqF valuePr(>F)
HDI_Value_2011138636610.18738636610.1874830.0430
Residuals1671335870.8137999.226


Parameters (Session):
par1 = 1 ; par2 = 2 ; par3 = FALSE ;
Parameters (R input):
par1 = 1 ; par2 = 2 ; par3 = FALSE ;
R code (references can be found in the software module):
library(boot)
cat1 <- as.numeric(par1)
cat2<- as.numeric(par2)
intercept<-as.logical(par3)
x <- na.omit(t(x))
rsq <- function(formula, data, indices) {
d <- data[indices,] # allows boot to select sample
fit <- lm(formula, data=d)
return(summary(fit)$r.square)
}
xdf<-data.frame(na.omit(t(y)))
(V1<-dimnames(y)[[1]][cat1])
(V2<-dimnames(y)[[1]][cat2])
xdf <- data.frame(xdf[[cat1]], xdf[[cat2]])
names(xdf)<-c('Y', 'X')
if(intercept == FALSE) (lmxdf<-lm(Y~ X - 1, data = xdf) ) else (lmxdf<-lm(Y~ X, data = xdf) )
(results <- boot(data=xdf, statistic=rsq, R=1000, formula=Y~X))
sumlmxdf<-summary(lmxdf)
(aov.xdf<-aov(lmxdf) )
(anova.xdf<-anova(lmxdf) )
load(file='createtable')
a<-table.start()
nc <- ncol(sumlmxdf$'coefficients')
nr <- nrow(sumlmxdf$'coefficients')
a<-table.row.start(a)
a<-table.element(a,'Linear Regression Model', nc+1,TRUE)
a<-table.row.end(a)
a<-table.row.start(a)
a<-table.element(a, lmxdf$call['formula'],nc+1)
a<-table.row.end(a)
a<-table.row.start(a)
a<-table.element(a, 'coefficients:',1,TRUE)
a<-table.element(a, ' ',nc,TRUE)
a<-table.row.end(a)
a<-table.row.start(a)
a<-table.element(a, ' ',1,TRUE)
for(i in 1 : nc){
a<-table.element(a, dimnames(sumlmxdf$'coefficients')[[2]][i],1,TRUE)
}#end header
a<-table.row.end(a)
for(i in 1: nr){
a<-table.element(a,dimnames(sumlmxdf$'coefficients')[[1]][i] ,1,TRUE)
for(j in 1 : nc){
a<-table.element(a, round(sumlmxdf$coefficients[i, j], digits=3), 1 ,FALSE)
}
a<-table.row.end(a)
}
a<-table.row.start(a)
a<-table.element(a, '- - - ',1,TRUE)
a<-table.element(a, ' ',nc,FALSE)
a<-table.row.end(a)
a<-table.row.start(a)
a<-table.element(a, 'Residual Std. Err. ',1,TRUE)
a<-table.element(a, paste(round(sumlmxdf$'sigma', digits=3), ' on ', sumlmxdf$'df'[2], 'df') ,nc, FALSE)
a<-table.row.end(a)
a<-table.row.start(a)
a<-table.element(a, 'Multiple R-sq. ',1,TRUE)
a<-table.element(a, round(sumlmxdf$'r.squared', digits=3) ,nc, FALSE)
a<-table.row.end(a)
a<-table.row.start(a)
a<-table.element(a, '95% CI Multiple R-sq. ',1,TRUE)
a<-table.element(a, paste('[',round(boot.ci(results,type='bca')$bca[1,4], digits=3),', ', round(boot.ci(results,type='bca')$bca[1,5], digits=3), ']',sep='') ,nc, FALSE)
a<-table.row.end(a)
a<-table.row.start(a)
a<-table.element(a, 'Adjusted R-sq. ',1,TRUE)
a<-table.element(a, round(sumlmxdf$'adj.r.squared', digits=3) ,nc, FALSE)
a<-table.row.end(a)
a<-table.end(a)
table.save(a,file='mytable.tab')
a<-table.start()
a<-table.row.start(a)
a<-table.element(a,'ANOVA Statistics', 5+1,TRUE)
a<-table.row.end(a)
a<-table.row.start(a)
a<-table.element(a, ' ',1,TRUE)
a<-table.element(a, 'Df',1,TRUE)
a<-table.element(a, 'Sum Sq',1,TRUE)
a<-table.element(a, 'Mean Sq',1,TRUE)
a<-table.element(a, 'F value',1,TRUE)
a<-table.element(a, 'Pr(>F)',1,TRUE)
a<-table.row.end(a)
a<-table.row.start(a)
a<-table.element(a, V2,1,TRUE)
a<-table.element(a, anova.xdf$Df[1])
a<-table.element(a, round(anova.xdf$'Sum Sq'[1], digits=3))
a<-table.element(a, round(anova.xdf$'Mean Sq'[1], digits=3))
a<-table.element(a, round(anova.xdf$'F value'[1], digits=3))
a<-table.element(a, round(anova.xdf$'Pr(>F)'[1], digits=3))
a<-table.row.end(a)
a<-table.row.start(a)
a<-table.element(a, 'Residuals',1,TRUE)
a<-table.element(a, anova.xdf$Df[2])
a<-table.element(a, round(anova.xdf$'Sum Sq'[2], digits=3))
a<-table.element(a, round(anova.xdf$'Mean Sq'[2], digits=3))
a<-table.element(a, ' ')
a<-table.row.end(a)
a<-table.end(a)
table.save(a,file='mytable1.tab')
bitmap(file='regressionplot.png')
plot(Y~ X, data=xdf, xlab=V2, ylab=V1, main='Regression Solution')
if(intercept == TRUE) abline(coef(lmxdf), col='red')
if(intercept == FALSE) abline(0.0, coef(lmxdf), col='red')
dev.off()
library(car)
bitmap(file='residualsQQplot.png')
qqPlot(resid(lmxdf), main='QQplot of Residuals of Fit')
dev.off()
bitmap(file='residualsplot.png')
plot(xdf$X, resid(lmxdf), main='Scatterplot of Residuals of Model Fit')
dev.off()
bitmap(file='cooksDistanceLmplot.png')
plot(lmxdf, which=4)
dev.off()