Free Statistics

of Irreproducible Research!

Author's title

Author*The author of this computation has been verified*
R Software Modulerwasp_Simple Regression Y ~ X.wasp
Title produced by softwareSimple Linear Regression
Date of computationSat, 12 Dec 2015 11:41:46 +0000
Cite this page as followsStatistical Computations at FreeStatistics.org, Office for Research Development and Education, URL https://freestatistics.org/blog/index.php?v=date/2015/Dec/12/t1449920565m0movfgmjal1mt1.htm/, Retrieved Thu, 16 May 2024 10:11:06 +0000
Statistical Computations at FreeStatistics.org, Office for Research Development and Education, URL https://freestatistics.org/blog/index.php?pk=286059, Retrieved Thu, 16 May 2024 10:11:06 +0000
QR Codes:

Original text written by user:
IsPrivate?No (this computation is public)
User-defined keywords
Estimated Impact84
Family? (F = Feedback message, R = changed R code, M = changed R Module, P = changed Parameters, D = changed Data)
-       [Simple Linear Regression] [Simple linear reg...] [2015-12-12 11:41:46] [b6628d6ea1d7803ffc2dc825d38ead4a] [Current]
Feedback Forum

Post a new message
Dataseries X:
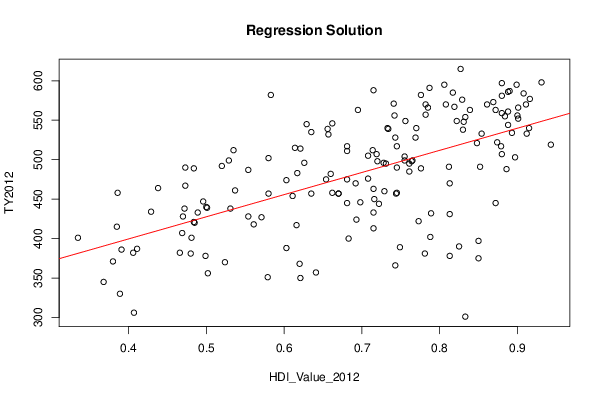
382 0.466
512 0.714
463 0.715
538 0.83
370 0.524
422 0.773
595 0.806
496 0.728
598 0.931
581 0.88
517 0.745
402 0.788
431 0.813
487 0.554
489 0.776
566 0.785
597 0.88
495 0.731
467 0.473
490 0.473
457 0.58
502 0.58
460 0.729
445 0.681
556 0.742
491 0.852
582 0.776
415 0.385
458 0.386
351 0.579
439 0.501
566 0.901
NA 0.635
NA 0.365
NA 0.37
567 0.819
588 0.715
505 0.708
NA 0.486
418 0.561
495 0.761
491 0.812
470 0.813
521 0.848
570 0.861
556 0.9
NA 0.465
450 0.716
446 0.698
NA 0.698
476 0.708
475 0.681
482 0.66
NA 0.556
371 0.38
563 0.839
434 0.429
444 0.722
517 0.879
555 0.884
457 0.67
464 0.438
571 0.741
570 0.911
427 0.571
533 0.854
366 0.743
496 0.626
386 0.391
NA 0.396
457 0.635
407 0.469
417 0.616
585 0.817
534 0.893
582 0.583
511 0.681
517 0.681
357 0.641
552 0.901
488 0.886
563 0.872
445 0.872
433 0.715
544 0.888
457 0.744
499 0.755
438 0.531
NA 0.606
NA 0.888
586 0.888
378 0.813
514 0.621
350 0.621
570 0.808
498 0.764
401 0.481
306 0.407
432 0.789
561 0.888
548 0.831
559 0.88
507 0.88
447 0.496
387 0.411
540 0.77
563 0.695
382 0.406
615 0.827
NA 0.827
420 0.485
528 0.769
504 0.755
NA 0.755
545 0.629
NA 0.657
470 0.692
NA 0.787
515 0.614
330 0.389
492 0.52
368 0.62
NA 0.62
461 0.537
540 0.915
584 0.908
454 0.611
401 0.335
440 0.5
519 0.943
381 0.781
512 0.535
NA 0.773
400 0.683
485 0.761
NA 0.49
457 0.67
539 0.734
539 0.656
554 0.833
549 0.822
397 0.85
375 0.85
570 0.782
557 0.782
356 0.502
389 0.749
413 0.715
NA 0.693
NA 0.693
301 0.833
421 0.484
NA 0.743
528 0.743
NA 0.755
345 0.368
595 0.899
576 0.829
522 0.874
433 0.489
475 0.654
NA 0.654
573 0.869
490 0.745
458 0.745
438 0.472
NA 0.702
499 0.529
503 0.897
577 0.916
458 0.662
546 0.662
474 0.603
388 0.603
498 0.72
428 0.47
NA 0.704
499 0.765
507 0.719
549 0.756
424 0.693
381 0.48
540 0.733
390 0.825
587 0.89
533 0.912
591 0.787
532 0.657
NA 0.617
483 0.617
535 0.635
378 0.499
428 0.554
489 0.484


Summary of computational transaction
Raw Inputview raw input (R code)
Raw Outputview raw output of R engine
Computing time5 seconds
R Server'Sir Maurice George Kendall' @ kendall.wessa.net

\begin{tabular}{lllllllll}
\hline
Summary of computational transaction \tabularnewline
Raw Input & view raw input (R code)  \tabularnewline
Raw Output & view raw output of R engine  \tabularnewline
Computing time & 5 seconds \tabularnewline
R Server & 'Sir Maurice George Kendall' @ kendall.wessa.net \tabularnewline
\hline
\end{tabular}
%Source: https://freestatistics.org/blog/index.php?pk=286059&T=0

[TABLE]
[ROW][C]Summary of computational transaction[/C][/ROW]
[ROW][C]Raw Input[/C][C]view raw input (R code) [/C][/ROW]
[ROW][C]Raw Output[/C][C]view raw output of R engine [/C][/ROW]
[ROW][C]Computing time[/C][C]5 seconds[/C][/ROW]
[ROW][C]R Server[/C][C]'Sir Maurice George Kendall' @ kendall.wessa.net[/C][/ROW]
[/TABLE]
Source: https://freestatistics.org/blog/index.php?pk=286059&T=0

Globally Unique Identifier (entire table): ba.freestatistics.org/blog/index.php?pk=286059&T=0

As an alternative you can also use a QR Code:  

The GUIDs for individual cells are displayed in the table below:

Summary of computational transaction
Raw Inputview raw input (R code)
Raw Outputview raw output of R engine
Computing time5 seconds
R Server'Sir Maurice George Kendall' @ kendall.wessa.net


Linear Regression Model
Y ~ X
coefficients:
EstimateStd. Errort valuePr(>|t|)
(Intercept)287.21320.54313.9810
X280.7428.7749.7570
- - -
Residual Std. Err. 57.036 on 167 df
Multiple R-sq. 0.363
95% CI Multiple R-sq. [0.226, 0.479]
Adjusted R-sq. 0.359

\begin{tabular}{lllllllll}
\hline
Linear Regression Model \tabularnewline
Y ~ X \tabularnewline
coefficients: &   \tabularnewline
  & Estimate & Std. Error & t value & Pr(>|t|) \tabularnewline
(Intercept) & 287.213 & 20.543 & 13.981 & 0 \tabularnewline
X & 280.74 & 28.774 & 9.757 & 0 \tabularnewline
- - -  &   \tabularnewline
Residual Std. Err.  & 57.036  on  167 df \tabularnewline
Multiple R-sq.  & 0.363 \tabularnewline
95% CI Multiple R-sq.  & [0.226, 0.479] \tabularnewline
Adjusted R-sq.  & 0.359 \tabularnewline
\hline
\end{tabular}
%Source: https://freestatistics.org/blog/index.php?pk=286059&T=1

[TABLE]
[ROW][C]Linear Regression Model[/C][/ROW]
[ROW][C]Y ~ X[/C][/ROW]
[ROW][C]coefficients:[/C][C] [/C][/ROW]
[ROW][C] [/C][C]Estimate[/C][C]Std. Error[/C][C]t value[/C][C]Pr(>|t|)[/C][/ROW]
[C](Intercept)[/C][C]287.213[/C][C]20.543[/C][C]13.981[/C][C]0[/C][/ROW]
[C]X[/C][C]280.74[/C][C]28.774[/C][C]9.757[/C][C]0[/C][/ROW]
[ROW][C]- - - [/C][C] [/C][/ROW]
[ROW][C]Residual Std. Err. [/C][C]57.036  on  167 df[/C][/ROW]
[ROW][C]Multiple R-sq. [/C][C]0.363[/C][/ROW]
[ROW][C]95% CI Multiple R-sq. [/C][C][0.226, 0.479][/C][/ROW]
[ROW][C]Adjusted R-sq. [/C][C]0.359[/C][/ROW]
[/TABLE]
Source: https://freestatistics.org/blog/index.php?pk=286059&T=1

Globally Unique Identifier (entire table): ba.freestatistics.org/blog/index.php?pk=286059&T=1

As an alternative you can also use a QR Code:  

The GUIDs for individual cells are displayed in the table below:

Linear Regression Model
Y ~ X
coefficients:
EstimateStd. Errort valuePr(>|t|)
(Intercept)287.21320.54313.9810
X280.7428.7749.7570
- - -
Residual Std. Err. 57.036 on 167 df
Multiple R-sq. 0.363
95% CI Multiple R-sq. [0.226, 0.479]
Adjusted R-sq. 0.359


ANOVA Statistics
DfSum SqMean SqF valuePr(>F)
HDI_Value_20121309680.031309680.03195.1950
Residuals167543266.9163253.095

\begin{tabular}{lllllllll}
\hline
ANOVA Statistics \tabularnewline
  & Df & Sum Sq & Mean Sq & F value & Pr(>F) \tabularnewline
HDI_Value_2012 & 1 & 309680.031 & 309680.031 & 95.195 & 0 \tabularnewline
Residuals & 167 & 543266.916 & 3253.095 &   &   \tabularnewline
\hline
\end{tabular}
%Source: https://freestatistics.org/blog/index.php?pk=286059&T=2

[TABLE]
[ROW][C]ANOVA Statistics[/C][/ROW]
[ROW][C] [/C][C]Df[/C][C]Sum Sq[/C][C]Mean Sq[/C][C]F value[/C][C]Pr(>F)[/C][/ROW]
[ROW][C]HDI_Value_2012[/C][C]1[/C][C]309680.031[/C][C]309680.031[/C][C]95.195[/C][C]0[/C][/ROW]
[ROW][C]Residuals[/C][C]167[/C][C]543266.916[/C][C]3253.095[/C][C] [/C][C] [/C][/ROW]
[/TABLE]
Source: https://freestatistics.org/blog/index.php?pk=286059&T=2

Globally Unique Identifier (entire table): ba.freestatistics.org/blog/index.php?pk=286059&T=2

As an alternative you can also use a QR Code:  

The GUIDs for individual cells are displayed in the table below:

ANOVA Statistics
DfSum SqMean SqF valuePr(>F)
HDI_Value_20121309680.031309680.03195.1950
Residuals167543266.9163253.095


Parameters (Session):
par1 = 1 ; par2 = 2 ; par3 = TRUE ;
Parameters (R input):
par1 = 1 ; par2 = 2 ; par3 = TRUE ;
R code (references can be found in the software module):
library(boot)
cat1 <- as.numeric(par1)
cat2<- as.numeric(par2)
intercept<-as.logical(par3)
x <- na.omit(t(x))
rsq <- function(formula, data, indices) {
d <- data[indices,] # allows boot to select sample
fit <- lm(formula, data=d)
return(summary(fit)$r.square)
}
xdf<-data.frame(na.omit(t(y)))
(V1<-dimnames(y)[[1]][cat1])
(V2<-dimnames(y)[[1]][cat2])
xdf <- data.frame(xdf[[cat1]], xdf[[cat2]])
names(xdf)<-c('Y', 'X')
if(intercept == FALSE) (lmxdf<-lm(Y~ X - 1, data = xdf) ) else (lmxdf<-lm(Y~ X, data = xdf) )
(results <- boot(data=xdf, statistic=rsq, R=1000, formula=Y~X))
sumlmxdf<-summary(lmxdf)
(aov.xdf<-aov(lmxdf) )
(anova.xdf<-anova(lmxdf) )
load(file='createtable')
a<-table.start()
nc <- ncol(sumlmxdf$'coefficients')
nr <- nrow(sumlmxdf$'coefficients')
a<-table.row.start(a)
a<-table.element(a,'Linear Regression Model', nc+1,TRUE)
a<-table.row.end(a)
a<-table.row.start(a)
a<-table.element(a, lmxdf$call['formula'],nc+1)
a<-table.row.end(a)
a<-table.row.start(a)
a<-table.element(a, 'coefficients:',1,TRUE)
a<-table.element(a, ' ',nc,TRUE)
a<-table.row.end(a)
a<-table.row.start(a)
a<-table.element(a, ' ',1,TRUE)
for(i in 1 : nc){
a<-table.element(a, dimnames(sumlmxdf$'coefficients')[[2]][i],1,TRUE)
}#end header
a<-table.row.end(a)
for(i in 1: nr){
a<-table.element(a,dimnames(sumlmxdf$'coefficients')[[1]][i] ,1,TRUE)
for(j in 1 : nc){
a<-table.element(a, round(sumlmxdf$coefficients[i, j], digits=3), 1 ,FALSE)
}
a<-table.row.end(a)
}
a<-table.row.start(a)
a<-table.element(a, '- - - ',1,TRUE)
a<-table.element(a, ' ',nc,FALSE)
a<-table.row.end(a)
a<-table.row.start(a)
a<-table.element(a, 'Residual Std. Err. ',1,TRUE)
a<-table.element(a, paste(round(sumlmxdf$'sigma', digits=3), ' on ', sumlmxdf$'df'[2], 'df') ,nc, FALSE)
a<-table.row.end(a)
a<-table.row.start(a)
a<-table.element(a, 'Multiple R-sq. ',1,TRUE)
a<-table.element(a, round(sumlmxdf$'r.squared', digits=3) ,nc, FALSE)
a<-table.row.end(a)
a<-table.row.start(a)
a<-table.element(a, '95% CI Multiple R-sq. ',1,TRUE)
a<-table.element(a, paste('[',round(boot.ci(results,type='bca')$bca[1,4], digits=3),', ', round(boot.ci(results,type='bca')$bca[1,5], digits=3), ']',sep='') ,nc, FALSE)
a<-table.row.end(a)
a<-table.row.start(a)
a<-table.element(a, 'Adjusted R-sq. ',1,TRUE)
a<-table.element(a, round(sumlmxdf$'adj.r.squared', digits=3) ,nc, FALSE)
a<-table.row.end(a)
a<-table.end(a)
table.save(a,file='mytable.tab')
a<-table.start()
a<-table.row.start(a)
a<-table.element(a,'ANOVA Statistics', 5+1,TRUE)
a<-table.row.end(a)
a<-table.row.start(a)
a<-table.element(a, ' ',1,TRUE)
a<-table.element(a, 'Df',1,TRUE)
a<-table.element(a, 'Sum Sq',1,TRUE)
a<-table.element(a, 'Mean Sq',1,TRUE)
a<-table.element(a, 'F value',1,TRUE)
a<-table.element(a, 'Pr(>F)',1,TRUE)
a<-table.row.end(a)
a<-table.row.start(a)
a<-table.element(a, V2,1,TRUE)
a<-table.element(a, anova.xdf$Df[1])
a<-table.element(a, round(anova.xdf$'Sum Sq'[1], digits=3))
a<-table.element(a, round(anova.xdf$'Mean Sq'[1], digits=3))
a<-table.element(a, round(anova.xdf$'F value'[1], digits=3))
a<-table.element(a, round(anova.xdf$'Pr(>F)'[1], digits=3))
a<-table.row.end(a)
a<-table.row.start(a)
a<-table.element(a, 'Residuals',1,TRUE)
a<-table.element(a, anova.xdf$Df[2])
a<-table.element(a, round(anova.xdf$'Sum Sq'[2], digits=3))
a<-table.element(a, round(anova.xdf$'Mean Sq'[2], digits=3))
a<-table.element(a, ' ')
a<-table.row.end(a)
a<-table.end(a)
table.save(a,file='mytable1.tab')
bitmap(file='regressionplot.png')
plot(Y~ X, data=xdf, xlab=V2, ylab=V1, main='Regression Solution')
if(intercept == TRUE) abline(coef(lmxdf), col='red')
if(intercept == FALSE) abline(0.0, coef(lmxdf), col='red')
dev.off()
library(car)
bitmap(file='residualsQQplot.png')
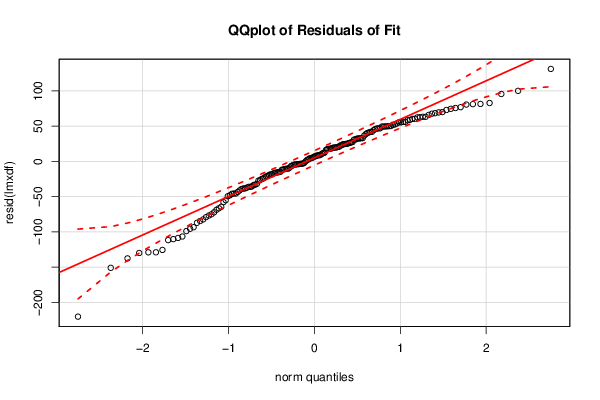
qqPlot(resid(lmxdf), main='QQplot of Residuals of Fit')
dev.off()
bitmap(file='residualsplot.png')
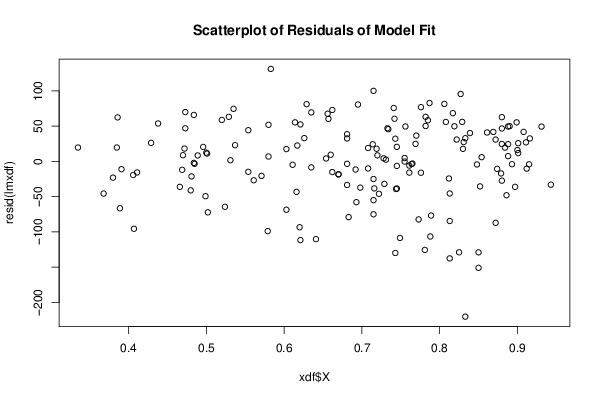
plot(xdf$X, resid(lmxdf), main='Scatterplot of Residuals of Model Fit')
dev.off()
bitmap(file='cooksDistanceLmplot.png')
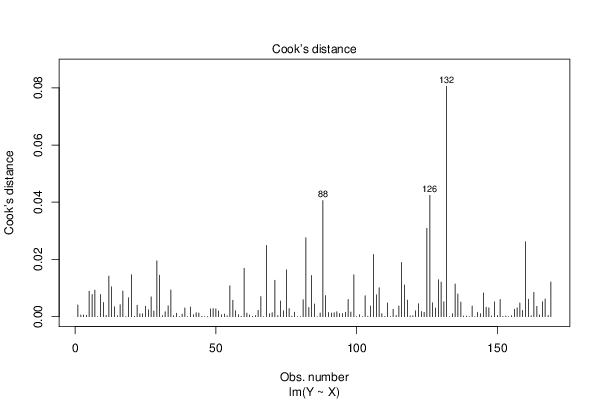
plot(lmxdf, which=4)
dev.off()