Free Statistics

of Irreproducible Research!

Author's title

Author*The author of this computation has been verified*
R Software Modulerwasp_Simple Regression Y ~ X.wasp
Title produced by softwareSimple Linear Regression
Date of computationSat, 12 Dec 2015 11:45:57 +0000
Cite this page as followsStatistical Computations at FreeStatistics.org, Office for Research Development and Education, URL https://freestatistics.org/blog/index.php?v=date/2015/Dec/12/t1449920783pzxr3ct91oh1vnu.htm/, Retrieved Thu, 16 May 2024 14:15:32 +0000
Statistical Computations at FreeStatistics.org, Office for Research Development and Education, URL https://freestatistics.org/blog/index.php?pk=286061, Retrieved Thu, 16 May 2024 14:15:32 +0000
QR Codes:

Original text written by user:
IsPrivate?No (this computation is public)
User-defined keywords
Estimated Impact85
Family? (F = Feedback message, R = changed R code, M = changed R Module, P = changed Parameters, D = changed Data)
-       [Simple Linear Regression] [Simple linear reg...] [2015-12-12 11:45:57] [b6628d6ea1d7803ffc2dc825d38ead4a] [Current]
Feedback Forum

Post a new message
Dataseries X:
307 0.468
487 0.716
471 0.717
NA 0.83
370 0.526
353 0.774
591 0.808
554 0.73
590 0.933
591 0.881
514 0.747
424 0.789
427 0.815
488 0.558
484 0.776
575 0.786
591 0.881
447 0.732
459 0.476
558 0.476
461 0.584
451 0.584
442 0.731
444 0.683
560 0.744
441 0.852
572 0.777
406 0.388
412 0.389
338 0.584
445 0.504
565 0.902
NA 0.636
NA 0.341
NA 0.372
574 0.822
582 0.719
499 0.711
NA 0.488
397 0.564
521 0.763
521 0.812
386 0.815
523 0.845
571 0.861
550 0.9
NA 0.467
383 0.717
429 0.7
NA 0.7
457 0.711
463 0.682
450 0.662
NA 0.556
389 0.381
564 0.84
427 0.435
NA 0.724
522 0.879
559 0.884
468 0.674
464 0.441
527 0.744
570 0.911
419 0.573
526 0.853
NA 0.744
490 0.628
382 0.392
NA 0.396
417 0.638
403 0.471
462 0.617
580 0.818
506 0.895
577 0.586
509 0.684
520 0.684
360 0.642
562 0.899
484 0.888
561 0.872
448 0.872
428 0.715
542 0.89
440 0.745
501 0.757
427 0.535
NA 0.607
NA 0.891
581 0.891
344 0.814
536 0.628
383 0.628
562 0.81
492 0.765
490 0.486
314 0.412
355 0.784
556 0.889
550 0.834
558 0.881
558 0.881
468 0.498
399 0.414
549 0.773
400 0.698
433 0.407
547 0.829
NA 0.829
354 0.487
557 0.771
496 0.756
NA 0.756
528 0.63
NA 0.663
474 0.698
477 0.789
505 0.617
369 0.393
462 0.524
347 0.624
NA 0.624
478 0.54
536 0.915
608 0.91
463 0.614
408 0.337
418 0.504
540 0.944
405 0.783
497 0.537
NA 0.775
389 0.686
480 0.765
NA 0.491
508 0.676
543 0.737
516 0.66
565 0.834
559 0.822
441 0.851
312 0.851
576 0.785
553 0.785
396 0.506
368 0.75
420 0.714
NA 0.694
NA 0.694
311 0.836
452 0.485
551 0.745
NA 0.745
NA 0.756
341 0.374
605 0.901
527 0.83
557 0.874
398 0.491
475 0.658
NA 0.658
578 0.869
477 0.75
NA 0.75
435 0.473
403 0.705
446 0.53
510 0.898
580 0.917
470 0.658
548 0.658
437 0.607
368 0.607
498 0.722
428 0.473
NA 0.705
479 0.766
497 0.721
550 0.759
472 0.698
407 0.484
542 0.734
385 0.827
590 0.892
532 0.914
587 0.79
521 0.661
NA 0.616
496 0.616
542 0.638
395 0.5
417 0.561
488 0.492


Summary of computational transaction
Raw Inputview raw input (R code)
Raw Outputview raw output of R engine
Computing time5 seconds
R Server'Herman Ole Andreas Wold' @ wold.wessa.net

\begin{tabular}{lllllllll}
\hline
Summary of computational transaction \tabularnewline
Raw Input & view raw input (R code)  \tabularnewline
Raw Output & view raw output of R engine  \tabularnewline
Computing time & 5 seconds \tabularnewline
R Server & 'Herman Ole Andreas Wold' @ wold.wessa.net \tabularnewline
\hline
\end{tabular}
%Source: https://freestatistics.org/blog/index.php?pk=286061&T=0

[TABLE]
[ROW][C]Summary of computational transaction[/C][/ROW]
[ROW][C]Raw Input[/C][C]view raw input (R code) [/C][/ROW]
[ROW][C]Raw Output[/C][C]view raw output of R engine [/C][/ROW]
[ROW][C]Computing time[/C][C]5 seconds[/C][/ROW]
[ROW][C]R Server[/C][C]'Herman Ole Andreas Wold' @ wold.wessa.net[/C][/ROW]
[/TABLE]
Source: https://freestatistics.org/blog/index.php?pk=286061&T=0

Globally Unique Identifier (entire table): ba.freestatistics.org/blog/index.php?pk=286061&T=0

As an alternative you can also use a QR Code:  

The GUIDs for individual cells are displayed in the table below:

Summary of computational transaction
Raw Inputview raw input (R code)
Raw Outputview raw output of R engine
Computing time5 seconds
R Server'Herman Ole Andreas Wold' @ wold.wessa.net


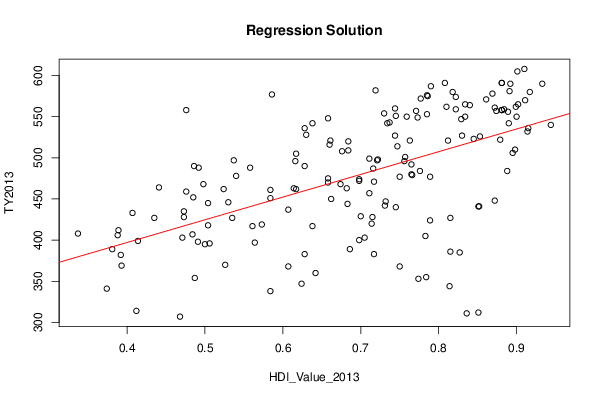
Linear Regression Model
Y ~ X
coefficients:
EstimateStd. Errort valuePr(>|t|)
(Intercept)286.76422.34512.8340
X275.87831.258.8280
- - -
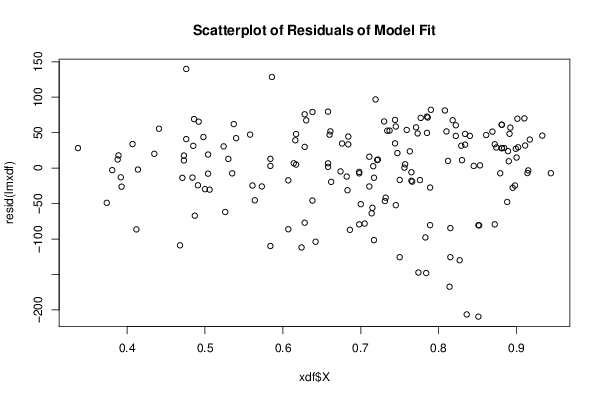
Residual Std. Err. 61.502 on 165 df
Multiple R-sq. 0.321
95% CI Multiple R-sq. [0.19, 0.45]
Adjusted R-sq. 0.317

\begin{tabular}{lllllllll}
\hline
Linear Regression Model \tabularnewline
Y ~ X \tabularnewline
coefficients: &   \tabularnewline
  & Estimate & Std. Error & t value & Pr(>|t|) \tabularnewline
(Intercept) & 286.764 & 22.345 & 12.834 & 0 \tabularnewline
X & 275.878 & 31.25 & 8.828 & 0 \tabularnewline
- - -  &   \tabularnewline
Residual Std. Err.  & 61.502  on  165 df \tabularnewline
Multiple R-sq.  & 0.321 \tabularnewline
95% CI Multiple R-sq.  & [0.19, 0.45] \tabularnewline
Adjusted R-sq.  & 0.317 \tabularnewline
\hline
\end{tabular}
%Source: https://freestatistics.org/blog/index.php?pk=286061&T=1

[TABLE]
[ROW][C]Linear Regression Model[/C][/ROW]
[ROW][C]Y ~ X[/C][/ROW]
[ROW][C]coefficients:[/C][C] [/C][/ROW]
[ROW][C] [/C][C]Estimate[/C][C]Std. Error[/C][C]t value[/C][C]Pr(>|t|)[/C][/ROW]
[C](Intercept)[/C][C]286.764[/C][C]22.345[/C][C]12.834[/C][C]0[/C][/ROW]
[C]X[/C][C]275.878[/C][C]31.25[/C][C]8.828[/C][C]0[/C][/ROW]
[ROW][C]- - - [/C][C] [/C][/ROW]
[ROW][C]Residual Std. Err. [/C][C]61.502  on  165 df[/C][/ROW]
[ROW][C]Multiple R-sq. [/C][C]0.321[/C][/ROW]
[ROW][C]95% CI Multiple R-sq. [/C][C][0.19, 0.45][/C][/ROW]
[ROW][C]Adjusted R-sq. [/C][C]0.317[/C][/ROW]
[/TABLE]
Source: https://freestatistics.org/blog/index.php?pk=286061&T=1

Globally Unique Identifier (entire table): ba.freestatistics.org/blog/index.php?pk=286061&T=1

As an alternative you can also use a QR Code:  

The GUIDs for individual cells are displayed in the table below:

Linear Regression Model
Y ~ X
coefficients:
EstimateStd. Errort valuePr(>|t|)
(Intercept)286.76422.34512.8340
X275.87831.258.8280
- - -
Residual Std. Err. 61.502 on 165 df
Multiple R-sq. 0.321
95% CI Multiple R-sq. [0.19, 0.45]
Adjusted R-sq. 0.317


ANOVA Statistics
DfSum SqMean SqF valuePr(>F)
HDI_Value_20131294789.072294789.07277.9350
Residuals165624114.6763782.513

\begin{tabular}{lllllllll}
\hline
ANOVA Statistics \tabularnewline
  & Df & Sum Sq & Mean Sq & F value & Pr(>F) \tabularnewline
HDI_Value_2013 & 1 & 294789.072 & 294789.072 & 77.935 & 0 \tabularnewline
Residuals & 165 & 624114.676 & 3782.513 &   &   \tabularnewline
\hline
\end{tabular}
%Source: https://freestatistics.org/blog/index.php?pk=286061&T=2

[TABLE]
[ROW][C]ANOVA Statistics[/C][/ROW]
[ROW][C] [/C][C]Df[/C][C]Sum Sq[/C][C]Mean Sq[/C][C]F value[/C][C]Pr(>F)[/C][/ROW]
[ROW][C]HDI_Value_2013[/C][C]1[/C][C]294789.072[/C][C]294789.072[/C][C]77.935[/C][C]0[/C][/ROW]
[ROW][C]Residuals[/C][C]165[/C][C]624114.676[/C][C]3782.513[/C][C] [/C][C] [/C][/ROW]
[/TABLE]
Source: https://freestatistics.org/blog/index.php?pk=286061&T=2

Globally Unique Identifier (entire table): ba.freestatistics.org/blog/index.php?pk=286061&T=2

As an alternative you can also use a QR Code:  

The GUIDs for individual cells are displayed in the table below:

ANOVA Statistics
DfSum SqMean SqF valuePr(>F)
HDI_Value_20131294789.072294789.07277.9350
Residuals165624114.6763782.513


Parameters (Session):
par1 = 1 ; par2 = 2 ; par3 = TRUE ;
Parameters (R input):
par1 = 1 ; par2 = 2 ; par3 = TRUE ;
R code (references can be found in the software module):
library(boot)
cat1 <- as.numeric(par1)
cat2<- as.numeric(par2)
intercept<-as.logical(par3)
x <- na.omit(t(x))
rsq <- function(formula, data, indices) {
d <- data[indices,] # allows boot to select sample
fit <- lm(formula, data=d)
return(summary(fit)$r.square)
}
xdf<-data.frame(na.omit(t(y)))
(V1<-dimnames(y)[[1]][cat1])
(V2<-dimnames(y)[[1]][cat2])
xdf <- data.frame(xdf[[cat1]], xdf[[cat2]])
names(xdf)<-c('Y', 'X')
if(intercept == FALSE) (lmxdf<-lm(Y~ X - 1, data = xdf) ) else (lmxdf<-lm(Y~ X, data = xdf) )
(results <- boot(data=xdf, statistic=rsq, R=1000, formula=Y~X))
sumlmxdf<-summary(lmxdf)
(aov.xdf<-aov(lmxdf) )
(anova.xdf<-anova(lmxdf) )
load(file='createtable')
a<-table.start()
nc <- ncol(sumlmxdf$'coefficients')
nr <- nrow(sumlmxdf$'coefficients')
a<-table.row.start(a)
a<-table.element(a,'Linear Regression Model', nc+1,TRUE)
a<-table.row.end(a)
a<-table.row.start(a)
a<-table.element(a, lmxdf$call['formula'],nc+1)
a<-table.row.end(a)
a<-table.row.start(a)
a<-table.element(a, 'coefficients:',1,TRUE)
a<-table.element(a, ' ',nc,TRUE)
a<-table.row.end(a)
a<-table.row.start(a)
a<-table.element(a, ' ',1,TRUE)
for(i in 1 : nc){
a<-table.element(a, dimnames(sumlmxdf$'coefficients')[[2]][i],1,TRUE)
}#end header
a<-table.row.end(a)
for(i in 1: nr){
a<-table.element(a,dimnames(sumlmxdf$'coefficients')[[1]][i] ,1,TRUE)
for(j in 1 : nc){
a<-table.element(a, round(sumlmxdf$coefficients[i, j], digits=3), 1 ,FALSE)
}
a<-table.row.end(a)
}
a<-table.row.start(a)
a<-table.element(a, '- - - ',1,TRUE)
a<-table.element(a, ' ',nc,FALSE)
a<-table.row.end(a)
a<-table.row.start(a)
a<-table.element(a, 'Residual Std. Err. ',1,TRUE)
a<-table.element(a, paste(round(sumlmxdf$'sigma', digits=3), ' on ', sumlmxdf$'df'[2], 'df') ,nc, FALSE)
a<-table.row.end(a)
a<-table.row.start(a)
a<-table.element(a, 'Multiple R-sq. ',1,TRUE)
a<-table.element(a, round(sumlmxdf$'r.squared', digits=3) ,nc, FALSE)
a<-table.row.end(a)
a<-table.row.start(a)
a<-table.element(a, '95% CI Multiple R-sq. ',1,TRUE)
a<-table.element(a, paste('[',round(boot.ci(results,type='bca')$bca[1,4], digits=3),', ', round(boot.ci(results,type='bca')$bca[1,5], digits=3), ']',sep='') ,nc, FALSE)
a<-table.row.end(a)
a<-table.row.start(a)
a<-table.element(a, 'Adjusted R-sq. ',1,TRUE)
a<-table.element(a, round(sumlmxdf$'adj.r.squared', digits=3) ,nc, FALSE)
a<-table.row.end(a)
a<-table.end(a)
table.save(a,file='mytable.tab')
a<-table.start()
a<-table.row.start(a)
a<-table.element(a,'ANOVA Statistics', 5+1,TRUE)
a<-table.row.end(a)
a<-table.row.start(a)
a<-table.element(a, ' ',1,TRUE)
a<-table.element(a, 'Df',1,TRUE)
a<-table.element(a, 'Sum Sq',1,TRUE)
a<-table.element(a, 'Mean Sq',1,TRUE)
a<-table.element(a, 'F value',1,TRUE)
a<-table.element(a, 'Pr(>F)',1,TRUE)
a<-table.row.end(a)
a<-table.row.start(a)
a<-table.element(a, V2,1,TRUE)
a<-table.element(a, anova.xdf$Df[1])
a<-table.element(a, round(anova.xdf$'Sum Sq'[1], digits=3))
a<-table.element(a, round(anova.xdf$'Mean Sq'[1], digits=3))
a<-table.element(a, round(anova.xdf$'F value'[1], digits=3))
a<-table.element(a, round(anova.xdf$'Pr(>F)'[1], digits=3))
a<-table.row.end(a)
a<-table.row.start(a)
a<-table.element(a, 'Residuals',1,TRUE)
a<-table.element(a, anova.xdf$Df[2])
a<-table.element(a, round(anova.xdf$'Sum Sq'[2], digits=3))
a<-table.element(a, round(anova.xdf$'Mean Sq'[2], digits=3))
a<-table.element(a, ' ')
a<-table.row.end(a)
a<-table.end(a)
table.save(a,file='mytable1.tab')
bitmap(file='regressionplot.png')
plot(Y~ X, data=xdf, xlab=V2, ylab=V1, main='Regression Solution')
if(intercept == TRUE) abline(coef(lmxdf), col='red')
if(intercept == FALSE) abline(0.0, coef(lmxdf), col='red')
dev.off()
library(car)
bitmap(file='residualsQQplot.png')
qqPlot(resid(lmxdf), main='QQplot of Residuals of Fit')
dev.off()
bitmap(file='residualsplot.png')
plot(xdf$X, resid(lmxdf), main='Scatterplot of Residuals of Model Fit')
dev.off()
bitmap(file='cooksDistanceLmplot.png')
plot(lmxdf, which=4)
dev.off()