Free Statistics

of Irreproducible Research!

Author's title

Author*The author of this computation has been verified*
R Software Modulerwasp_exponentialsmoothing.wasp
Title produced by softwareExponential Smoothing
Date of computationSat, 12 Dec 2015 15:44:45 +0000
Cite this page as followsStatistical Computations at FreeStatistics.org, Office for Research Development and Education, URL https://freestatistics.org/blog/index.php?v=date/2015/Dec/12/t1449935093e9i3zg6qb3qalue.htm/, Retrieved Thu, 16 May 2024 13:05:17 +0000
Statistical Computations at FreeStatistics.org, Office for Research Development and Education, URL https://freestatistics.org/blog/index.php?pk=286105, Retrieved Thu, 16 May 2024 13:05:17 +0000
QR Codes:

Original text written by user:
IsPrivate?No (this computation is public)
User-defined keywords
Estimated Impact56
Family? (F = Feedback message, R = changed R code, M = changed R Module, P = changed Parameters, D = changed Data)
-       [Exponential Smoothing] [Triple] [2015-12-12 15:44:45] [d42bb29750b9700c1c3b9062bc539f05] [Current]
Feedback Forum

Post a new message
Dataseries X:
325.87
302.25
294
285.43
286.19
276.7
267.77
267.03
257.87
257.19
275.6
305.68
358.06
320.07
295.9
291.27
272.87
269.27
271.32
267.45
260.33
277.94
277.07
312.65
319.71
318.39
304.9
303.73
273.29
274.33
270.45
278.23
274.03
279
287.5
336.87
334.1
296.07
286.84
277.63
261.32
264.07
261.94
252.84
257.83
271.16
273.63
304.87
323.9
336.11
335.65
282.23
273.03
270.07
246.03
242.35
250.33
267.45
268.8
302.68
313.1
306.39
305.61
277.27
264.94
268.63
293.9
248.65
256
258.52
266.9
281.23
306
325.46
291.13
282.53
256.52
258.63
252.74
245.16
255.03
268.35
293.73
278.39


Summary of computational transaction
Raw Inputview raw input (R code)
Raw Outputview raw output of R engine
Computing time2 seconds
R Server'Sir Maurice George Kendall' @ kendall.wessa.net

\begin{tabular}{lllllllll}
\hline
Summary of computational transaction \tabularnewline
Raw Input & view raw input (R code)  \tabularnewline
Raw Output & view raw output of R engine  \tabularnewline
Computing time & 2 seconds \tabularnewline
R Server & 'Sir Maurice George Kendall' @ kendall.wessa.net \tabularnewline
\hline
\end{tabular}
%Source: https://freestatistics.org/blog/index.php?pk=286105&T=0

[TABLE]
[ROW][C]Summary of computational transaction[/C][/ROW]
[ROW][C]Raw Input[/C][C]view raw input (R code) [/C][/ROW]
[ROW][C]Raw Output[/C][C]view raw output of R engine [/C][/ROW]
[ROW][C]Computing time[/C][C]2 seconds[/C][/ROW]
[ROW][C]R Server[/C][C]'Sir Maurice George Kendall' @ kendall.wessa.net[/C][/ROW]
[/TABLE]
Source: https://freestatistics.org/blog/index.php?pk=286105&T=0

Globally Unique Identifier (entire table): ba.freestatistics.org/blog/index.php?pk=286105&T=0

As an alternative you can also use a QR Code:  

The GUIDs for individual cells are displayed in the table below:

Summary of computational transaction
Raw Inputview raw input (R code)
Raw Outputview raw output of R engine
Computing time2 seconds
R Server'Sir Maurice George Kendall' @ kendall.wessa.net


Estimated Parameters of Exponential Smoothing
ParameterValue
alpha0.0224935200424173
beta0.191709497844683
gamma0.355127583738585

\begin{tabular}{lllllllll}
\hline
Estimated Parameters of Exponential Smoothing \tabularnewline
Parameter & Value \tabularnewline
alpha & 0.0224935200424173 \tabularnewline
beta & 0.191709497844683 \tabularnewline
gamma & 0.355127583738585 \tabularnewline
\hline
\end{tabular}
%Source: https://freestatistics.org/blog/index.php?pk=286105&T=1

[TABLE]
[ROW][C]Estimated Parameters of Exponential Smoothing[/C][/ROW]
[ROW][C]Parameter[/C][C]Value[/C][/ROW]
[ROW][C]alpha[/C][C]0.0224935200424173[/C][/ROW]
[ROW][C]beta[/C][C]0.191709497844683[/C][/ROW]
[ROW][C]gamma[/C][C]0.355127583738585[/C][/ROW]
[/TABLE]
Source: https://freestatistics.org/blog/index.php?pk=286105&T=1

Globally Unique Identifier (entire table): ba.freestatistics.org/blog/index.php?pk=286105&T=1

As an alternative you can also use a QR Code:  

The GUIDs for individual cells are displayed in the table below:

Estimated Parameters of Exponential Smoothing
ParameterValue
alpha0.0224935200424173
beta0.191709497844683
gamma0.355127583738585


Interpolation Forecasts of Exponential Smoothing
tObservedFittedResiduals
13358.06358.427601495727-0.367601495726547
14320.07320.472590322409-0.402590322409139
15295.9296.380472735268-0.48047273526754
16291.27290.9774480603510.292551939648604
17272.87271.8643229801981.00567701980214
18269.27268.1457419619931.12425803800716
19271.32271.3063429645710.0136570354292189
20267.45268.698271533399-1.24827153339896
21260.33258.8985153967461.43148460325386
22277.94258.14437595371419.7956240462856
23277.07277.612840430247-0.542840430246997
24312.65308.8443970669743.80560293302631
25319.71361.65965043282-41.9496504328203
26318.39322.683190575425-4.29319057542517
27304.9298.3857704721426.51422952785816
28303.73293.34783822958710.382161770413
29273.29274.692136062717-1.40213606271686
30274.33270.9330941649333.39690583506649
31270.45273.741616839373-3.29161683937303
32278.23270.5892151364497.64078486355095
33274.03261.9260682341712.1039317658304
34279267.83934392015311.1606560798467
35287.5280.0684927751927.43150722480846
36336.87313.0385241145923.8314758854104
37334.1350.556716459476-16.4567164594761
38296.07325.47160182061-29.4016018206096
39286.84304.498688913814-17.6586889138141
40277.63300.293096971316-22.663096971316
41261.32276.694158920727-15.3741589207272
42264.07274.11738739636-10.0473873963602
43261.94274.07428858546-12.13428858546
44252.84274.252559633843-21.4125596338434
45257.83266.09445788597-8.26445788597039
46271.16270.7435180143760.416481985623818
47273.63280.911515880722-7.28151588072228
48304.87318.655289111072-13.7852891110725
49323.9340.591125070496-16.6911250704961
50336.11310.25544631305725.8545536869432
51335.65294.08853448215341.5614655178467
52282.23289.219821458304-6.98982145830377
53273.03268.3133325644834.71666743551651
54270.07267.9338670223972.13613297760264
55246.03267.389170340807-21.3591703408073
56242.35264.048104823096-21.6981048230956
57250.33260.355592481623-10.0255924816233
58267.45267.878728010091-0.42872801009139
59268.8275.251982420825-6.45198242082455
60302.68310.656822763135-7.97682276313498
61313.1331.639753151068-18.5397531510684
62306.39315.948978865261-9.55897886526054
63305.61304.2024711447541.40752885524569
64277.27281.167821265465-3.89782126546544
65264.94263.9993373023890.940662697610833
66268.63262.2275177685836.40248223141703
67293.9253.22942268439640.6705773156041
68248.65251.040237562142-2.39023756214209
69256251.7915477588484.2084522411522
70258.52262.985218655796-4.46521865579621
71266.9268.17827305769-1.27827305769023
72281.23303.193970664959-21.9639706649593
73306320.158969323193-14.158969323193
74325.46307.66670580647817.7932941935222
75291.13300.442694106667-9.31269410666675
76282.53275.3793229925327.15067700746795
77256.52260.240742170198-3.72074217019821
78258.63260.341738153278-1.71173815327836
79252.74263.103598799714-10.3635987997143
80245.16244.6449576088410.515042391158858
81255.03247.5914045197227.43859548027839
82268.35255.69980866663712.6501913333633
83293.73262.31101893179131.4189810682087
84278.39290.949222957964-12.5592229579642

\begin{tabular}{lllllllll}
\hline
Interpolation Forecasts of Exponential Smoothing \tabularnewline
t & Observed & Fitted & Residuals \tabularnewline
13 & 358.06 & 358.427601495727 & -0.367601495726547 \tabularnewline
14 & 320.07 & 320.472590322409 & -0.402590322409139 \tabularnewline
15 & 295.9 & 296.380472735268 & -0.48047273526754 \tabularnewline
16 & 291.27 & 290.977448060351 & 0.292551939648604 \tabularnewline
17 & 272.87 & 271.864322980198 & 1.00567701980214 \tabularnewline
18 & 269.27 & 268.145741961993 & 1.12425803800716 \tabularnewline
19 & 271.32 & 271.306342964571 & 0.0136570354292189 \tabularnewline
20 & 267.45 & 268.698271533399 & -1.24827153339896 \tabularnewline
21 & 260.33 & 258.898515396746 & 1.43148460325386 \tabularnewline
22 & 277.94 & 258.144375953714 & 19.7956240462856 \tabularnewline
23 & 277.07 & 277.612840430247 & -0.542840430246997 \tabularnewline
24 & 312.65 & 308.844397066974 & 3.80560293302631 \tabularnewline
25 & 319.71 & 361.65965043282 & -41.9496504328203 \tabularnewline
26 & 318.39 & 322.683190575425 & -4.29319057542517 \tabularnewline
27 & 304.9 & 298.385770472142 & 6.51422952785816 \tabularnewline
28 & 303.73 & 293.347838229587 & 10.382161770413 \tabularnewline
29 & 273.29 & 274.692136062717 & -1.40213606271686 \tabularnewline
30 & 274.33 & 270.933094164933 & 3.39690583506649 \tabularnewline
31 & 270.45 & 273.741616839373 & -3.29161683937303 \tabularnewline
32 & 278.23 & 270.589215136449 & 7.64078486355095 \tabularnewline
33 & 274.03 & 261.92606823417 & 12.1039317658304 \tabularnewline
34 & 279 & 267.839343920153 & 11.1606560798467 \tabularnewline
35 & 287.5 & 280.068492775192 & 7.43150722480846 \tabularnewline
36 & 336.87 & 313.03852411459 & 23.8314758854104 \tabularnewline
37 & 334.1 & 350.556716459476 & -16.4567164594761 \tabularnewline
38 & 296.07 & 325.47160182061 & -29.4016018206096 \tabularnewline
39 & 286.84 & 304.498688913814 & -17.6586889138141 \tabularnewline
40 & 277.63 & 300.293096971316 & -22.663096971316 \tabularnewline
41 & 261.32 & 276.694158920727 & -15.3741589207272 \tabularnewline
42 & 264.07 & 274.11738739636 & -10.0473873963602 \tabularnewline
43 & 261.94 & 274.07428858546 & -12.13428858546 \tabularnewline
44 & 252.84 & 274.252559633843 & -21.4125596338434 \tabularnewline
45 & 257.83 & 266.09445788597 & -8.26445788597039 \tabularnewline
46 & 271.16 & 270.743518014376 & 0.416481985623818 \tabularnewline
47 & 273.63 & 280.911515880722 & -7.28151588072228 \tabularnewline
48 & 304.87 & 318.655289111072 & -13.7852891110725 \tabularnewline
49 & 323.9 & 340.591125070496 & -16.6911250704961 \tabularnewline
50 & 336.11 & 310.255446313057 & 25.8545536869432 \tabularnewline
51 & 335.65 & 294.088534482153 & 41.5614655178467 \tabularnewline
52 & 282.23 & 289.219821458304 & -6.98982145830377 \tabularnewline
53 & 273.03 & 268.313332564483 & 4.71666743551651 \tabularnewline
54 & 270.07 & 267.933867022397 & 2.13613297760264 \tabularnewline
55 & 246.03 & 267.389170340807 & -21.3591703408073 \tabularnewline
56 & 242.35 & 264.048104823096 & -21.6981048230956 \tabularnewline
57 & 250.33 & 260.355592481623 & -10.0255924816233 \tabularnewline
58 & 267.45 & 267.878728010091 & -0.42872801009139 \tabularnewline
59 & 268.8 & 275.251982420825 & -6.45198242082455 \tabularnewline
60 & 302.68 & 310.656822763135 & -7.97682276313498 \tabularnewline
61 & 313.1 & 331.639753151068 & -18.5397531510684 \tabularnewline
62 & 306.39 & 315.948978865261 & -9.55897886526054 \tabularnewline
63 & 305.61 & 304.202471144754 & 1.40752885524569 \tabularnewline
64 & 277.27 & 281.167821265465 & -3.89782126546544 \tabularnewline
65 & 264.94 & 263.999337302389 & 0.940662697610833 \tabularnewline
66 & 268.63 & 262.227517768583 & 6.40248223141703 \tabularnewline
67 & 293.9 & 253.229422684396 & 40.6705773156041 \tabularnewline
68 & 248.65 & 251.040237562142 & -2.39023756214209 \tabularnewline
69 & 256 & 251.791547758848 & 4.2084522411522 \tabularnewline
70 & 258.52 & 262.985218655796 & -4.46521865579621 \tabularnewline
71 & 266.9 & 268.17827305769 & -1.27827305769023 \tabularnewline
72 & 281.23 & 303.193970664959 & -21.9639706649593 \tabularnewline
73 & 306 & 320.158969323193 & -14.158969323193 \tabularnewline
74 & 325.46 & 307.666705806478 & 17.7932941935222 \tabularnewline
75 & 291.13 & 300.442694106667 & -9.31269410666675 \tabularnewline
76 & 282.53 & 275.379322992532 & 7.15067700746795 \tabularnewline
77 & 256.52 & 260.240742170198 & -3.72074217019821 \tabularnewline
78 & 258.63 & 260.341738153278 & -1.71173815327836 \tabularnewline
79 & 252.74 & 263.103598799714 & -10.3635987997143 \tabularnewline
80 & 245.16 & 244.644957608841 & 0.515042391158858 \tabularnewline
81 & 255.03 & 247.591404519722 & 7.43859548027839 \tabularnewline
82 & 268.35 & 255.699808666637 & 12.6501913333633 \tabularnewline
83 & 293.73 & 262.311018931791 & 31.4189810682087 \tabularnewline
84 & 278.39 & 290.949222957964 & -12.5592229579642 \tabularnewline
\hline
\end{tabular}
%Source: https://freestatistics.org/blog/index.php?pk=286105&T=2

[TABLE]
[ROW][C]Interpolation Forecasts of Exponential Smoothing[/C][/ROW]
[ROW][C]t[/C][C]Observed[/C][C]Fitted[/C][C]Residuals[/C][/ROW]
[ROW][C]13[/C][C]358.06[/C][C]358.427601495727[/C][C]-0.367601495726547[/C][/ROW]
[ROW][C]14[/C][C]320.07[/C][C]320.472590322409[/C][C]-0.402590322409139[/C][/ROW]
[ROW][C]15[/C][C]295.9[/C][C]296.380472735268[/C][C]-0.48047273526754[/C][/ROW]
[ROW][C]16[/C][C]291.27[/C][C]290.977448060351[/C][C]0.292551939648604[/C][/ROW]
[ROW][C]17[/C][C]272.87[/C][C]271.864322980198[/C][C]1.00567701980214[/C][/ROW]
[ROW][C]18[/C][C]269.27[/C][C]268.145741961993[/C][C]1.12425803800716[/C][/ROW]
[ROW][C]19[/C][C]271.32[/C][C]271.306342964571[/C][C]0.0136570354292189[/C][/ROW]
[ROW][C]20[/C][C]267.45[/C][C]268.698271533399[/C][C]-1.24827153339896[/C][/ROW]
[ROW][C]21[/C][C]260.33[/C][C]258.898515396746[/C][C]1.43148460325386[/C][/ROW]
[ROW][C]22[/C][C]277.94[/C][C]258.144375953714[/C][C]19.7956240462856[/C][/ROW]
[ROW][C]23[/C][C]277.07[/C][C]277.612840430247[/C][C]-0.542840430246997[/C][/ROW]
[ROW][C]24[/C][C]312.65[/C][C]308.844397066974[/C][C]3.80560293302631[/C][/ROW]
[ROW][C]25[/C][C]319.71[/C][C]361.65965043282[/C][C]-41.9496504328203[/C][/ROW]
[ROW][C]26[/C][C]318.39[/C][C]322.683190575425[/C][C]-4.29319057542517[/C][/ROW]
[ROW][C]27[/C][C]304.9[/C][C]298.385770472142[/C][C]6.51422952785816[/C][/ROW]
[ROW][C]28[/C][C]303.73[/C][C]293.347838229587[/C][C]10.382161770413[/C][/ROW]
[ROW][C]29[/C][C]273.29[/C][C]274.692136062717[/C][C]-1.40213606271686[/C][/ROW]
[ROW][C]30[/C][C]274.33[/C][C]270.933094164933[/C][C]3.39690583506649[/C][/ROW]
[ROW][C]31[/C][C]270.45[/C][C]273.741616839373[/C][C]-3.29161683937303[/C][/ROW]
[ROW][C]32[/C][C]278.23[/C][C]270.589215136449[/C][C]7.64078486355095[/C][/ROW]
[ROW][C]33[/C][C]274.03[/C][C]261.92606823417[/C][C]12.1039317658304[/C][/ROW]
[ROW][C]34[/C][C]279[/C][C]267.839343920153[/C][C]11.1606560798467[/C][/ROW]
[ROW][C]35[/C][C]287.5[/C][C]280.068492775192[/C][C]7.43150722480846[/C][/ROW]
[ROW][C]36[/C][C]336.87[/C][C]313.03852411459[/C][C]23.8314758854104[/C][/ROW]
[ROW][C]37[/C][C]334.1[/C][C]350.556716459476[/C][C]-16.4567164594761[/C][/ROW]
[ROW][C]38[/C][C]296.07[/C][C]325.47160182061[/C][C]-29.4016018206096[/C][/ROW]
[ROW][C]39[/C][C]286.84[/C][C]304.498688913814[/C][C]-17.6586889138141[/C][/ROW]
[ROW][C]40[/C][C]277.63[/C][C]300.293096971316[/C][C]-22.663096971316[/C][/ROW]
[ROW][C]41[/C][C]261.32[/C][C]276.694158920727[/C][C]-15.3741589207272[/C][/ROW]
[ROW][C]42[/C][C]264.07[/C][C]274.11738739636[/C][C]-10.0473873963602[/C][/ROW]
[ROW][C]43[/C][C]261.94[/C][C]274.07428858546[/C][C]-12.13428858546[/C][/ROW]
[ROW][C]44[/C][C]252.84[/C][C]274.252559633843[/C][C]-21.4125596338434[/C][/ROW]
[ROW][C]45[/C][C]257.83[/C][C]266.09445788597[/C][C]-8.26445788597039[/C][/ROW]
[ROW][C]46[/C][C]271.16[/C][C]270.743518014376[/C][C]0.416481985623818[/C][/ROW]
[ROW][C]47[/C][C]273.63[/C][C]280.911515880722[/C][C]-7.28151588072228[/C][/ROW]
[ROW][C]48[/C][C]304.87[/C][C]318.655289111072[/C][C]-13.7852891110725[/C][/ROW]
[ROW][C]49[/C][C]323.9[/C][C]340.591125070496[/C][C]-16.6911250704961[/C][/ROW]
[ROW][C]50[/C][C]336.11[/C][C]310.255446313057[/C][C]25.8545536869432[/C][/ROW]
[ROW][C]51[/C][C]335.65[/C][C]294.088534482153[/C][C]41.5614655178467[/C][/ROW]
[ROW][C]52[/C][C]282.23[/C][C]289.219821458304[/C][C]-6.98982145830377[/C][/ROW]
[ROW][C]53[/C][C]273.03[/C][C]268.313332564483[/C][C]4.71666743551651[/C][/ROW]
[ROW][C]54[/C][C]270.07[/C][C]267.933867022397[/C][C]2.13613297760264[/C][/ROW]
[ROW][C]55[/C][C]246.03[/C][C]267.389170340807[/C][C]-21.3591703408073[/C][/ROW]
[ROW][C]56[/C][C]242.35[/C][C]264.048104823096[/C][C]-21.6981048230956[/C][/ROW]
[ROW][C]57[/C][C]250.33[/C][C]260.355592481623[/C][C]-10.0255924816233[/C][/ROW]
[ROW][C]58[/C][C]267.45[/C][C]267.878728010091[/C][C]-0.42872801009139[/C][/ROW]
[ROW][C]59[/C][C]268.8[/C][C]275.251982420825[/C][C]-6.45198242082455[/C][/ROW]
[ROW][C]60[/C][C]302.68[/C][C]310.656822763135[/C][C]-7.97682276313498[/C][/ROW]
[ROW][C]61[/C][C]313.1[/C][C]331.639753151068[/C][C]-18.5397531510684[/C][/ROW]
[ROW][C]62[/C][C]306.39[/C][C]315.948978865261[/C][C]-9.55897886526054[/C][/ROW]
[ROW][C]63[/C][C]305.61[/C][C]304.202471144754[/C][C]1.40752885524569[/C][/ROW]
[ROW][C]64[/C][C]277.27[/C][C]281.167821265465[/C][C]-3.89782126546544[/C][/ROW]
[ROW][C]65[/C][C]264.94[/C][C]263.999337302389[/C][C]0.940662697610833[/C][/ROW]
[ROW][C]66[/C][C]268.63[/C][C]262.227517768583[/C][C]6.40248223141703[/C][/ROW]
[ROW][C]67[/C][C]293.9[/C][C]253.229422684396[/C][C]40.6705773156041[/C][/ROW]
[ROW][C]68[/C][C]248.65[/C][C]251.040237562142[/C][C]-2.39023756214209[/C][/ROW]
[ROW][C]69[/C][C]256[/C][C]251.791547758848[/C][C]4.2084522411522[/C][/ROW]
[ROW][C]70[/C][C]258.52[/C][C]262.985218655796[/C][C]-4.46521865579621[/C][/ROW]
[ROW][C]71[/C][C]266.9[/C][C]268.17827305769[/C][C]-1.27827305769023[/C][/ROW]
[ROW][C]72[/C][C]281.23[/C][C]303.193970664959[/C][C]-21.9639706649593[/C][/ROW]
[ROW][C]73[/C][C]306[/C][C]320.158969323193[/C][C]-14.158969323193[/C][/ROW]
[ROW][C]74[/C][C]325.46[/C][C]307.666705806478[/C][C]17.7932941935222[/C][/ROW]
[ROW][C]75[/C][C]291.13[/C][C]300.442694106667[/C][C]-9.31269410666675[/C][/ROW]
[ROW][C]76[/C][C]282.53[/C][C]275.379322992532[/C][C]7.15067700746795[/C][/ROW]
[ROW][C]77[/C][C]256.52[/C][C]260.240742170198[/C][C]-3.72074217019821[/C][/ROW]
[ROW][C]78[/C][C]258.63[/C][C]260.341738153278[/C][C]-1.71173815327836[/C][/ROW]
[ROW][C]79[/C][C]252.74[/C][C]263.103598799714[/C][C]-10.3635987997143[/C][/ROW]
[ROW][C]80[/C][C]245.16[/C][C]244.644957608841[/C][C]0.515042391158858[/C][/ROW]
[ROW][C]81[/C][C]255.03[/C][C]247.591404519722[/C][C]7.43859548027839[/C][/ROW]
[ROW][C]82[/C][C]268.35[/C][C]255.699808666637[/C][C]12.6501913333633[/C][/ROW]
[ROW][C]83[/C][C]293.73[/C][C]262.311018931791[/C][C]31.4189810682087[/C][/ROW]
[ROW][C]84[/C][C]278.39[/C][C]290.949222957964[/C][C]-12.5592229579642[/C][/ROW]
[/TABLE]
Source: https://freestatistics.org/blog/index.php?pk=286105&T=2

Globally Unique Identifier (entire table): ba.freestatistics.org/blog/index.php?pk=286105&T=2

As an alternative you can also use a QR Code:  

The GUIDs for individual cells are displayed in the table below:

Interpolation Forecasts of Exponential Smoothing
tObservedFittedResiduals
13358.06358.427601495727-0.367601495726547
14320.07320.472590322409-0.402590322409139
15295.9296.380472735268-0.48047273526754
16291.27290.9774480603510.292551939648604
17272.87271.8643229801981.00567701980214
18269.27268.1457419619931.12425803800716
19271.32271.3063429645710.0136570354292189
20267.45268.698271533399-1.24827153339896
21260.33258.8985153967461.43148460325386
22277.94258.14437595371419.7956240462856
23277.07277.612840430247-0.542840430246997
24312.65308.8443970669743.80560293302631
25319.71361.65965043282-41.9496504328203
26318.39322.683190575425-4.29319057542517
27304.9298.3857704721426.51422952785816
28303.73293.34783822958710.382161770413
29273.29274.692136062717-1.40213606271686
30274.33270.9330941649333.39690583506649
31270.45273.741616839373-3.29161683937303
32278.23270.5892151364497.64078486355095
33274.03261.9260682341712.1039317658304
34279267.83934392015311.1606560798467
35287.5280.0684927751927.43150722480846
36336.87313.0385241145923.8314758854104
37334.1350.556716459476-16.4567164594761
38296.07325.47160182061-29.4016018206096
39286.84304.498688913814-17.6586889138141
40277.63300.293096971316-22.663096971316
41261.32276.694158920727-15.3741589207272
42264.07274.11738739636-10.0473873963602
43261.94274.07428858546-12.13428858546
44252.84274.252559633843-21.4125596338434
45257.83266.09445788597-8.26445788597039
46271.16270.7435180143760.416481985623818
47273.63280.911515880722-7.28151588072228
48304.87318.655289111072-13.7852891110725
49323.9340.591125070496-16.6911250704961
50336.11310.25544631305725.8545536869432
51335.65294.08853448215341.5614655178467
52282.23289.219821458304-6.98982145830377
53273.03268.3133325644834.71666743551651
54270.07267.9338670223972.13613297760264
55246.03267.389170340807-21.3591703408073
56242.35264.048104823096-21.6981048230956
57250.33260.355592481623-10.0255924816233
58267.45267.878728010091-0.42872801009139
59268.8275.251982420825-6.45198242082455
60302.68310.656822763135-7.97682276313498
61313.1331.639753151068-18.5397531510684
62306.39315.948978865261-9.55897886526054
63305.61304.2024711447541.40752885524569
64277.27281.167821265465-3.89782126546544
65264.94263.9993373023890.940662697610833
66268.63262.2275177685836.40248223141703
67293.9253.22942268439640.6705773156041
68248.65251.040237562142-2.39023756214209
69256251.7915477588484.2084522411522
70258.52262.985218655796-4.46521865579621
71266.9268.17827305769-1.27827305769023
72281.23303.193970664959-21.9639706649593
73306320.158969323193-14.158969323193
74325.46307.66670580647817.7932941935222
75291.13300.442694106667-9.31269410666675
76282.53275.3793229925327.15067700746795
77256.52260.240742170198-3.72074217019821
78258.63260.341738153278-1.71173815327836
79252.74263.103598799714-10.3635987997143
80245.16244.6449576088410.515042391158858
81255.03247.5914045197227.43859548027839
82268.35255.69980866663712.6501913333633
83293.73262.31101893179131.4189810682087
84278.39290.949222957964-12.5592229579642


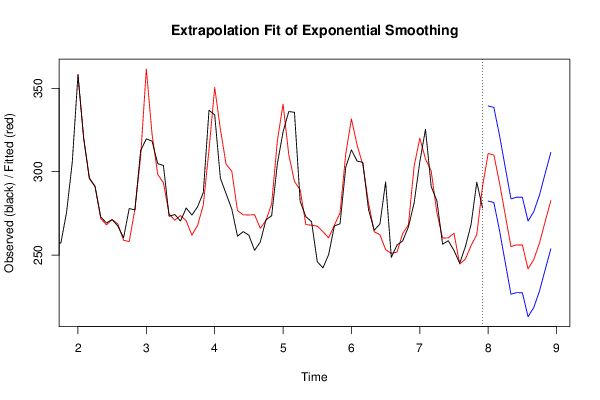
Extrapolation Forecasts of Exponential Smoothing
tForecast95% Lower Bound95% Upper Bound
85310.943600325451282.421095336281339.466105314621
86310.031180171647281.498429631363338.563930711931
87293.090111478284264.543559669953321.636663286615
88274.084197126968245.519763878119302.648630375818
89255.112932770857226.526016372674283.69984916904
90256.113130221407227.498611129734284.727649313079
91256.035576775715227.387822175802284.683331375629
92241.756631348582213.069500659368270.443762037796
93247.262886749982218.529738136351275.996035363614
94257.148999432941228.362697385758285.935301480124
95270.072378371782241.225302405719298.919454337845
96282.683128381033253.767182889154311.599073872912

\begin{tabular}{lllllllll}
\hline
Extrapolation Forecasts of Exponential Smoothing \tabularnewline
t & Forecast & 95% Lower Bound & 95% Upper Bound \tabularnewline
85 & 310.943600325451 & 282.421095336281 & 339.466105314621 \tabularnewline
86 & 310.031180171647 & 281.498429631363 & 338.563930711931 \tabularnewline
87 & 293.090111478284 & 264.543559669953 & 321.636663286615 \tabularnewline
88 & 274.084197126968 & 245.519763878119 & 302.648630375818 \tabularnewline
89 & 255.112932770857 & 226.526016372674 & 283.69984916904 \tabularnewline
90 & 256.113130221407 & 227.498611129734 & 284.727649313079 \tabularnewline
91 & 256.035576775715 & 227.387822175802 & 284.683331375629 \tabularnewline
92 & 241.756631348582 & 213.069500659368 & 270.443762037796 \tabularnewline
93 & 247.262886749982 & 218.529738136351 & 275.996035363614 \tabularnewline
94 & 257.148999432941 & 228.362697385758 & 285.935301480124 \tabularnewline
95 & 270.072378371782 & 241.225302405719 & 298.919454337845 \tabularnewline
96 & 282.683128381033 & 253.767182889154 & 311.599073872912 \tabularnewline
\hline
\end{tabular}
%Source: https://freestatistics.org/blog/index.php?pk=286105&T=3

[TABLE]
[ROW][C]Extrapolation Forecasts of Exponential Smoothing[/C][/ROW]
[ROW][C]t[/C][C]Forecast[/C][C]95% Lower Bound[/C][C]95% Upper Bound[/C][/ROW]
[ROW][C]85[/C][C]310.943600325451[/C][C]282.421095336281[/C][C]339.466105314621[/C][/ROW]
[ROW][C]86[/C][C]310.031180171647[/C][C]281.498429631363[/C][C]338.563930711931[/C][/ROW]
[ROW][C]87[/C][C]293.090111478284[/C][C]264.543559669953[/C][C]321.636663286615[/C][/ROW]
[ROW][C]88[/C][C]274.084197126968[/C][C]245.519763878119[/C][C]302.648630375818[/C][/ROW]
[ROW][C]89[/C][C]255.112932770857[/C][C]226.526016372674[/C][C]283.69984916904[/C][/ROW]
[ROW][C]90[/C][C]256.113130221407[/C][C]227.498611129734[/C][C]284.727649313079[/C][/ROW]
[ROW][C]91[/C][C]256.035576775715[/C][C]227.387822175802[/C][C]284.683331375629[/C][/ROW]
[ROW][C]92[/C][C]241.756631348582[/C][C]213.069500659368[/C][C]270.443762037796[/C][/ROW]
[ROW][C]93[/C][C]247.262886749982[/C][C]218.529738136351[/C][C]275.996035363614[/C][/ROW]
[ROW][C]94[/C][C]257.148999432941[/C][C]228.362697385758[/C][C]285.935301480124[/C][/ROW]
[ROW][C]95[/C][C]270.072378371782[/C][C]241.225302405719[/C][C]298.919454337845[/C][/ROW]
[ROW][C]96[/C][C]282.683128381033[/C][C]253.767182889154[/C][C]311.599073872912[/C][/ROW]
[/TABLE]
Source: https://freestatistics.org/blog/index.php?pk=286105&T=3

Globally Unique Identifier (entire table): ba.freestatistics.org/blog/index.php?pk=286105&T=3

As an alternative you can also use a QR Code:  

The GUIDs for individual cells are displayed in the table below:

Extrapolation Forecasts of Exponential Smoothing
tForecast95% Lower Bound95% Upper Bound
85310.943600325451282.421095336281339.466105314621
86310.031180171647281.498429631363338.563930711931
87293.090111478284264.543559669953321.636663286615
88274.084197126968245.519763878119302.648630375818
89255.112932770857226.526016372674283.69984916904
90256.113130221407227.498611129734284.727649313079
91256.035576775715227.387822175802284.683331375629
92241.756631348582213.069500659368270.443762037796
93247.262886749982218.529738136351275.996035363614
94257.148999432941228.362697385758285.935301480124
95270.072378371782241.225302405719298.919454337845
96282.683128381033253.767182889154311.599073872912


Parameters (Session):
par1 = 1 ; par2 = 2 ; par3 = 0.95 ; par4 = two.sided ; par5 = unpaired ; par6 = 0.0 ;
Parameters (R input):
par1 = 12 ; par2 = Triple ; par3 = additive ;
R code (references can be found in the software module):
par1 <- as.numeric(par1)
if (par2 == 'Single') K <- 1
if (par2 == 'Double') K <- 2
if (par2 == 'Triple') K <- par1
nx <- length(x)
nxmK <- nx - K
x <- ts(x, frequency = par1)
if (par2 == 'Single') fit <- HoltWinters(x, gamma=F, beta=F)
if (par2 == 'Double') fit <- HoltWinters(x, gamma=F)
if (par2 == 'Triple') fit <- HoltWinters(x, seasonal=par3)
fit
myresid <- x - fit$fitted[,'xhat']
bitmap(file='test1.png')
op <- par(mfrow=c(2,1))
plot(fit,ylab='Observed (black) / Fitted (red)',main='Interpolation Fit of Exponential Smoothing')
plot(myresid,ylab='Residuals',main='Interpolation Prediction Errors')
par(op)
dev.off()
bitmap(file='test2.png')
p <- predict(fit, par1, prediction.interval=TRUE)
np <- length(p[,1])
plot(fit,p,ylab='Observed (black) / Fitted (red)',main='Extrapolation Fit of Exponential Smoothing')
dev.off()
bitmap(file='test3.png')
op <- par(mfrow = c(2,2))
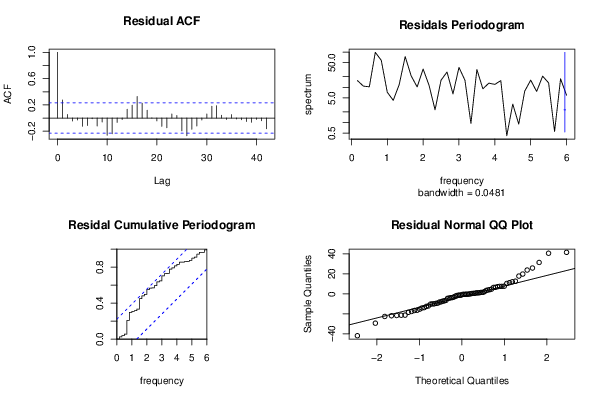
acf(as.numeric(myresid),lag.max = nx/2,main='Residual ACF')
spectrum(myresid,main='Residals Periodogram')
cpgram(myresid,main='Residal Cumulative Periodogram')
qqnorm(myresid,main='Residual Normal QQ Plot')
qqline(myresid)
par(op)
dev.off()
load(file='createtable')
a<-table.start()
a<-table.row.start(a)
a<-table.element(a,'Estimated Parameters of Exponential Smoothing',2,TRUE)
a<-table.row.end(a)
a<-table.row.start(a)
a<-table.element(a,'Parameter',header=TRUE)
a<-table.element(a,'Value',header=TRUE)
a<-table.row.end(a)
a<-table.row.start(a)
a<-table.element(a,'alpha',header=TRUE)
a<-table.element(a,fit$alpha)
a<-table.row.end(a)
a<-table.row.start(a)
a<-table.element(a,'beta',header=TRUE)
a<-table.element(a,fit$beta)
a<-table.row.end(a)
a<-table.row.start(a)
a<-table.element(a,'gamma',header=TRUE)
a<-table.element(a,fit$gamma)
a<-table.row.end(a)
a<-table.end(a)
table.save(a,file='mytable.tab')
a<-table.start()
a<-table.row.start(a)
a<-table.element(a,'Interpolation Forecasts of Exponential Smoothing',4,TRUE)
a<-table.row.end(a)
a<-table.row.start(a)
a<-table.element(a,'t',header=TRUE)
a<-table.element(a,'Observed',header=TRUE)
a<-table.element(a,'Fitted',header=TRUE)
a<-table.element(a,'Residuals',header=TRUE)
a<-table.row.end(a)
for (i in 1:nxmK) {
a<-table.row.start(a)
a<-table.element(a,i+K,header=TRUE)
a<-table.element(a,x[i+K])
a<-table.element(a,fit$fitted[i,'xhat'])
a<-table.element(a,myresid[i])
a<-table.row.end(a)
}
a<-table.end(a)
table.save(a,file='mytable1.tab')
a<-table.start()
a<-table.row.start(a)
a<-table.element(a,'Extrapolation Forecasts of Exponential Smoothing',4,TRUE)
a<-table.row.end(a)
a<-table.row.start(a)
a<-table.element(a,'t',header=TRUE)
a<-table.element(a,'Forecast',header=TRUE)
a<-table.element(a,'95% Lower Bound',header=TRUE)
a<-table.element(a,'95% Upper Bound',header=TRUE)
a<-table.row.end(a)
for (i in 1:np) {
a<-table.row.start(a)
a<-table.element(a,nx+i,header=TRUE)
a<-table.element(a,p[i,'fit'])
a<-table.element(a,p[i,'lwr'])
a<-table.element(a,p[i,'upr'])
a<-table.row.end(a)
}
a<-table.end(a)
table.save(a,file='mytable2.tab')