Free Statistics

of Irreproducible Research!

Author's title

Author*Unverified author*
R Software Modulerwasp_autocorrelation.wasp
Title produced by software(Partial) Autocorrelation Function
Date of computationSat, 12 Dec 2015 16:12:15 +0000
Cite this page as followsStatistical Computations at FreeStatistics.org, Office for Research Development and Education, URL https://freestatistics.org/blog/index.php?v=date/2015/Dec/12/t1449936905c86ti401ucgut5n.htm/, Retrieved Thu, 16 May 2024 10:26:35 +0000
Statistical Computations at FreeStatistics.org, Office for Research Development and Education, URL https://freestatistics.org/blog/index.php?pk=286108, Retrieved Thu, 16 May 2024 10:26:35 +0000
QR Codes:

Original text written by user:
IsPrivate?No (this computation is public)
User-defined keywords
Estimated Impact51
Family? (F = Feedback message, R = changed R code, M = changed R Module, P = changed Parameters, D = changed Data)
-       [(Partial) Autocorrelation Function] [Autocorrelatie we...] [2015-12-12 16:12:15] [ad5e328aab07d5d247de986d4dfd18ff] [Current]
Feedback Forum

Post a new message
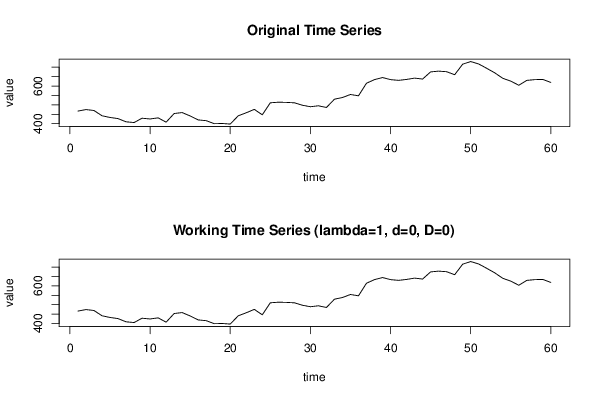
Dataseries X:
467
475
470
442
433
427
410
406
429
425
431
408
454
459
441
420
416
400
401
398
442
458
476
447
511
514
513
511
498
490
495
486
530
539
555
548
615
634
645
634
630
635
642
637
675
679
676
660
716
730
717
694
670
641
626
604
630
634
635
619


Summary of computational transaction
Raw Inputview raw input (R code)
Raw Outputview raw output of R engine
Computing time1 seconds
R Server'Gertrude Mary Cox' @ cox.wessa.net

\begin{tabular}{lllllllll}
\hline
Summary of computational transaction \tabularnewline
Raw Input & view raw input (R code)  \tabularnewline
Raw Output & view raw output of R engine  \tabularnewline
Computing time & 1 seconds \tabularnewline
R Server & 'Gertrude Mary Cox' @ cox.wessa.net \tabularnewline
\hline
\end{tabular}
%Source: https://freestatistics.org/blog/index.php?pk=286108&T=0

[TABLE]
[ROW][C]Summary of computational transaction[/C][/ROW]
[ROW][C]Raw Input[/C][C]view raw input (R code) [/C][/ROW]
[ROW][C]Raw Output[/C][C]view raw output of R engine [/C][/ROW]
[ROW][C]Computing time[/C][C]1 seconds[/C][/ROW]
[ROW][C]R Server[/C][C]'Gertrude Mary Cox' @ cox.wessa.net[/C][/ROW]
[/TABLE]
Source: https://freestatistics.org/blog/index.php?pk=286108&T=0

Globally Unique Identifier (entire table): ba.freestatistics.org/blog/index.php?pk=286108&T=0

As an alternative you can also use a QR Code:  

The GUIDs for individual cells are displayed in the table below:

Summary of computational transaction
Raw Inputview raw input (R code)
Raw Outputview raw output of R engine
Computing time1 seconds
R Server'Gertrude Mary Cox' @ cox.wessa.net


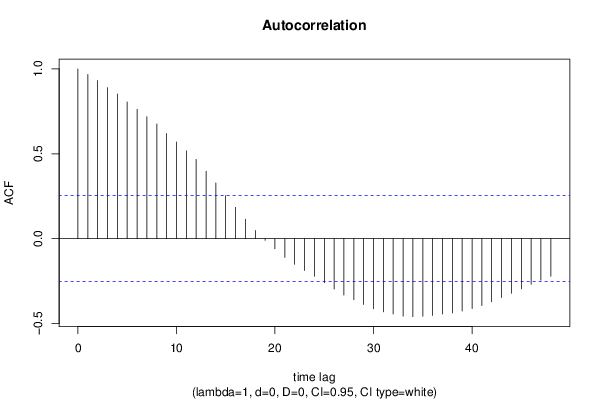
Autocorrelation Function
Time lag kACF(k)T-STATP-value
10.9670147.49050
20.9312527.21340
30.8898846.8930
40.8520926.60030
50.8058026.24170
60.7628845.90930
70.7178945.56080
80.6756695.23371e-06
90.6199354.8025e-06
100.5695384.41162.2e-05
110.5174454.00818.6e-05
120.4670073.61740.000306
130.3972123.07680.001575
140.3282972.5430.006794
150.2534371.96310.027137
160.1843761.42820.079214
170.1140910.88370.190181
180.0484570.37540.354362
19-0.010015-0.07760.469212
20-0.059097-0.45780.324388
21-0.110397-0.85510.197939
22-0.151294-1.17190.122931
23-0.187632-1.45340.075663
24-0.221649-1.71690.045579
25-0.259556-2.01050.024439
26-0.296635-2.29770.01254
27-0.331953-2.57130.006314
28-0.360297-2.79090.003519
29-0.388033-3.00570.001932
30-0.413004-3.19910.001102
31-0.431389-3.34150.000719
32-0.444403-3.44230.000528
33-0.456781-3.53820.000392
34-0.459659-3.56050.000366
35-0.45722-3.54160.000388
36-0.452787-3.50730.000432
37-0.443955-3.43890.000534
38-0.43745-3.38850.000623
39-0.426817-3.30618e-04
40-0.412071-3.19190.001125
41-0.393624-3.0490.001707
42-0.372165-2.88280.002732
43-0.346573-2.68450.004688
44-0.32172-2.4920.007741
45-0.295821-2.29140.012733
46-0.269083-2.08430.020699
47-0.244606-1.89470.031476
48-0.221789-1.7180.04548

\begin{tabular}{lllllllll}
\hline
Autocorrelation Function \tabularnewline
Time lag k & ACF(k) & T-STAT & P-value \tabularnewline
1 & 0.967014 & 7.4905 & 0 \tabularnewline
2 & 0.931252 & 7.2134 & 0 \tabularnewline
3 & 0.889884 & 6.893 & 0 \tabularnewline
4 & 0.852092 & 6.6003 & 0 \tabularnewline
5 & 0.805802 & 6.2417 & 0 \tabularnewline
6 & 0.762884 & 5.9093 & 0 \tabularnewline
7 & 0.717894 & 5.5608 & 0 \tabularnewline
8 & 0.675669 & 5.2337 & 1e-06 \tabularnewline
9 & 0.619935 & 4.802 & 5e-06 \tabularnewline
10 & 0.569538 & 4.4116 & 2.2e-05 \tabularnewline
11 & 0.517445 & 4.0081 & 8.6e-05 \tabularnewline
12 & 0.467007 & 3.6174 & 0.000306 \tabularnewline
13 & 0.397212 & 3.0768 & 0.001575 \tabularnewline
14 & 0.328297 & 2.543 & 0.006794 \tabularnewline
15 & 0.253437 & 1.9631 & 0.027137 \tabularnewline
16 & 0.184376 & 1.4282 & 0.079214 \tabularnewline
17 & 0.114091 & 0.8837 & 0.190181 \tabularnewline
18 & 0.048457 & 0.3754 & 0.354362 \tabularnewline
19 & -0.010015 & -0.0776 & 0.469212 \tabularnewline
20 & -0.059097 & -0.4578 & 0.324388 \tabularnewline
21 & -0.110397 & -0.8551 & 0.197939 \tabularnewline
22 & -0.151294 & -1.1719 & 0.122931 \tabularnewline
23 & -0.187632 & -1.4534 & 0.075663 \tabularnewline
24 & -0.221649 & -1.7169 & 0.045579 \tabularnewline
25 & -0.259556 & -2.0105 & 0.024439 \tabularnewline
26 & -0.296635 & -2.2977 & 0.01254 \tabularnewline
27 & -0.331953 & -2.5713 & 0.006314 \tabularnewline
28 & -0.360297 & -2.7909 & 0.003519 \tabularnewline
29 & -0.388033 & -3.0057 & 0.001932 \tabularnewline
30 & -0.413004 & -3.1991 & 0.001102 \tabularnewline
31 & -0.431389 & -3.3415 & 0.000719 \tabularnewline
32 & -0.444403 & -3.4423 & 0.000528 \tabularnewline
33 & -0.456781 & -3.5382 & 0.000392 \tabularnewline
34 & -0.459659 & -3.5605 & 0.000366 \tabularnewline
35 & -0.45722 & -3.5416 & 0.000388 \tabularnewline
36 & -0.452787 & -3.5073 & 0.000432 \tabularnewline
37 & -0.443955 & -3.4389 & 0.000534 \tabularnewline
38 & -0.43745 & -3.3885 & 0.000623 \tabularnewline
39 & -0.426817 & -3.3061 & 8e-04 \tabularnewline
40 & -0.412071 & -3.1919 & 0.001125 \tabularnewline
41 & -0.393624 & -3.049 & 0.001707 \tabularnewline
42 & -0.372165 & -2.8828 & 0.002732 \tabularnewline
43 & -0.346573 & -2.6845 & 0.004688 \tabularnewline
44 & -0.32172 & -2.492 & 0.007741 \tabularnewline
45 & -0.295821 & -2.2914 & 0.012733 \tabularnewline
46 & -0.269083 & -2.0843 & 0.020699 \tabularnewline
47 & -0.244606 & -1.8947 & 0.031476 \tabularnewline
48 & -0.221789 & -1.718 & 0.04548 \tabularnewline
\hline
\end{tabular}
%Source: https://freestatistics.org/blog/index.php?pk=286108&T=1

[TABLE]
[ROW][C]Autocorrelation Function[/C][/ROW]
[ROW][C]Time lag k[/C][C]ACF(k)[/C][C]T-STAT[/C][C]P-value[/C][/ROW]
[ROW][C]1[/C][C]0.967014[/C][C]7.4905[/C][C]0[/C][/ROW]
[ROW][C]2[/C][C]0.931252[/C][C]7.2134[/C][C]0[/C][/ROW]
[ROW][C]3[/C][C]0.889884[/C][C]6.893[/C][C]0[/C][/ROW]
[ROW][C]4[/C][C]0.852092[/C][C]6.6003[/C][C]0[/C][/ROW]
[ROW][C]5[/C][C]0.805802[/C][C]6.2417[/C][C]0[/C][/ROW]
[ROW][C]6[/C][C]0.762884[/C][C]5.9093[/C][C]0[/C][/ROW]
[ROW][C]7[/C][C]0.717894[/C][C]5.5608[/C][C]0[/C][/ROW]
[ROW][C]8[/C][C]0.675669[/C][C]5.2337[/C][C]1e-06[/C][/ROW]
[ROW][C]9[/C][C]0.619935[/C][C]4.802[/C][C]5e-06[/C][/ROW]
[ROW][C]10[/C][C]0.569538[/C][C]4.4116[/C][C]2.2e-05[/C][/ROW]
[ROW][C]11[/C][C]0.517445[/C][C]4.0081[/C][C]8.6e-05[/C][/ROW]
[ROW][C]12[/C][C]0.467007[/C][C]3.6174[/C][C]0.000306[/C][/ROW]
[ROW][C]13[/C][C]0.397212[/C][C]3.0768[/C][C]0.001575[/C][/ROW]
[ROW][C]14[/C][C]0.328297[/C][C]2.543[/C][C]0.006794[/C][/ROW]
[ROW][C]15[/C][C]0.253437[/C][C]1.9631[/C][C]0.027137[/C][/ROW]
[ROW][C]16[/C][C]0.184376[/C][C]1.4282[/C][C]0.079214[/C][/ROW]
[ROW][C]17[/C][C]0.114091[/C][C]0.8837[/C][C]0.190181[/C][/ROW]
[ROW][C]18[/C][C]0.048457[/C][C]0.3754[/C][C]0.354362[/C][/ROW]
[ROW][C]19[/C][C]-0.010015[/C][C]-0.0776[/C][C]0.469212[/C][/ROW]
[ROW][C]20[/C][C]-0.059097[/C][C]-0.4578[/C][C]0.324388[/C][/ROW]
[ROW][C]21[/C][C]-0.110397[/C][C]-0.8551[/C][C]0.197939[/C][/ROW]
[ROW][C]22[/C][C]-0.151294[/C][C]-1.1719[/C][C]0.122931[/C][/ROW]
[ROW][C]23[/C][C]-0.187632[/C][C]-1.4534[/C][C]0.075663[/C][/ROW]
[ROW][C]24[/C][C]-0.221649[/C][C]-1.7169[/C][C]0.045579[/C][/ROW]
[ROW][C]25[/C][C]-0.259556[/C][C]-2.0105[/C][C]0.024439[/C][/ROW]
[ROW][C]26[/C][C]-0.296635[/C][C]-2.2977[/C][C]0.01254[/C][/ROW]
[ROW][C]27[/C][C]-0.331953[/C][C]-2.5713[/C][C]0.006314[/C][/ROW]
[ROW][C]28[/C][C]-0.360297[/C][C]-2.7909[/C][C]0.003519[/C][/ROW]
[ROW][C]29[/C][C]-0.388033[/C][C]-3.0057[/C][C]0.001932[/C][/ROW]
[ROW][C]30[/C][C]-0.413004[/C][C]-3.1991[/C][C]0.001102[/C][/ROW]
[ROW][C]31[/C][C]-0.431389[/C][C]-3.3415[/C][C]0.000719[/C][/ROW]
[ROW][C]32[/C][C]-0.444403[/C][C]-3.4423[/C][C]0.000528[/C][/ROW]
[ROW][C]33[/C][C]-0.456781[/C][C]-3.5382[/C][C]0.000392[/C][/ROW]
[ROW][C]34[/C][C]-0.459659[/C][C]-3.5605[/C][C]0.000366[/C][/ROW]
[ROW][C]35[/C][C]-0.45722[/C][C]-3.5416[/C][C]0.000388[/C][/ROW]
[ROW][C]36[/C][C]-0.452787[/C][C]-3.5073[/C][C]0.000432[/C][/ROW]
[ROW][C]37[/C][C]-0.443955[/C][C]-3.4389[/C][C]0.000534[/C][/ROW]
[ROW][C]38[/C][C]-0.43745[/C][C]-3.3885[/C][C]0.000623[/C][/ROW]
[ROW][C]39[/C][C]-0.426817[/C][C]-3.3061[/C][C]8e-04[/C][/ROW]
[ROW][C]40[/C][C]-0.412071[/C][C]-3.1919[/C][C]0.001125[/C][/ROW]
[ROW][C]41[/C][C]-0.393624[/C][C]-3.049[/C][C]0.001707[/C][/ROW]
[ROW][C]42[/C][C]-0.372165[/C][C]-2.8828[/C][C]0.002732[/C][/ROW]
[ROW][C]43[/C][C]-0.346573[/C][C]-2.6845[/C][C]0.004688[/C][/ROW]
[ROW][C]44[/C][C]-0.32172[/C][C]-2.492[/C][C]0.007741[/C][/ROW]
[ROW][C]45[/C][C]-0.295821[/C][C]-2.2914[/C][C]0.012733[/C][/ROW]
[ROW][C]46[/C][C]-0.269083[/C][C]-2.0843[/C][C]0.020699[/C][/ROW]
[ROW][C]47[/C][C]-0.244606[/C][C]-1.8947[/C][C]0.031476[/C][/ROW]
[ROW][C]48[/C][C]-0.221789[/C][C]-1.718[/C][C]0.04548[/C][/ROW]
[/TABLE]
Source: https://freestatistics.org/blog/index.php?pk=286108&T=1

Globally Unique Identifier (entire table): ba.freestatistics.org/blog/index.php?pk=286108&T=1

As an alternative you can also use a QR Code:  

The GUIDs for individual cells are displayed in the table below:

Autocorrelation Function
Time lag kACF(k)T-STATP-value
10.9670147.49050
20.9312527.21340
30.8898846.8930
40.8520926.60030
50.8058026.24170
60.7628845.90930
70.7178945.56080
80.6756695.23371e-06
90.6199354.8025e-06
100.5695384.41162.2e-05
110.5174454.00818.6e-05
120.4670073.61740.000306
130.3972123.07680.001575
140.3282972.5430.006794
150.2534371.96310.027137
160.1843761.42820.079214
170.1140910.88370.190181
180.0484570.37540.354362
19-0.010015-0.07760.469212
20-0.059097-0.45780.324388
21-0.110397-0.85510.197939
22-0.151294-1.17190.122931
23-0.187632-1.45340.075663
24-0.221649-1.71690.045579
25-0.259556-2.01050.024439
26-0.296635-2.29770.01254
27-0.331953-2.57130.006314
28-0.360297-2.79090.003519
29-0.388033-3.00570.001932
30-0.413004-3.19910.001102
31-0.431389-3.34150.000719
32-0.444403-3.44230.000528
33-0.456781-3.53820.000392
34-0.459659-3.56050.000366
35-0.45722-3.54160.000388
36-0.452787-3.50730.000432
37-0.443955-3.43890.000534
38-0.43745-3.38850.000623
39-0.426817-3.30618e-04
40-0.412071-3.19190.001125
41-0.393624-3.0490.001707
42-0.372165-2.88280.002732
43-0.346573-2.68450.004688
44-0.32172-2.4920.007741
45-0.295821-2.29140.012733
46-0.269083-2.08430.020699
47-0.244606-1.89470.031476
48-0.221789-1.7180.04548


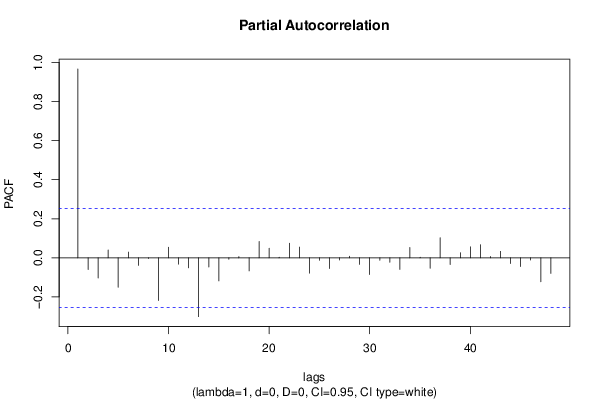
Partial Autocorrelation Function
Time lag kPACF(k)T-STATP-value
10.9670147.49050
2-0.059547-0.46130.323142
3-0.103492-0.80160.212961
40.0404580.31340.377538
5-0.150919-1.1690.12351
60.029520.22870.409956
7-0.038477-0.2980.383351
8-0.003759-0.02910.488434
9-0.218709-1.69410.047714
100.0543880.42130.337526
11-0.032074-0.24840.40232
12-0.051185-0.39650.34658
13-0.301029-2.33180.011544
14-0.046845-0.36290.358991
15-0.117885-0.91310.182413
16-0.007654-0.05930.476459
170.0062550.04840.48076
18-0.06681-0.51750.303352
190.0834850.64670.260156
200.0489340.3790.352997
210.0033320.02580.489746
220.0745620.57760.282862
230.0549890.42590.335836
24-0.078235-0.6060.2734
25-0.012302-0.09530.462201
26-0.054555-0.42260.337055
27-0.011098-0.0860.465891
280.0078750.0610.475782
29-0.033322-0.25810.398604
30-0.085397-0.66150.255417
31-0.012694-0.09830.461
32-0.022891-0.17730.42993
33-0.059178-0.45840.324165
340.0530280.41080.341359
350.00330.02560.489845
36-0.053065-0.4110.341253
370.1030950.79860.213845
38-0.033824-0.2620.397109
390.0263380.2040.419515
400.0562010.43530.332441
410.0666840.51650.303691
420.0066820.05180.479446
430.0330420.25590.399435
44-0.028909-0.22390.411787
45-0.044754-0.34670.365028
46-0.011336-0.08780.465159
47-0.122235-0.94680.173762
48-0.079728-0.61760.269597

\begin{tabular}{lllllllll}
\hline
Partial Autocorrelation Function \tabularnewline
Time lag k & PACF(k) & T-STAT & P-value \tabularnewline
1 & 0.967014 & 7.4905 & 0 \tabularnewline
2 & -0.059547 & -0.4613 & 0.323142 \tabularnewline
3 & -0.103492 & -0.8016 & 0.212961 \tabularnewline
4 & 0.040458 & 0.3134 & 0.377538 \tabularnewline
5 & -0.150919 & -1.169 & 0.12351 \tabularnewline
6 & 0.02952 & 0.2287 & 0.409956 \tabularnewline
7 & -0.038477 & -0.298 & 0.383351 \tabularnewline
8 & -0.003759 & -0.0291 & 0.488434 \tabularnewline
9 & -0.218709 & -1.6941 & 0.047714 \tabularnewline
10 & 0.054388 & 0.4213 & 0.337526 \tabularnewline
11 & -0.032074 & -0.2484 & 0.40232 \tabularnewline
12 & -0.051185 & -0.3965 & 0.34658 \tabularnewline
13 & -0.301029 & -2.3318 & 0.011544 \tabularnewline
14 & -0.046845 & -0.3629 & 0.358991 \tabularnewline
15 & -0.117885 & -0.9131 & 0.182413 \tabularnewline
16 & -0.007654 & -0.0593 & 0.476459 \tabularnewline
17 & 0.006255 & 0.0484 & 0.48076 \tabularnewline
18 & -0.06681 & -0.5175 & 0.303352 \tabularnewline
19 & 0.083485 & 0.6467 & 0.260156 \tabularnewline
20 & 0.048934 & 0.379 & 0.352997 \tabularnewline
21 & 0.003332 & 0.0258 & 0.489746 \tabularnewline
22 & 0.074562 & 0.5776 & 0.282862 \tabularnewline
23 & 0.054989 & 0.4259 & 0.335836 \tabularnewline
24 & -0.078235 & -0.606 & 0.2734 \tabularnewline
25 & -0.012302 & -0.0953 & 0.462201 \tabularnewline
26 & -0.054555 & -0.4226 & 0.337055 \tabularnewline
27 & -0.011098 & -0.086 & 0.465891 \tabularnewline
28 & 0.007875 & 0.061 & 0.475782 \tabularnewline
29 & -0.033322 & -0.2581 & 0.398604 \tabularnewline
30 & -0.085397 & -0.6615 & 0.255417 \tabularnewline
31 & -0.012694 & -0.0983 & 0.461 \tabularnewline
32 & -0.022891 & -0.1773 & 0.42993 \tabularnewline
33 & -0.059178 & -0.4584 & 0.324165 \tabularnewline
34 & 0.053028 & 0.4108 & 0.341359 \tabularnewline
35 & 0.0033 & 0.0256 & 0.489845 \tabularnewline
36 & -0.053065 & -0.411 & 0.341253 \tabularnewline
37 & 0.103095 & 0.7986 & 0.213845 \tabularnewline
38 & -0.033824 & -0.262 & 0.397109 \tabularnewline
39 & 0.026338 & 0.204 & 0.419515 \tabularnewline
40 & 0.056201 & 0.4353 & 0.332441 \tabularnewline
41 & 0.066684 & 0.5165 & 0.303691 \tabularnewline
42 & 0.006682 & 0.0518 & 0.479446 \tabularnewline
43 & 0.033042 & 0.2559 & 0.399435 \tabularnewline
44 & -0.028909 & -0.2239 & 0.411787 \tabularnewline
45 & -0.044754 & -0.3467 & 0.365028 \tabularnewline
46 & -0.011336 & -0.0878 & 0.465159 \tabularnewline
47 & -0.122235 & -0.9468 & 0.173762 \tabularnewline
48 & -0.079728 & -0.6176 & 0.269597 \tabularnewline
\hline
\end{tabular}
%Source: https://freestatistics.org/blog/index.php?pk=286108&T=2

[TABLE]
[ROW][C]Partial Autocorrelation Function[/C][/ROW]
[ROW][C]Time lag k[/C][C]PACF(k)[/C][C]T-STAT[/C][C]P-value[/C][/ROW]
[ROW][C]1[/C][C]0.967014[/C][C]7.4905[/C][C]0[/C][/ROW]
[ROW][C]2[/C][C]-0.059547[/C][C]-0.4613[/C][C]0.323142[/C][/ROW]
[ROW][C]3[/C][C]-0.103492[/C][C]-0.8016[/C][C]0.212961[/C][/ROW]
[ROW][C]4[/C][C]0.040458[/C][C]0.3134[/C][C]0.377538[/C][/ROW]
[ROW][C]5[/C][C]-0.150919[/C][C]-1.169[/C][C]0.12351[/C][/ROW]
[ROW][C]6[/C][C]0.02952[/C][C]0.2287[/C][C]0.409956[/C][/ROW]
[ROW][C]7[/C][C]-0.038477[/C][C]-0.298[/C][C]0.383351[/C][/ROW]
[ROW][C]8[/C][C]-0.003759[/C][C]-0.0291[/C][C]0.488434[/C][/ROW]
[ROW][C]9[/C][C]-0.218709[/C][C]-1.6941[/C][C]0.047714[/C][/ROW]
[ROW][C]10[/C][C]0.054388[/C][C]0.4213[/C][C]0.337526[/C][/ROW]
[ROW][C]11[/C][C]-0.032074[/C][C]-0.2484[/C][C]0.40232[/C][/ROW]
[ROW][C]12[/C][C]-0.051185[/C][C]-0.3965[/C][C]0.34658[/C][/ROW]
[ROW][C]13[/C][C]-0.301029[/C][C]-2.3318[/C][C]0.011544[/C][/ROW]
[ROW][C]14[/C][C]-0.046845[/C][C]-0.3629[/C][C]0.358991[/C][/ROW]
[ROW][C]15[/C][C]-0.117885[/C][C]-0.9131[/C][C]0.182413[/C][/ROW]
[ROW][C]16[/C][C]-0.007654[/C][C]-0.0593[/C][C]0.476459[/C][/ROW]
[ROW][C]17[/C][C]0.006255[/C][C]0.0484[/C][C]0.48076[/C][/ROW]
[ROW][C]18[/C][C]-0.06681[/C][C]-0.5175[/C][C]0.303352[/C][/ROW]
[ROW][C]19[/C][C]0.083485[/C][C]0.6467[/C][C]0.260156[/C][/ROW]
[ROW][C]20[/C][C]0.048934[/C][C]0.379[/C][C]0.352997[/C][/ROW]
[ROW][C]21[/C][C]0.003332[/C][C]0.0258[/C][C]0.489746[/C][/ROW]
[ROW][C]22[/C][C]0.074562[/C][C]0.5776[/C][C]0.282862[/C][/ROW]
[ROW][C]23[/C][C]0.054989[/C][C]0.4259[/C][C]0.335836[/C][/ROW]
[ROW][C]24[/C][C]-0.078235[/C][C]-0.606[/C][C]0.2734[/C][/ROW]
[ROW][C]25[/C][C]-0.012302[/C][C]-0.0953[/C][C]0.462201[/C][/ROW]
[ROW][C]26[/C][C]-0.054555[/C][C]-0.4226[/C][C]0.337055[/C][/ROW]
[ROW][C]27[/C][C]-0.011098[/C][C]-0.086[/C][C]0.465891[/C][/ROW]
[ROW][C]28[/C][C]0.007875[/C][C]0.061[/C][C]0.475782[/C][/ROW]
[ROW][C]29[/C][C]-0.033322[/C][C]-0.2581[/C][C]0.398604[/C][/ROW]
[ROW][C]30[/C][C]-0.085397[/C][C]-0.6615[/C][C]0.255417[/C][/ROW]
[ROW][C]31[/C][C]-0.012694[/C][C]-0.0983[/C][C]0.461[/C][/ROW]
[ROW][C]32[/C][C]-0.022891[/C][C]-0.1773[/C][C]0.42993[/C][/ROW]
[ROW][C]33[/C][C]-0.059178[/C][C]-0.4584[/C][C]0.324165[/C][/ROW]
[ROW][C]34[/C][C]0.053028[/C][C]0.4108[/C][C]0.341359[/C][/ROW]
[ROW][C]35[/C][C]0.0033[/C][C]0.0256[/C][C]0.489845[/C][/ROW]
[ROW][C]36[/C][C]-0.053065[/C][C]-0.411[/C][C]0.341253[/C][/ROW]
[ROW][C]37[/C][C]0.103095[/C][C]0.7986[/C][C]0.213845[/C][/ROW]
[ROW][C]38[/C][C]-0.033824[/C][C]-0.262[/C][C]0.397109[/C][/ROW]
[ROW][C]39[/C][C]0.026338[/C][C]0.204[/C][C]0.419515[/C][/ROW]
[ROW][C]40[/C][C]0.056201[/C][C]0.4353[/C][C]0.332441[/C][/ROW]
[ROW][C]41[/C][C]0.066684[/C][C]0.5165[/C][C]0.303691[/C][/ROW]
[ROW][C]42[/C][C]0.006682[/C][C]0.0518[/C][C]0.479446[/C][/ROW]
[ROW][C]43[/C][C]0.033042[/C][C]0.2559[/C][C]0.399435[/C][/ROW]
[ROW][C]44[/C][C]-0.028909[/C][C]-0.2239[/C][C]0.411787[/C][/ROW]
[ROW][C]45[/C][C]-0.044754[/C][C]-0.3467[/C][C]0.365028[/C][/ROW]
[ROW][C]46[/C][C]-0.011336[/C][C]-0.0878[/C][C]0.465159[/C][/ROW]
[ROW][C]47[/C][C]-0.122235[/C][C]-0.9468[/C][C]0.173762[/C][/ROW]
[ROW][C]48[/C][C]-0.079728[/C][C]-0.6176[/C][C]0.269597[/C][/ROW]
[/TABLE]
Source: https://freestatistics.org/blog/index.php?pk=286108&T=2

Globally Unique Identifier (entire table): ba.freestatistics.org/blog/index.php?pk=286108&T=2

As an alternative you can also use a QR Code:  

The GUIDs for individual cells are displayed in the table below:

Partial Autocorrelation Function
Time lag kPACF(k)T-STATP-value
10.9670147.49050
2-0.059547-0.46130.323142
3-0.103492-0.80160.212961
40.0404580.31340.377538
5-0.150919-1.1690.12351
60.029520.22870.409956
7-0.038477-0.2980.383351
8-0.003759-0.02910.488434
9-0.218709-1.69410.047714
100.0543880.42130.337526
11-0.032074-0.24840.40232
12-0.051185-0.39650.34658
13-0.301029-2.33180.011544
14-0.046845-0.36290.358991
15-0.117885-0.91310.182413
16-0.007654-0.05930.476459
170.0062550.04840.48076
18-0.06681-0.51750.303352
190.0834850.64670.260156
200.0489340.3790.352997
210.0033320.02580.489746
220.0745620.57760.282862
230.0549890.42590.335836
24-0.078235-0.6060.2734
25-0.012302-0.09530.462201
26-0.054555-0.42260.337055
27-0.011098-0.0860.465891
280.0078750.0610.475782
29-0.033322-0.25810.398604
30-0.085397-0.66150.255417
31-0.012694-0.09830.461
32-0.022891-0.17730.42993
33-0.059178-0.45840.324165
340.0530280.41080.341359
350.00330.02560.489845
36-0.053065-0.4110.341253
370.1030950.79860.213845
38-0.033824-0.2620.397109
390.0263380.2040.419515
400.0562010.43530.332441
410.0666840.51650.303691
420.0066820.05180.479446
430.0330420.25590.399435
44-0.028909-0.22390.411787
45-0.044754-0.34670.365028
46-0.011336-0.08780.465159
47-0.122235-0.94680.173762
48-0.079728-0.61760.269597


Parameters (Session):
par1 = 48 ; par2 = 1 ; par3 = 0 ; par4 = 0 ; par5 = 12 ; par6 = White Noise ; par7 = 0.95 ;
Parameters (R input):
par1 = 48 ; par2 = 1 ; par3 = 0 ; par4 = 0 ; par5 = 12 ; par6 = White Noise ; par7 = 0.95 ; par8 = ;
R code (references can be found in the software module):
if (par1 == 'Default') {
par1 = 10*log10(length(x))
} else {
par1 <- as.numeric(par1)
}
par2 <- as.numeric(par2)
par3 <- as.numeric(par3)
par4 <- as.numeric(par4)
par5 <- as.numeric(par5)
if (par6 == 'White Noise') par6 <- 'white' else par6 <- 'ma'
par7 <- as.numeric(par7)
if (par8 != '') par8 <- as.numeric(par8)
x <- na.omit(x)
ox <- x
if (par8 == '') {
if (par2 == 0) {
x <- log(x)
} else {
x <- (x ^ par2 - 1) / par2
}
} else {
x <- log(x,base=par8)
}
if (par3 > 0) x <- diff(x,lag=1,difference=par3)
if (par4 > 0) x <- diff(x,lag=par5,difference=par4)
bitmap(file='picts.png')
op <- par(mfrow=c(2,1))
plot(ox,type='l',main='Original Time Series',xlab='time',ylab='value')
if (par8=='') {
mytitle <- paste('Working Time Series (lambda=',par2,', d=',par3,', D=',par4,')',sep='')
mysub <- paste('(lambda=',par2,', d=',par3,', D=',par4,', CI=', par7, ', CI type=',par6,')',sep='')
} else {
mytitle <- paste('Working Time Series (base=',par8,', d=',par3,', D=',par4,')',sep='')
mysub <- paste('(base=',par8,', d=',par3,', D=',par4,', CI=', par7, ', CI type=',par6,')',sep='')
}
plot(x,type='l', main=mytitle,xlab='time',ylab='value')
par(op)
dev.off()
bitmap(file='pic1.png')
racf <- acf(x, par1, main='Autocorrelation', xlab='time lag', ylab='ACF', ci.type=par6, ci=par7, sub=mysub)
dev.off()
bitmap(file='pic2.png')
rpacf <- pacf(x,par1,main='Partial Autocorrelation',xlab='lags',ylab='PACF',sub=mysub)
dev.off()
(myacf <- c(racf$acf))
(mypacf <- c(rpacf$acf))
lengthx <- length(x)
sqrtn <- sqrt(lengthx)
load(file='createtable')
a<-table.start()
a<-table.row.start(a)
a<-table.element(a,'Autocorrelation Function',4,TRUE)
a<-table.row.end(a)
a<-table.row.start(a)
a<-table.element(a,'Time lag k',header=TRUE)
a<-table.element(a,hyperlink('basics.htm','ACF(k)','click here for more information about the Autocorrelation Function'),header=TRUE)
a<-table.element(a,'T-STAT',header=TRUE)
a<-table.element(a,'P-value',header=TRUE)
a<-table.row.end(a)
for (i in 2:(par1+1)) {
a<-table.row.start(a)
a<-table.element(a,i-1,header=TRUE)
a<-table.element(a,round(myacf[i],6))
mytstat <- myacf[i]*sqrtn
a<-table.element(a,round(mytstat,4))
a<-table.element(a,round(1-pt(abs(mytstat),lengthx),6))
a<-table.row.end(a)
}
a<-table.end(a)
table.save(a,file='mytable.tab')
a<-table.start()
a<-table.row.start(a)
a<-table.element(a,'Partial Autocorrelation Function',4,TRUE)
a<-table.row.end(a)
a<-table.row.start(a)
a<-table.element(a,'Time lag k',header=TRUE)
a<-table.element(a,hyperlink('basics.htm','PACF(k)','click here for more information about the Partial Autocorrelation Function'),header=TRUE)
a<-table.element(a,'T-STAT',header=TRUE)
a<-table.element(a,'P-value',header=TRUE)
a<-table.row.end(a)
for (i in 1:par1) {
a<-table.row.start(a)
a<-table.element(a,i,header=TRUE)
a<-table.element(a,round(mypacf[i],6))
mytstat <- mypacf[i]*sqrtn
a<-table.element(a,round(mytstat,4))
a<-table.element(a,round(1-pt(abs(mytstat),lengthx),6))
a<-table.row.end(a)
}
a<-table.end(a)
table.save(a,file='mytable1.tab')