Free Statistics

of Irreproducible Research!

Author's title

Author*The author of this computation has been verified*
R Software Modulerwasp_centraltendency.wasp
Title produced by softwareCentral Tendency
Date of computationSun, 13 Dec 2015 12:40:19 +0000
Cite this page as followsStatistical Computations at FreeStatistics.org, Office for Research Development and Education, URL https://freestatistics.org/blog/index.php?v=date/2015/Dec/13/t145001043158ly77hxrulh4it.htm/, Retrieved Thu, 16 May 2024 15:35:53 +0000
Statistical Computations at FreeStatistics.org, Office for Research Development and Education, URL https://freestatistics.org/blog/index.php?pk=286161, Retrieved Thu, 16 May 2024 15:35:53 +0000
QR Codes:

Original text written by user:
IsPrivate?No (this computation is public)
User-defined keywords
Estimated Impact114
Family? (F = Feedback message, R = changed R code, M = changed R Module, P = changed Parameters, D = changed Data)
-       [Central Tendency] [paper3] [2015-12-13 12:40:19] [1e67203134127d491eaf7d256835640d] [Current]
Feedback Forum

Post a new message
Dataseries X:
242961
273849
273528
245372
217615
208888
187797
167503
161264
177969
199128
237538
257043
259605
255538
249583
237399
224687
208658
210871
228047
253089
271250
279551
278778
253214
242542
281133
290200
277630
289492
306752
315256


Summary of computational transaction
Raw Inputview raw input (R code)
Raw Outputview raw output of R engine
Computing time1 seconds
R Server'Gertrude Mary Cox' @ cox.wessa.net

\begin{tabular}{lllllllll}
\hline
Summary of computational transaction \tabularnewline
Raw Input & view raw input (R code)  \tabularnewline
Raw Output & view raw output of R engine  \tabularnewline
Computing time & 1 seconds \tabularnewline
R Server & 'Gertrude Mary Cox' @ cox.wessa.net \tabularnewline
\hline
\end{tabular}
%Source: https://freestatistics.org/blog/index.php?pk=286161&T=0

[TABLE]
[ROW][C]Summary of computational transaction[/C][/ROW]
[ROW][C]Raw Input[/C][C]view raw input (R code) [/C][/ROW]
[ROW][C]Raw Output[/C][C]view raw output of R engine [/C][/ROW]
[ROW][C]Computing time[/C][C]1 seconds[/C][/ROW]
[ROW][C]R Server[/C][C]'Gertrude Mary Cox' @ cox.wessa.net[/C][/ROW]
[/TABLE]
Source: https://freestatistics.org/blog/index.php?pk=286161&T=0

Globally Unique Identifier (entire table): ba.freestatistics.org/blog/index.php?pk=286161&T=0

As an alternative you can also use a QR Code:  

The GUIDs for individual cells are displayed in the table below:

Summary of computational transaction
Raw Inputview raw input (R code)
Raw Outputview raw output of R engine
Computing time1 seconds
R Server'Gertrude Mary Cox' @ cox.wessa.net


Central Tendency - Ungrouped Data
MeasureValueS.E.Value/S.E.
Arithmetic Mean244355.4545454556789.030690604935.9926866855396
Geometric Mean241129.44108603
Harmonic Mean237685.834238202
Quadratic Mean247355.004342121
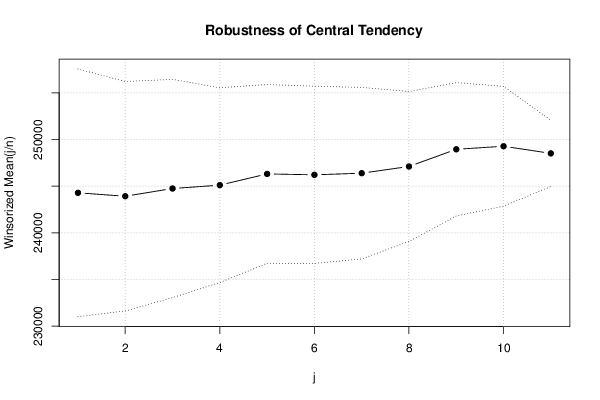
Winsorized Mean ( 1 / 11 )244286.8181818186638.7026858596236.7973728816245
Winsorized Mean ( 2 / 11 )243917.969696976150.9404178260139.6553946434065
Winsorized Mean ( 3 / 11 )244747.0606060615849.7506696963241.8388875741206
Winsorized Mean ( 4 / 11 )245107.3030303035219.6146366818846.9588887477943
Winsorized Mean ( 5 / 11 )246311.5454545454790.8005955960151.4134413527814
Winsorized Mean ( 6 / 11 )246212.8181818184750.2389733455751.8316698514247
Winsorized Mean ( 7 / 11 )246389.9393939394595.8349797256753.6115723216517
Winsorized Mean ( 8 / 11 )247108.2424242424017.3833085460861.5097498659326
Winsorized Mean ( 9 / 11 )248949.4242424243571.9698784504669.6952753561348
Winsorized Mean ( 10 / 11 )249277.3030303033210.4937782466977.6445370239709
Winsorized Mean ( 11 / 11 )248512.969696971773.57795494923140.119563960234
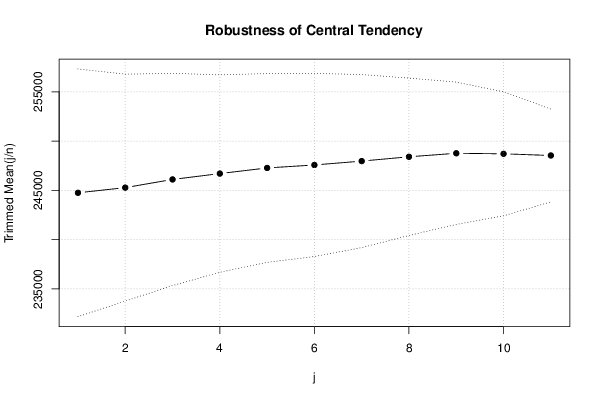
Trimmed Mean ( 1 / 11 )244748.7096774196285.0016833375638.9417094869335
Trimmed Mean ( 2 / 11 )245274.3103448285757.5009789336842.6008282486221
Trimmed Mean ( 3 / 11 )246103.1851851855384.1023149636845.7092326238316
Trimmed Mean ( 4 / 11 )246699.885009.801382064349.2434452358163
Trimmed Mean ( 5 / 11 )247271.1304347834788.5396972389251.6381080807077
Trimmed Mean ( 6 / 11 )247572.7142857144646.4945978984353.2816102697481
Trimmed Mean ( 7 / 11 )247966.3684210534391.1599715756256.4694454372334
Trimmed Mean ( 8 / 11 )248403.5294117653992.3159255492962.2204089165583
Trimmed Mean ( 9 / 11 )248759.7333333333610.8215520342368.8928349818864
Trimmed Mean ( 10 / 11 )248706.2307692313147.0234637605779.0290360504769
Trimmed Mean ( 11 / 11 )248534.9090909092354.17971220452105.571765741781
Median249583
Midrange238260
Midmean - Weighted Average at Xnp246813.1875
Midmean - Weighted Average at X(n+1)p248403.529411765
Midmean - Empirical Distribution Function248403.529411765
Midmean - Empirical Distribution Function - Averaging248403.529411765
Midmean - Empirical Distribution Function - Interpolation248403.529411765
Midmean - Closest Observation246318.388888889
Midmean - True Basic - Statistics Graphics Toolkit248403.529411765
Midmean - MS Excel (old versions)248403.529411765
Number of observations33

\begin{tabular}{lllllllll}
\hline
Central Tendency - Ungrouped Data \tabularnewline
Measure & Value & S.E. & Value/S.E. \tabularnewline
Arithmetic Mean & 244355.454545455 & 6789.0306906049 & 35.9926866855396 \tabularnewline
Geometric Mean & 241129.44108603 &  &  \tabularnewline
Harmonic Mean & 237685.834238202 &  &  \tabularnewline
Quadratic Mean & 247355.004342121 &  &  \tabularnewline
Winsorized Mean ( 1 / 11 ) & 244286.818181818 & 6638.70268585962 & 36.7973728816245 \tabularnewline
Winsorized Mean ( 2 / 11 ) & 243917.96969697 & 6150.94041782601 & 39.6553946434065 \tabularnewline
Winsorized Mean ( 3 / 11 ) & 244747.060606061 & 5849.75066969632 & 41.8388875741206 \tabularnewline
Winsorized Mean ( 4 / 11 ) & 245107.303030303 & 5219.61463668188 & 46.9588887477943 \tabularnewline
Winsorized Mean ( 5 / 11 ) & 246311.545454545 & 4790.80059559601 & 51.4134413527814 \tabularnewline
Winsorized Mean ( 6 / 11 ) & 246212.818181818 & 4750.23897334557 & 51.8316698514247 \tabularnewline
Winsorized Mean ( 7 / 11 ) & 246389.939393939 & 4595.83497972567 & 53.6115723216517 \tabularnewline
Winsorized Mean ( 8 / 11 ) & 247108.242424242 & 4017.38330854608 & 61.5097498659326 \tabularnewline
Winsorized Mean ( 9 / 11 ) & 248949.424242424 & 3571.96987845046 & 69.6952753561348 \tabularnewline
Winsorized Mean ( 10 / 11 ) & 249277.303030303 & 3210.49377824669 & 77.6445370239709 \tabularnewline
Winsorized Mean ( 11 / 11 ) & 248512.96969697 & 1773.57795494923 & 140.119563960234 \tabularnewline
Trimmed Mean ( 1 / 11 ) & 244748.709677419 & 6285.00168333756 & 38.9417094869335 \tabularnewline
Trimmed Mean ( 2 / 11 ) & 245274.310344828 & 5757.50097893368 & 42.6008282486221 \tabularnewline
Trimmed Mean ( 3 / 11 ) & 246103.185185185 & 5384.10231496368 & 45.7092326238316 \tabularnewline
Trimmed Mean ( 4 / 11 ) & 246699.88 & 5009.8013820643 & 49.2434452358163 \tabularnewline
Trimmed Mean ( 5 / 11 ) & 247271.130434783 & 4788.53969723892 & 51.6381080807077 \tabularnewline
Trimmed Mean ( 6 / 11 ) & 247572.714285714 & 4646.49459789843 & 53.2816102697481 \tabularnewline
Trimmed Mean ( 7 / 11 ) & 247966.368421053 & 4391.15997157562 & 56.4694454372334 \tabularnewline
Trimmed Mean ( 8 / 11 ) & 248403.529411765 & 3992.31592554929 & 62.2204089165583 \tabularnewline
Trimmed Mean ( 9 / 11 ) & 248759.733333333 & 3610.82155203423 & 68.8928349818864 \tabularnewline
Trimmed Mean ( 10 / 11 ) & 248706.230769231 & 3147.02346376057 & 79.0290360504769 \tabularnewline
Trimmed Mean ( 11 / 11 ) & 248534.909090909 & 2354.17971220452 & 105.571765741781 \tabularnewline
Median & 249583 &  &  \tabularnewline
Midrange & 238260 &  &  \tabularnewline
Midmean - Weighted Average at Xnp & 246813.1875 &  &  \tabularnewline
Midmean - Weighted Average at X(n+1)p & 248403.529411765 &  &  \tabularnewline
Midmean - Empirical Distribution Function & 248403.529411765 &  &  \tabularnewline
Midmean - Empirical Distribution Function - Averaging & 248403.529411765 &  &  \tabularnewline
Midmean - Empirical Distribution Function - Interpolation & 248403.529411765 &  &  \tabularnewline
Midmean - Closest Observation & 246318.388888889 &  &  \tabularnewline
Midmean - True Basic - Statistics Graphics Toolkit & 248403.529411765 &  &  \tabularnewline
Midmean - MS Excel (old versions) & 248403.529411765 &  &  \tabularnewline
Number of observations & 33 &  &  \tabularnewline
\hline
\end{tabular}
%Source: https://freestatistics.org/blog/index.php?pk=286161&T=1

[TABLE]
[ROW][C]Central Tendency - Ungrouped Data[/C][/ROW]
[ROW][C]Measure[/C][C]Value[/C][C]S.E.[/C][C]Value/S.E.[/C][/ROW]
[ROW][C]Arithmetic Mean[/C][C]244355.454545455[/C][C]6789.0306906049[/C][C]35.9926866855396[/C][/ROW]
[ROW][C]Geometric Mean[/C][C]241129.44108603[/C][C][/C][C][/C][/ROW]
[ROW][C]Harmonic Mean[/C][C]237685.834238202[/C][C][/C][C][/C][/ROW]
[ROW][C]Quadratic Mean[/C][C]247355.004342121[/C][C][/C][C][/C][/ROW]
[ROW][C]Winsorized Mean ( 1 / 11 )[/C][C]244286.818181818[/C][C]6638.70268585962[/C][C]36.7973728816245[/C][/ROW]
[ROW][C]Winsorized Mean ( 2 / 11 )[/C][C]243917.96969697[/C][C]6150.94041782601[/C][C]39.6553946434065[/C][/ROW]
[ROW][C]Winsorized Mean ( 3 / 11 )[/C][C]244747.060606061[/C][C]5849.75066969632[/C][C]41.8388875741206[/C][/ROW]
[ROW][C]Winsorized Mean ( 4 / 11 )[/C][C]245107.303030303[/C][C]5219.61463668188[/C][C]46.9588887477943[/C][/ROW]
[ROW][C]Winsorized Mean ( 5 / 11 )[/C][C]246311.545454545[/C][C]4790.80059559601[/C][C]51.4134413527814[/C][/ROW]
[ROW][C]Winsorized Mean ( 6 / 11 )[/C][C]246212.818181818[/C][C]4750.23897334557[/C][C]51.8316698514247[/C][/ROW]
[ROW][C]Winsorized Mean ( 7 / 11 )[/C][C]246389.939393939[/C][C]4595.83497972567[/C][C]53.6115723216517[/C][/ROW]
[ROW][C]Winsorized Mean ( 8 / 11 )[/C][C]247108.242424242[/C][C]4017.38330854608[/C][C]61.5097498659326[/C][/ROW]
[ROW][C]Winsorized Mean ( 9 / 11 )[/C][C]248949.424242424[/C][C]3571.96987845046[/C][C]69.6952753561348[/C][/ROW]
[ROW][C]Winsorized Mean ( 10 / 11 )[/C][C]249277.303030303[/C][C]3210.49377824669[/C][C]77.6445370239709[/C][/ROW]
[ROW][C]Winsorized Mean ( 11 / 11 )[/C][C]248512.96969697[/C][C]1773.57795494923[/C][C]140.119563960234[/C][/ROW]
[ROW][C]Trimmed Mean ( 1 / 11 )[/C][C]244748.709677419[/C][C]6285.00168333756[/C][C]38.9417094869335[/C][/ROW]
[ROW][C]Trimmed Mean ( 2 / 11 )[/C][C]245274.310344828[/C][C]5757.50097893368[/C][C]42.6008282486221[/C][/ROW]
[ROW][C]Trimmed Mean ( 3 / 11 )[/C][C]246103.185185185[/C][C]5384.10231496368[/C][C]45.7092326238316[/C][/ROW]
[ROW][C]Trimmed Mean ( 4 / 11 )[/C][C]246699.88[/C][C]5009.8013820643[/C][C]49.2434452358163[/C][/ROW]
[ROW][C]Trimmed Mean ( 5 / 11 )[/C][C]247271.130434783[/C][C]4788.53969723892[/C][C]51.6381080807077[/C][/ROW]
[ROW][C]Trimmed Mean ( 6 / 11 )[/C][C]247572.714285714[/C][C]4646.49459789843[/C][C]53.2816102697481[/C][/ROW]
[ROW][C]Trimmed Mean ( 7 / 11 )[/C][C]247966.368421053[/C][C]4391.15997157562[/C][C]56.4694454372334[/C][/ROW]
[ROW][C]Trimmed Mean ( 8 / 11 )[/C][C]248403.529411765[/C][C]3992.31592554929[/C][C]62.2204089165583[/C][/ROW]
[ROW][C]Trimmed Mean ( 9 / 11 )[/C][C]248759.733333333[/C][C]3610.82155203423[/C][C]68.8928349818864[/C][/ROW]
[ROW][C]Trimmed Mean ( 10 / 11 )[/C][C]248706.230769231[/C][C]3147.02346376057[/C][C]79.0290360504769[/C][/ROW]
[ROW][C]Trimmed Mean ( 11 / 11 )[/C][C]248534.909090909[/C][C]2354.17971220452[/C][C]105.571765741781[/C][/ROW]
[ROW][C]Median[/C][C]249583[/C][C][/C][C][/C][/ROW]
[ROW][C]Midrange[/C][C]238260[/C][C][/C][C][/C][/ROW]
[ROW][C]Midmean - Weighted Average at Xnp[/C][C]246813.1875[/C][C][/C][C][/C][/ROW]
[ROW][C]Midmean - Weighted Average at X(n+1)p[/C][C]248403.529411765[/C][C][/C][C][/C][/ROW]
[ROW][C]Midmean - Empirical Distribution Function[/C][C]248403.529411765[/C][C][/C][C][/C][/ROW]
[ROW][C]Midmean - Empirical Distribution Function - Averaging[/C][C]248403.529411765[/C][C][/C][C][/C][/ROW]
[ROW][C]Midmean - Empirical Distribution Function - Interpolation[/C][C]248403.529411765[/C][C][/C][C][/C][/ROW]
[ROW][C]Midmean - Closest Observation[/C][C]246318.388888889[/C][C][/C][C][/C][/ROW]
[ROW][C]Midmean - True Basic - Statistics Graphics Toolkit[/C][C]248403.529411765[/C][C][/C][C][/C][/ROW]
[ROW][C]Midmean - MS Excel (old versions)[/C][C]248403.529411765[/C][C][/C][C][/C][/ROW]
[ROW][C]Number of observations[/C][C]33[/C][C][/C][C][/C][/ROW]
[/TABLE]
Source: https://freestatistics.org/blog/index.php?pk=286161&T=1

Globally Unique Identifier (entire table): ba.freestatistics.org/blog/index.php?pk=286161&T=1

As an alternative you can also use a QR Code:  

The GUIDs for individual cells are displayed in the table below:

Central Tendency - Ungrouped Data
MeasureValueS.E.Value/S.E.
Arithmetic Mean244355.4545454556789.030690604935.9926866855396
Geometric Mean241129.44108603
Harmonic Mean237685.834238202
Quadratic Mean247355.004342121
Winsorized Mean ( 1 / 11 )244286.8181818186638.7026858596236.7973728816245
Winsorized Mean ( 2 / 11 )243917.969696976150.9404178260139.6553946434065
Winsorized Mean ( 3 / 11 )244747.0606060615849.7506696963241.8388875741206
Winsorized Mean ( 4 / 11 )245107.3030303035219.6146366818846.9588887477943
Winsorized Mean ( 5 / 11 )246311.5454545454790.8005955960151.4134413527814
Winsorized Mean ( 6 / 11 )246212.8181818184750.2389733455751.8316698514247
Winsorized Mean ( 7 / 11 )246389.9393939394595.8349797256753.6115723216517
Winsorized Mean ( 8 / 11 )247108.2424242424017.3833085460861.5097498659326
Winsorized Mean ( 9 / 11 )248949.4242424243571.9698784504669.6952753561348
Winsorized Mean ( 10 / 11 )249277.3030303033210.4937782466977.6445370239709
Winsorized Mean ( 11 / 11 )248512.969696971773.57795494923140.119563960234
Trimmed Mean ( 1 / 11 )244748.7096774196285.0016833375638.9417094869335
Trimmed Mean ( 2 / 11 )245274.3103448285757.5009789336842.6008282486221
Trimmed Mean ( 3 / 11 )246103.1851851855384.1023149636845.7092326238316
Trimmed Mean ( 4 / 11 )246699.885009.801382064349.2434452358163
Trimmed Mean ( 5 / 11 )247271.1304347834788.5396972389251.6381080807077
Trimmed Mean ( 6 / 11 )247572.7142857144646.4945978984353.2816102697481
Trimmed Mean ( 7 / 11 )247966.3684210534391.1599715756256.4694454372334
Trimmed Mean ( 8 / 11 )248403.5294117653992.3159255492962.2204089165583
Trimmed Mean ( 9 / 11 )248759.7333333333610.8215520342368.8928349818864
Trimmed Mean ( 10 / 11 )248706.2307692313147.0234637605779.0290360504769
Trimmed Mean ( 11 / 11 )248534.9090909092354.17971220452105.571765741781
Median249583
Midrange238260
Midmean - Weighted Average at Xnp246813.1875
Midmean - Weighted Average at X(n+1)p248403.529411765
Midmean - Empirical Distribution Function248403.529411765
Midmean - Empirical Distribution Function - Averaging248403.529411765
Midmean - Empirical Distribution Function - Interpolation248403.529411765
Midmean - Closest Observation246318.388888889
Midmean - True Basic - Statistics Graphics Toolkit248403.529411765
Midmean - MS Excel (old versions)248403.529411765
Number of observations33


Parameters (Session):
Parameters (R input):
R code (references can be found in the software module):
geomean <- function(x) {
return(exp(mean(log(x))))
}
harmean <- function(x) {
return(1/mean(1/x))
}
quamean <- function(x) {
return(sqrt(mean(x*x)))
}
winmean <- function(x) {
x <-sort(x[!is.na(x)])
n<-length(x)
denom <- 3
nodenom <- n/denom
if (nodenom>40) denom <- n/40
sqrtn = sqrt(n)
roundnodenom = floor(nodenom)
win <- array(NA,dim=c(roundnodenom,2))
for (j in 1:roundnodenom) {
win[j,1] <- (j*x[j+1]+sum(x[(j+1):(n-j)])+j*x[n-j])/n
win[j,2] <- sd(c(rep(x[j+1],j),x[(j+1):(n-j)],rep(x[n-j],j)))/sqrtn
}
return(win)
}
trimean <- function(x) {
x <-sort(x[!is.na(x)])
n<-length(x)
denom <- 3
nodenom <- n/denom
if (nodenom>40) denom <- n/40
sqrtn = sqrt(n)
roundnodenom = floor(nodenom)
tri <- array(NA,dim=c(roundnodenom,2))
for (j in 1:roundnodenom) {
tri[j,1] <- mean(x,trim=j/n)
tri[j,2] <- sd(x[(j+1):(n-j)]) / sqrt(n-j*2)
}
return(tri)
}
midrange <- function(x) {
return((max(x)+min(x))/2)
}
q1 <- function(data,n,p,i,f) {
np <- n*p;
i <<- floor(np)
f <<- np - i
qvalue <- (1-f)*data[i] + f*data[i+1]
}
q2 <- function(data,n,p,i,f) {
np <- (n+1)*p
i <<- floor(np)
f <<- np - i
qvalue <- (1-f)*data[i] + f*data[i+1]
}
q3 <- function(data,n,p,i,f) {
np <- n*p
i <<- floor(np)
f <<- np - i
if (f==0) {
qvalue <- data[i]
} else {
qvalue <- data[i+1]
}
}
q4 <- function(data,n,p,i,f) {
np <- n*p
i <<- floor(np)
f <<- np - i
if (f==0) {
qvalue <- (data[i]+data[i+1])/2
} else {
qvalue <- data[i+1]
}
}
q5 <- function(data,n,p,i,f) {
np <- (n-1)*p
i <<- floor(np)
f <<- np - i
if (f==0) {
qvalue <- data[i+1]
} else {
qvalue <- data[i+1] + f*(data[i+2]-data[i+1])
}
}
q6 <- function(data,n,p,i,f) {
np <- n*p+0.5
i <<- floor(np)
f <<- np - i
qvalue <- data[i]
}
q7 <- function(data,n,p,i,f) {
np <- (n+1)*p
i <<- floor(np)
f <<- np - i
if (f==0) {
qvalue <- data[i]
} else {
qvalue <- f*data[i] + (1-f)*data[i+1]
}
}
q8 <- function(data,n,p,i,f) {
np <- (n+1)*p
i <<- floor(np)
f <<- np - i
if (f==0) {
qvalue <- data[i]
} else {
if (f == 0.5) {
qvalue <- (data[i]+data[i+1])/2
} else {
if (f < 0.5) {
qvalue <- data[i]
} else {
qvalue <- data[i+1]
}
}
}
}
midmean <- function(x,def) {
x <-sort(x[!is.na(x)])
n<-length(x)
if (def==1) {
qvalue1 <- q1(x,n,0.25,i,f)
qvalue3 <- q1(x,n,0.75,i,f)
}
if (def==2) {
qvalue1 <- q2(x,n,0.25,i,f)
qvalue3 <- q2(x,n,0.75,i,f)
}
if (def==3) {
qvalue1 <- q3(x,n,0.25,i,f)
qvalue3 <- q3(x,n,0.75,i,f)
}
if (def==4) {
qvalue1 <- q4(x,n,0.25,i,f)
qvalue3 <- q4(x,n,0.75,i,f)
}
if (def==5) {
qvalue1 <- q5(x,n,0.25,i,f)
qvalue3 <- q5(x,n,0.75,i,f)
}
if (def==6) {
qvalue1 <- q6(x,n,0.25,i,f)
qvalue3 <- q6(x,n,0.75,i,f)
}
if (def==7) {
qvalue1 <- q7(x,n,0.25,i,f)
qvalue3 <- q7(x,n,0.75,i,f)
}
if (def==8) {
qvalue1 <- q8(x,n,0.25,i,f)
qvalue3 <- q8(x,n,0.75,i,f)
}
midm <- 0
myn <- 0
roundno4 <- round(n/4)
round3no4 <- round(3*n/4)
for (i in 1:n) {
if ((x[i]>=qvalue1) & (x[i]<=qvalue3)){
midm = midm + x[i]
myn = myn + 1
}
}
midm = midm / myn
return(midm)
}
(arm <- mean(x))
sqrtn <- sqrt(length(x))
(armse <- sd(x) / sqrtn)
(armose <- arm / armse)
(geo <- geomean(x))
(har <- harmean(x))
(qua <- quamean(x))
(win <- winmean(x))
(tri <- trimean(x))
(midr <- midrange(x))
midm <- array(NA,dim=8)
for (j in 1:8) midm[j] <- midmean(x,j)
midm
bitmap(file='test1.png')
lb <- win[,1] - 2*win[,2]
ub <- win[,1] + 2*win[,2]
if ((ylimmin == '') | (ylimmax == '')) plot(win[,1],type='b',main=main, xlab='j', pch=19, ylab='Winsorized Mean(j/n)', ylim=c(min(lb),max(ub))) else plot(win[,1],type='l',main=main, xlab='j', pch=19, ylab='Winsorized Mean(j/n)', ylim=c(ylimmin,ylimmax))
lines(ub,lty=3)
lines(lb,lty=3)
grid()
dev.off()
bitmap(file='test2.png')
lb <- tri[,1] - 2*tri[,2]
ub <- tri[,1] + 2*tri[,2]
if ((ylimmin == '') | (ylimmax == '')) plot(tri[,1],type='b',main=main, xlab='j', pch=19, ylab='Trimmed Mean(j/n)', ylim=c(min(lb),max(ub))) else plot(tri[,1],type='l',main=main, xlab='j', pch=19, ylab='Trimmed Mean(j/n)', ylim=c(ylimmin,ylimmax))
lines(ub,lty=3)
lines(lb,lty=3)
grid()
dev.off()
load(file='createtable')
a<-table.start()
a<-table.row.start(a)
a<-table.element(a,'Central Tendency - Ungrouped Data',4,TRUE)
a<-table.row.end(a)
a<-table.row.start(a)
a<-table.element(a,'Measure',header=TRUE)
a<-table.element(a,'Value',header=TRUE)
a<-table.element(a,'S.E.',header=TRUE)
a<-table.element(a,'Value/S.E.',header=TRUE)
a<-table.row.end(a)
a<-table.row.start(a)
a<-table.element(a,hyperlink('arithmetic_mean.htm', 'Arithmetic Mean', 'click to view the definition of the Arithmetic Mean'),header=TRUE)
a<-table.element(a,arm)
a<-table.element(a,hyperlink('arithmetic_mean_standard_error.htm', armse, 'click to view the definition of the Standard Error of the Arithmetic Mean'))
a<-table.element(a,armose)
a<-table.row.end(a)
a<-table.row.start(a)
a<-table.element(a,hyperlink('geometric_mean.htm', 'Geometric Mean', 'click to view the definition of the Geometric Mean'),header=TRUE)
a<-table.element(a,geo)
a<-table.element(a,'')
a<-table.row.end(a)
a<-table.row.start(a)
a<-table.element(a,hyperlink('harmonic_mean.htm', 'Harmonic Mean', 'click to view the definition of the Harmonic Mean'),header=TRUE)
a<-table.element(a,har)
a<-table.element(a,'')
a<-table.row.end(a)
a<-table.row.start(a)
a<-table.element(a,hyperlink('quadratic_mean.htm', 'Quadratic Mean', 'click to view the definition of the Quadratic Mean'),header=TRUE)
a<-table.element(a,qua)
a<-table.element(a,'')
a<-table.row.end(a)
for (j in 1:length(win[,1])) {
a<-table.row.start(a)
mylabel <- paste('Winsorized Mean (',j)
mylabel <- paste(mylabel,'/')
mylabel <- paste(mylabel,length(win[,1]))
mylabel <- paste(mylabel,')')
a<-table.element(a,hyperlink('winsorized_mean.htm', mylabel, 'click to view the definition of the Winsorized Mean'),header=TRUE)
a<-table.element(a,win[j,1])
a<-table.element(a,win[j,2])
a<-table.element(a,win[j,1]/win[j,2])
a<-table.row.end(a)
}
for (j in 1:length(tri[,1])) {
a<-table.row.start(a)
mylabel <- paste('Trimmed Mean (',j)
mylabel <- paste(mylabel,'/')
mylabel <- paste(mylabel,length(tri[,1]))
mylabel <- paste(mylabel,')')
a<-table.element(a,hyperlink('arithmetic_mean.htm', mylabel, 'click to view the definition of the Trimmed Mean'),header=TRUE)
a<-table.element(a,tri[j,1])
a<-table.element(a,tri[j,2])
a<-table.element(a,tri[j,1]/tri[j,2])
a<-table.row.end(a)
}
a<-table.row.start(a)
a<-table.element(a,hyperlink('median_1.htm', 'Median', 'click to view the definition of the Median'),header=TRUE)
a<-table.element(a,median(x))
a<-table.element(a,'')
a<-table.row.end(a)
a<-table.row.start(a)
a<-table.element(a,hyperlink('midrange.htm', 'Midrange', 'click to view the definition of the Midrange'),header=TRUE)
a<-table.element(a,midr)
a<-table.element(a,'')
a<-table.row.end(a)
a<-table.row.start(a)
mymid <- hyperlink('midmean.htm', 'Midmean', 'click to view the definition of the Midmean')
mylabel <- paste(mymid,hyperlink('method_1.htm','Weighted Average at Xnp',''),sep=' - ')
a<-table.element(a,mylabel,header=TRUE)
a<-table.element(a,midm[1])
a<-table.element(a,'')
a<-table.row.end(a)
a<-table.row.start(a)
mymid <- hyperlink('midmean.htm', 'Midmean', 'click to view the definition of the Midmean')
mylabel <- paste(mymid,hyperlink('method_2.htm','Weighted Average at X(n+1)p',''),sep=' - ')
a<-table.element(a,mylabel,header=TRUE)
a<-table.element(a,midm[2])
a<-table.element(a,'')
a<-table.row.end(a)
a<-table.row.start(a)
mymid <- hyperlink('midmean.htm', 'Midmean', 'click to view the definition of the Midmean')
mylabel <- paste(mymid,hyperlink('method_3.htm','Empirical Distribution Function',''),sep=' - ')
a<-table.element(a,mylabel,header=TRUE)
a<-table.element(a,midm[3])
a<-table.element(a,'')
a<-table.row.end(a)
a<-table.row.start(a)
mymid <- hyperlink('midmean.htm', 'Midmean', 'click to view the definition of the Midmean')
mylabel <- paste(mymid,hyperlink('method_4.htm','Empirical Distribution Function - Averaging',''),sep=' - ')
a<-table.element(a,mylabel,header=TRUE)
a<-table.element(a,midm[4])
a<-table.element(a,'')
a<-table.row.end(a)
a<-table.row.start(a)
mymid <- hyperlink('midmean.htm', 'Midmean', 'click to view the definition of the Midmean')
mylabel <- paste(mymid,hyperlink('method_5.htm','Empirical Distribution Function - Interpolation',''),sep=' - ')
a<-table.element(a,mylabel,header=TRUE)
a<-table.element(a,midm[5])
a<-table.element(a,'')
a<-table.row.end(a)
a<-table.row.start(a)
mymid <- hyperlink('midmean.htm', 'Midmean', 'click to view the definition of the Midmean')
mylabel <- paste(mymid,hyperlink('method_6.htm','Closest Observation',''),sep=' - ')
a<-table.element(a,mylabel,header=TRUE)
a<-table.element(a,midm[6])
a<-table.element(a,'')
a<-table.row.end(a)
a<-table.row.start(a)
mymid <- hyperlink('midmean.htm', 'Midmean', 'click to view the definition of the Midmean')
mylabel <- paste(mymid,hyperlink('method_7.htm','True Basic - Statistics Graphics Toolkit',''),sep=' - ')
a<-table.element(a,mylabel,header=TRUE)
a<-table.element(a,midm[7])
a<-table.element(a,'')
a<-table.row.end(a)
a<-table.row.start(a)
mymid <- hyperlink('midmean.htm', 'Midmean', 'click to view the definition of the Midmean')
mylabel <- paste(mymid,hyperlink('method_8.htm','MS Excel (old versions)',''),sep=' - ')
a<-table.element(a,mylabel,header=TRUE)
a<-table.element(a,midm[8])
a<-table.element(a,'')
a<-table.row.end(a)
a<-table.row.start(a)
a<-table.element(a,'Number of observations',header=TRUE)
a<-table.element(a,length(x))
a<-table.element(a,'')
a<-table.row.end(a)
a<-table.end(a)
table.save(a,file='mytable.tab')